

Transient performance of vanadium redox flow battery: effects of flow channels
 0
0 Abstract
As one of the key technologies in energy storage, vanadium flow batteries have received widespread attention in the field of renewable energy due to their unique performance. This study uses a three-dimensional numerical model to simulate and analyze different flow channel structures, such as parallel, interdigitated, interdigitated channels with pins, and serpentine channels, to explore the impact of geometric design on battery performance. Research results show that the pressure drop of the flow channel is closely related to the structural design. The serpentine channel has the highest pressure drop of 5,023.4 Pa, but its charge and discharge capacity and performance are the best. In terms of the impact of operating parameters, when current density increases from 60 to 100 mA cm-2, the Coulombic efficiency increases from 98.2% to 99%, but voltage efficiency is reduced from 92.4% to 89%, and energy efficiency also decreases from 90.7% to 88.1% due to the increase in concentration polarization and ohmic loss. On the other hand, increasing the electrolyte flow rate from 20 to 100 mL min-1 can reduce concentration polarization, and the battery’s charging capacity and discharge capacity increase by 7.2% and 7.9%, respectively. Coulombic efficiency, voltage efficiency, and energy efficiency increase by 0.5%, 0.7%, and 1.2%, respectively. However, the increase in capacity and battery efficiency is becoming increasingly gradual, and excessive flow will increase pumping power, which is detrimental to system efficiency. Through optimized design and reasonable parameter adjustment, the performance and stability of vanadium flow batteries in large-scale energy storage applications can be significantly improved.
Keywords
INTRODUCTION
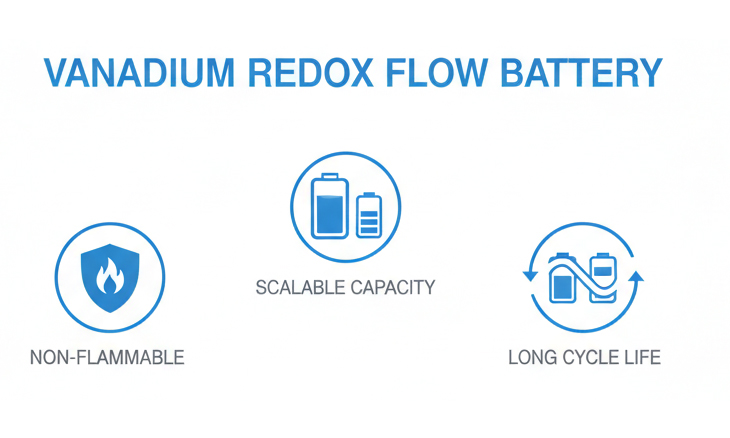
As global energy demand continues to grow, the development of renewable energy storage technology has become a key issue to address the challenges of climate change and reduce carbon emissions. Renewable energy sources, such as wind and solar energy, require stable energy storage systems owing to their intermittent nature[1,2]. Vanadium redox flow battery (VRFB) has gradually attracted attention owing to its unique performance advantages and has become an important choice for future large-scale energy storage systems[3,4]. VRFB is a flow battery that uses vanadium ions as the electrolyte. The VRFB system consists of two liquid storage tanks and a set of battery stacks. The vanadium electrolyte in the liquid storage tanks circulates within the battery stack to perform charge and discharge reactions. The charge and discharge capacities of VRFBs depend entirely on the electrolyte volume. The battery capacity is no longer limited by the structure of the single cell. This design makes the system highly flexible. VRFBs are suitable for renewable energy power storage and grid regulation[5-7]. The electrolyte used in the VRFB system consists of an aqueous sulfuric acid solution and vanadium ions. Since this electrolyte is non-flammable, it is safer than traditional lithium batteries and greatly reduces the risk of battery explosion and fire[8]. In addition, the electrochemical reactions of VRFBs do not damage the electrode materials, so they can perform tens of thousands of charge and discharge cycles, highlighting the excellent long-life characteristics of VRFBs. Although VRFBs have many excellent characteristics, they still face some challenges. The cross-penetration of vanadium ions through the proton exchange membrane will reduce the charge and discharge capacity[9] and affect the stable operation of the system.
Experimental studies provide important practical data for understanding the performance of VRFBs and can analyze the mechanisms by which batteries are affected by operating conditions. Many experimental studies focused on the impact of electrolyte flow, temperature, and current density on battery performance. The results of Xiong et al.[10] showed that increasing the electrolyte flow rate improved battery charging and discharging. Capacity is more uniform as the electrolyte in the battery benefits from high electrolyte flow. Tang et al.[11] found that as the temperature increases, the battery voltage decreases. The reason is that the improvement of electrode power reduces the electrochemical activation overpotential, showing that low temperature will have a negative impact on battery performance. In addition, although high current density can increase power output at the same time, it will lead to a decrease in capacity and efficiency. Especially in long-term charge-and-discharge cycles, it is necessary to strike the best balance between power demand and stability[12-15]. In addition to operating conditions, the structural design of the battery is also crucial to battery performance. Yoon et al.[16] concluded that optimizing electrode porosity can improve the mass transfer efficiency of the electrolyte. High-porosity carbon felt provides a larger active area in the high reactant concentration area, thereby improving battery efficiency. The phenomenon of electrolyte cross-penetration has long been a challenge in VRFB research, because the imbalance of the electrolyte will lead to capacity fading[17]. Focusing on the dynamic behavior of the electrolyte and its impact on performance, Zou et al.[18] found that assuming the electrolyte composition remains unchanged, normal long-term VRFB operation will cause the positive electrode electrolyte volume to gradually increase, while the opposite is true for the negative electrode. This is closely related to the diffusion of water molecules[19,20]. In order to reduce the capacity attenuation caused by cross-penetration, researchers have developed new membrane technologies such as polyaniline-coated membrane materials. This kind of membrane can not only effectively reduce cross-penetration between different ions, but also maintain conductivity and stability. It provides a new idea to reduce battery capacity fading[17]. Lemmermann et al.[21] used redox-potential probes within membranes during charge and discharge of a flow battery to monitor vanadium mass transfer. They found that the electrical potential gradient affects the location of reaction zones in the membrane. Huang et al.[22] focused on efficiency enhancement techniques of VRFB. They concluded that energy and system efficiency increase by about 9.07% and 8.34%, respectively, when using variable-flow-rate and current-density charge/discharge techniques. Kim and Park[23] conducted an experimental study on the discharge characteristics in VRFB. They observed that the electron transfer coefficient increased in the range of 0.31 to 0.51 by increasing the temperature and flow rate.
As an effective tool for studying VRFBs, two-dimensional numerical model analysis has shown many advantages in exploring battery structural design, operating conditions, and mass-transfer behavior. Compared with actual VRFB experiments[23], more operating conditions can be investigated simultaneously, time and cost can be reduced, and potential experimental risks can be avoided by using two-dimensional numerical model analysis. In the numerical study of VRFB flow channels, Zhang et al.[24] compared the performance of interdigitated and serpentine flow channels in VRFBs. The results showed that the serpentine flow channel increases the uniformity of electrolyte distribution. However, the interdigitated flow channel achieves higher electrochemical reaction efficiency and is suitable for application scenarios with high performance requirements. In the optimization design of electrodes, Tsushima et al.[25] believe that parameters such as electrode thickness and porosity are crucial in optimizing VRFBs. Chen et al.[26] studied electrode porosity in the range of 0.8 to 0.85. The results show that the porosity will affect the electrolyte concentration distribution and concentration overpotential, thereby affecting the battery reaction. As porosity increases, battery capacity increases while system efficiency decreases, so a balance point is required. In addition, the researchers found that an optimal electrode thickness yields maximum battery capacity and highest energy efficiency. Knehr et al.[27] simulated the VRFB operation for 100 h and subsequently found that the battery discharge time after 100 h of operation was 16.9% less than predicted, from 72.6 min to 60.3 min. At the same time, it was found that the battery’s capacity loss was not closely related to battery efficiency. It was concluded that the capacity loss was due to the leakage of vanadium ions. In simulations of operating parameters such as concentration, current density, temperature, and electrolyte flow rate, Yang et al.[28] found that increasing the electrolyte flow rate can improve battery voltage. For i = 80 mA cm-2, although the power output per unit time can be increased, it will cause local overheating at the electrolyte outlet and affect the stability of the battery.
Compared with the 2D numerical model, the 3D numerical model can more accurately describe the complex physical field behavior of VRFBs. A 3D numerical model offers significant advantages in observing the details and the distribution of physical quantities; especially, it has higher accuracy in studying flow field design, mass transfer, and temperature distribution. Huang et al.[29] studied the energy efficiency, voltage, and temperature distribution of different flow fields for VRFBs. The results showed that the new trapezoidal cross-section serpentine flow field design can significantly improve the distribution of electrolyte and improve electrolyte utilization. Wu et al.[30] added baffles to the serpentine flow channel and observed the transmission of electrolyte in the flow channel. Their study showed that the addition of baffles effectively improved the transmission of vanadium ions and improved mass transfer. In addition, they compared the operating voltages at Q = 100 and 300 mL min-1, and found that the charge and discharge time became longer and the energy efficiency increased slightly as the flow rate increased. Yang et al.[31] studied the dynamic behavior of electrolyte flow on the transmission of vanadium ions. The results showed that at i > 150 mL min-1, the voltage and Coulombic efficiency have little effect on the flow rate. Regarding the study of cross-contamination of vanadium ions, Won et al.[32] simulated the impact of fresh membranes and degraded membranes on cross-contamination. The results revealed that fresh membranes are more effective in preventing cross-contamination than degraded membranes, and are harmful to batteries. Benefiting from the spatially accurate data of the 3D simulation, the researchers found that the concentration of vanadium ions in the negative electrode increased and the concentration of vanadium ions in the positive electrode decreased during the charging process, while the opposite trend occurred during the discharge process. Finally, Ali et al.[33] studied the effects of electrode thickness and porosity and found that increasing the electrode porosity can improve battery performance. As electrode thickness increases, vanadium concentration uniformity improves significantly, but the uniformity gradually decreases beyond 3 mm. The decrease in electrode thickness increases the voltage drop and requires higher pumping power to provide the required driving force. Kim et al.[34] focused on the composite membranes for proton exchange membranes in fuel cells. They concluded that the SPAEPP/N-C-SO3H/COOH composite membrane shows high power density and stability for this type of fuel cell. The selection of substrate materials for the flow channel is important to maintain electrochemical stability and efficient thermal management. The unique advantages of silicon-based flow channels, especially their good thermal conductivity and ability to fabricate high-aspect-ratio features with sub-micron precision, make them suitable for use in batteries. Using silicon materials, as established in recent thermal management research, allows for more compact and thermally stable battery architecture, potentially mitigating the localized temperature fluctuations, which often limit large-scale flow battery performance.
3D transient numerical model analysis has shown irreplaceable advantages in the research of VRFBs. It can comprehensively describe the dynamic behavior of the flow field, mass transfer, and temperature distribution, especially during the cross-penetration phenomenon. It can more accurately analyze the charge and discharge capacity, Coulombic, voltage, and energy efficiencies of the battery. This study conducts simulation analysis on different flow channel designs, including parallel flow channels (PFCs), interdigitated flow channels (IFCs), and serpentine flow channels (SFCs). 3D numerical analysis and simulation were performed through COMSOL Multiphysics® 6.0 to analyze the pressure distribution of various flow channel designs and their impact on battery performance under different current densities and different electrolyte flow rates. The results of this study can help to improve the efficiency of VRFBs and make VRFBs more valuable.
NUMERICAL ANALYSIS
Model building approach
As shown in Figure 1, the VRFB single cell consists of a peristaltic pump, graphite carbon felt, proton exchange membrane, current collector, and electrolyte storage tank. Both graphite carbon felts will undergo oxidation and reduction reactions during the charge and discharge processes. The positive electrode side is composed of
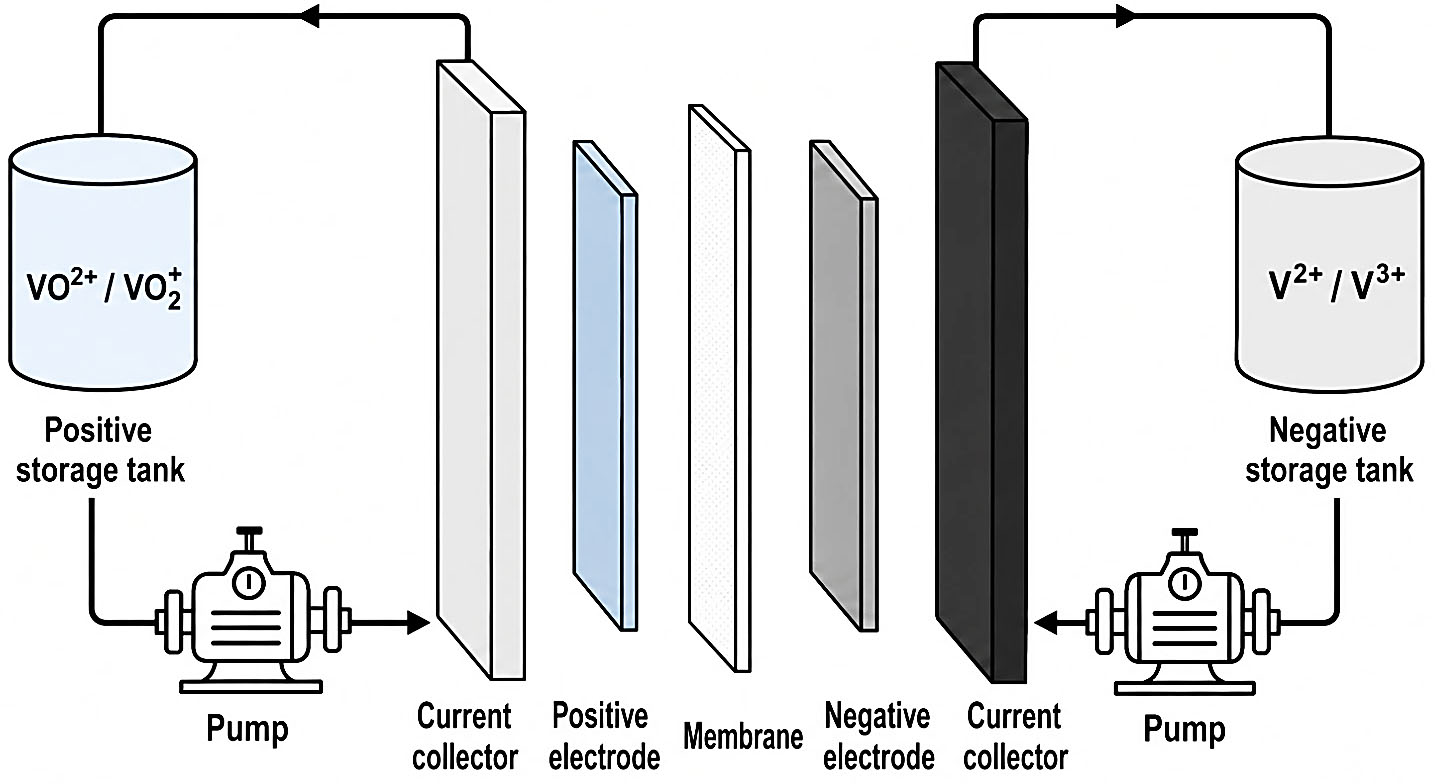
Figure 1. Schematic diagram of VRFB. VRFB: Vanadium redox flow battery.
Positive electrode:
Negative electrode:
During the charging process, the negative electrode V3+ will be reduced to V2+, and the positive electrode VO2+ will be oxidized to
Positive electrode:
Negative electrode:
To conduct numerical simulation of VRFBs, this study established 3D single-cell models of four flow channels. The 3D model mainly consists of graphite carbon felt, current collector, and proton exchange membrane. Figure 2 shows the structure diagram of the 3D VRFB model, and the dimensions of the 3D VRFB are provided in Table 1.
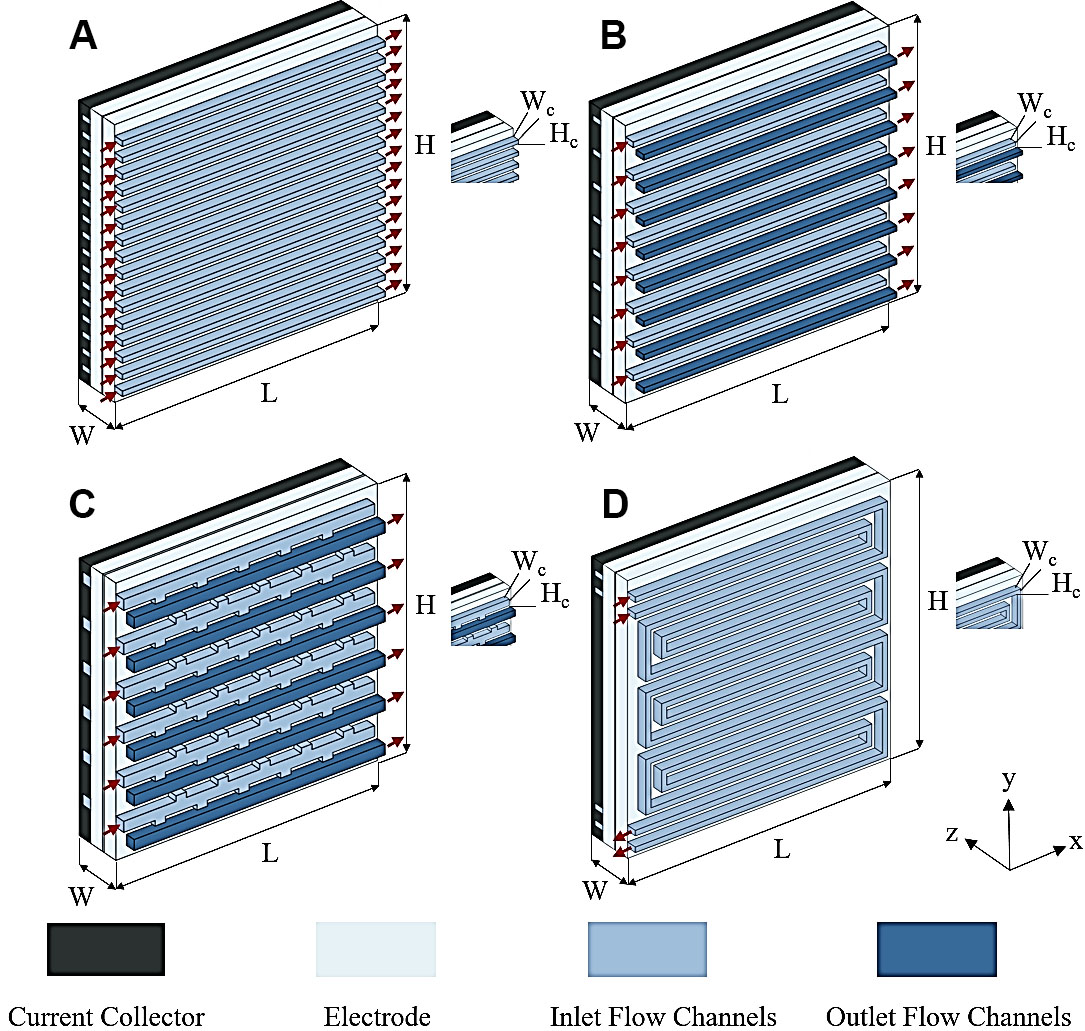
Figure 2. VRFB model structure diagram, (A) PFC; (B) IFC; (C) IFC with pins (D) SFC. VRFB: Vanadium redox flow battery; PFC: parallel flow channel; IFC: interdigitated flow channel; SFC: serpentine flow channel.
Dimensions of VRFB geometry
| Symbols | Descriptions | Value (mm) |
| W | Cell width | 12.2 |
| H | Cell height | 50 |
| L | Cell length | 50 |
| tcc | Current collector thickness | 3 |
| tm | Membrane thickness | 0.2 |
| te | Electrode thickness | 3 |
| Wc (Parallel flow channel) | Width | 2 |
| Hc (Parallel flow channel) | Height | 1 |
| Wc (Interdigitated flow channel) | Width | 2 |
| Hc (Interdigitated flow channel) | Height | 1 |
| Wc (Interdigitated flow channel with pins) | Width | 2 |
| Hc (Interdigitated flow channel with pins) | Height | 2 |
| Wc (Serpentine flow channel) | Width | 2 |
| Hc (Serpentine flow channel) | Height | 1 |
Assumptions
• Battery temperature is isothermal during the simulation and is not affected by time.
• Porous electrodes and membranes are isotropic in all directions (Isotropic).
• The side reactions of hydrogen and oxygen evolution and absorption are ignored.
• The flow of electrolyte is incompressible and laminar, and the electrolyte is regarded as a dilute solution.
Governing equations
Flow of electrolyte in the flow channel
In VRFBs, the flow of electrolyte in the flow channel is an important issue for battery performance. This study uses the Navier-Stokes equations to describe fluid motion[35]. The electrolyte has incompressible and laminar flow characteristics, whose governing equations are as follows:
where ρ is the average density of the electrolyte fluid (vanadium substance, water, and sulfuric acid),
Flow of electrolyte in porous electrodes
When the electrolyte enters the carbon felt area of the VRFB, the porous media characteristics of the carbon felt electrode will affect the fluid flow. For example, the fluid needs to overcome the resistance of the pore structure and the impact of the permeability of the porous media. By combining the characteristics of the Navier-Stokes equation and the Darcy equation[36], the Brinkman equation[24] accounts for the effects of porous media on the fluid and more accurately describes the flow behavior of the electrolyte in the carbon felt. This equation is:
where ρ is the average density of the electrolyte fluid (vanadium substance, water, and sulfuric acid),
Mass and charge transport of electrolyte
The performance of VRFBs is affected by ion concentration and electric field strength. In order to accurately describe the transport behavior of ions in the electrolyte and porous electrodes, the Nernst-Planck equation[37] is applied:
where ci and zi are the volume concentration and charge number of the vanadium substance i, respectively, ui is the ion mobility, F is the Faraday constant, Φl is the electrolyte potential,
Assuming that the electrolyte is electrically neutral, we have:
The ion concentration in a VRFB changes with time and space. The species concentration conservation equation also takes into account the effects of diffusion, convection, and electrochemical reactions on concentration changes:
where
where
Electrochemical reaction between electrolyte and porous electrode
The electrochemical reaction of porous electrodes in the charge conservation principle is calculated by Butler-Volmer[40], and its transfer current density for the negative electrode is:
For the positive electrode:
where k and a represent the reaction rate constant of the porous electrode and the specific surface area of the electrode, respectively, αa and αc represent the charge transfer coefficient of the redox reaction of the anode and the cathode, respectively, and
where Φs and Φi are the potentials of the solid and liquid states, respectively, E1 and E2 are the equilibrium potentials of the negative reaction and the positive reaction, respectively, calculated by the Nernst equation[41]:
where
Values of parameters related to mass and charge transport
| Symbols | Descriptions | Value |
| DII | Diffusion coefficient (DF) for V2+ | 2.4 × 10⁻¹⁰ m2s-1 |
| DIII | DF for V3+ | 2.4 × 10⁻¹⁰ m2s-1 |
| DIV | DF for VO2+ | 3.9 × 10⁻¹⁰ m2s-1 |
| DV | DF for | 3.9 × 10⁻¹⁰ m2s-1 |
| DF for H+ | 9.312 × 10⁻⁹ m2s-1 | |
| DF for | 1.33 × 10⁻⁹ m2s-1 | |
| DF for | 1.06 × 10⁻⁹ m2s-1 | |
| β | 0.25 | |
| μneg | Viscosity | 2.5 × 10⁻³ Pa s |
| μpos | Viscosity | 5 × 10⁻³ Pa s |
| ρneg | Density | 1.3 × 10³ kg m-3 |
| ρpos | Density | 1.35 × 10³ kg m-3 |
Electrochemical related parameters
| Symbols | Descriptions | Value |
| k+ | Standard reaction rate constant: positive | 8.84 × 10⁻⁷ m s-1 |
| k- | Standard reaction rate constant: negative | 2.21 × 10⁻⁷ m s-1 |
| a +, a- | Cathodic/Anodic transfer coefficient: reaction | 0.55, 0.45 |
| Equilibrium potential: V2+/V3+ | -0.255 V | |
| Equilibrium potential: VO2+/ | 1.004 V | |
| cf | Fixed charge site (sulfonate) concentration | 1,200 mol m-3 |
| zf | Charge of fixed (sulfonate) sites | -1 |
| Initial negative concentration | 1,500 mol m-3 | |
| Initial positive concentration | 1,500 mol m-3 | |
| Initial | 4,500 mol m-3 | |
| Initial H+ concentration | 6,000 mol m-3 | |
| σs | Electronic conductivity of electrode | 6.5 × 10² S m-1 |
| σc | Electronic conductivity of current collector | 1 × 10³ S m-1 |
| pout | Electrode outlet pressure | 0 Pa |
| ε | Electrode porosity | 0.93 |
| V tank | Electrolyte volume in tank | 25 mL |
Material transport and electrochemical reaction of electrolyte in proton exchange membrane
The main activity of the proton exchange membrane is to separate the electrolyte to avoid cross-contamination. The current density of the proton exchange membrane is[42]:
In the proton exchange membrane, the principle of electrical neutrality is also followed. The proton exchange membrane has a fixed charge density ρfix, which gives the proton exchange membrane high selectivity and is the key to allowing protons to pass:
Boundary conditions
The volume flow rate Qpump driven by the peristaltic pump controls the electrolyte flow rate vin into the cell inlet:
where A is the cross-sectional area. It is assumed that the inlet flow is a fully developed flow:
The electrolyte flows out of the battery, flows into the electrolyzer, and flows back to the battery from the inlet side of the battery through a peristaltic pump. The inlet concentrations
where ci,int is the initial concentration of vanadium substance, V is the volume of electrolyte,
Since VRFBs usually operate in constant current mode, constant current conditions are applied to the sidewalls of the current collector[42]:
where I is the current, and the opposite is true for the discharge state. The other outer surfaces of the current collector are insulated and the surface potential outside the negative electrode is zero.
Initial conditions
During the transient numerical simulation, a steady-state simulation will be performed first, and the result will be used as the initial value of the transient simulation. During discharge, the SOC starts to discharge from 0.9, and during the charging process, the SOC starts to charge from 0.1.
Model validation
In order to benchmark the accuracy of the 3D VRFB model established in this study, a 3D VRFB model with SFC was used and compared with the research results of Ali et al.[43]. Figure 3 shows the numerical results of this study and the trend diagram of battery voltage during the charging and discharging states studied by Ali et al.[43]. For the discharging state through numerical simulation, the battery voltage decreases as time increases. From the SOC state, the voltage at SOC = 0.9 is 1.4093 V, which drops to 1.225 V at SOC 0.11. The experimental results are consistent with the trend of the numerical results. Therefore, the numerical simulation of the 3D model of VRFB in this study has high accuracy for studying the effects of other factors on the performance of VRFB. To quantitatively support the model accuracy, the maximum relative deviation between the numerical simulation and experimental data was calculated. The results show that the maximum relative deviation is less than 1.7% (at the end of the discharge cycle), which confirms the high fidelity of the proposed model.
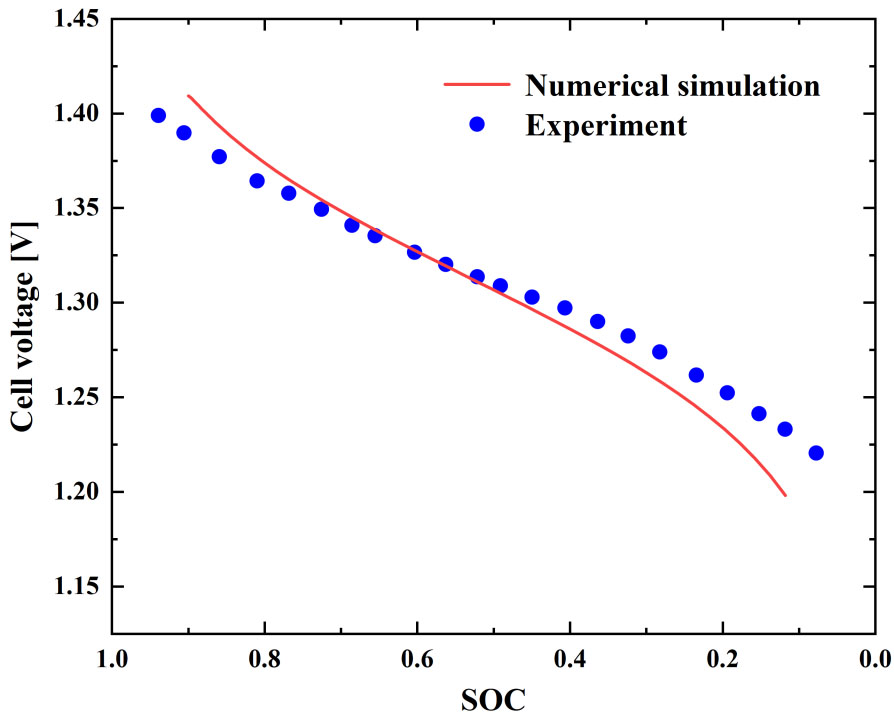
Figure 3. Comparison between the numerical and experimental results. SOC: State of charge.
Grid independence test
The grid structure of VRFB is composed of a tetrahedral grid. In the grid independence study, the 3D VRFB model with the SFC was used as the benchmark, and the current density of I = 60 mA cm-2 and electrolyte flow rate of Q = 60 mL min-1. The grid numbers are varied from 55,396 to 1,661,709. Among them, the grid number of 1,661,709 is used as a benchmark to calculate the relative errors of other grid numbers and to analyze the time it takes for the VRFB to discharge from SOC when the SOC is 0.9 and the voltage is 1.15 V. The results of this study are presented in Table 4. It can be seen that the error of the grid number of 783,097 is only 1.8258% compared with the grid number of 1,661,709, but the calculation time is greatly reduced, so the grid number of 783,097 is the most cost-effective.
Grid independence test
| Grid Number | Time to discharge to 1.15 V (s) | Relative error (%) | CPU time |
| 55,396 | 842.20 | 41.9337 | 3 min |
| 117,615 | 1,033.56 | 28.7403 | 9 min |
| 237,866 | 1,299.48 | 10.4059 | 18 min |
| 441,461 | 1358.80 | 6.3163 | 58 min |
| 783,097 | 1,423.93 | 1.8258 | 3 h 23 min |
| 1,118,007 | 1,426.86 | 1.6241 | 10 h 30 min |
| 1,661,709 | 1,450.41 | 0 | 18 h 18 min |
RESULTS AND DISCUSSION
Battery pressure distribution
This study simulated the pressure distribution of VRFBs with four flow channel structures at the same electrolyte flow rate of 60 mL min-1. The result is shown in Figure 4. Since the outlet pressure is zero, the pressure drop in the flow channel can be calculated from the average pressure at the inlet. The pressure drops of the four types of flow channels in descending order are 5,023.4 Pa, 332.75 Pa, 203.07 Pa, and 135.79 Pa for SFC, IFC, IFC with pins, and PFC, respectively. Larger flow channel pressure drops affect the pump and create more burdens. Among them, the flows of the PFC are straight lines without any obstructions, so they have the smoothest and most uniform pressure distribution. In order to add a convex part to the IFC, taking structural design and other factors into consideration, the number of IFCs with pins was reduced, and the inlet area of the flow channel was increased. The convex part provides greater fluid resistance compared to the IFC. This design helps to improve the mixing effect of the electrolyte and fluid distribution in the flow channel. Although overcoming the fluid resistance will cause the pressure drop to increase, due to the interdigitated inlet, the cross-sectional area is smaller than that of the IFC with pins, so the pressure at the entrance of the finger-shaped flow channel is greater than that of the IFC with pins. Finally, because the SFC has only two inlets, the flow channel has many turns, and the length of the flow channel is much longer than the other three flow channels. As a result, the SFC has the largest pressure range distribution.
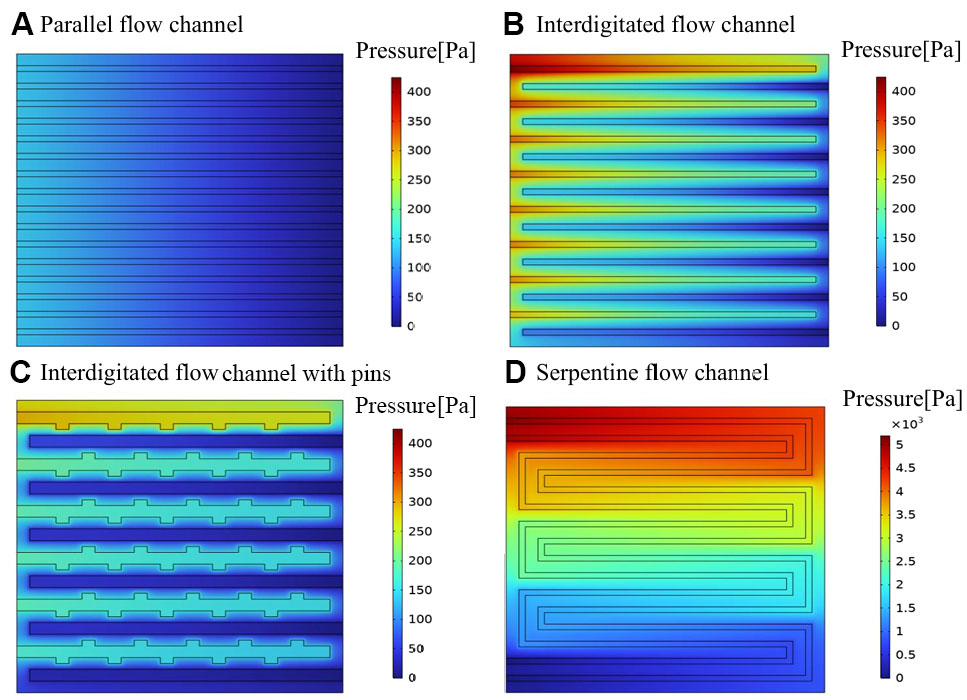
Figure 4. VRFB pressure distribution diagram. VRFB: Vanadium redox flow battery.
Charge and discharge performance of VRFB
This study simulated the influence of flow channel geometry on battery charge and discharge processes when the current density of four flow channels was 60, 80, and 100 mA cm-2, respectively, and for a charging cut-off voltage of 1.55 V and a discharge cut-off voltage of 1.15 V. The results are shown in Figures 5 and 6. In Figure 5, the charge and discharge time of all flow channels shortens as the current density increases, and increases as the current density decreases. In addition, the figure shows that the charge and discharge curves of the IFC, IFC with pins, and SFCs have hyperbolic characteristics. The charge-discharge curve of the PFC is a curve, and the slope of the flow channel at the beginning of charging and discharging is small. Because the design of the PFC will make the electrolyte in the flow channel evenly distributed, the initial concentration gradient of vanadium ions is established slowly, so the initial concentration polarization effect is not obvious. However, after entering the middle stage of charging and discharging, the electrolyte still flows along the flow channel and lacks a mechanism to force it to flow into the electrode surface. The electrolyte cannot fully participate in the reaction and cannot effectively increase the electrochemical reaction rate, resulting in the electrolyte in the PFC having low utilization efficiency. In Figure 6, the charge and discharge capacities of all flow channels decrease as the current density increases and increase as the current density decreases. The distance between the different current density curves of the IFC and SFC is small, while the distance between the different current density curves of the PFC and the IFC with pins is larger, which means that when the current density increases, the charge and discharge capacity loss rates for IFC and SFC are smaller than those of the PFC and the IFC with pins.
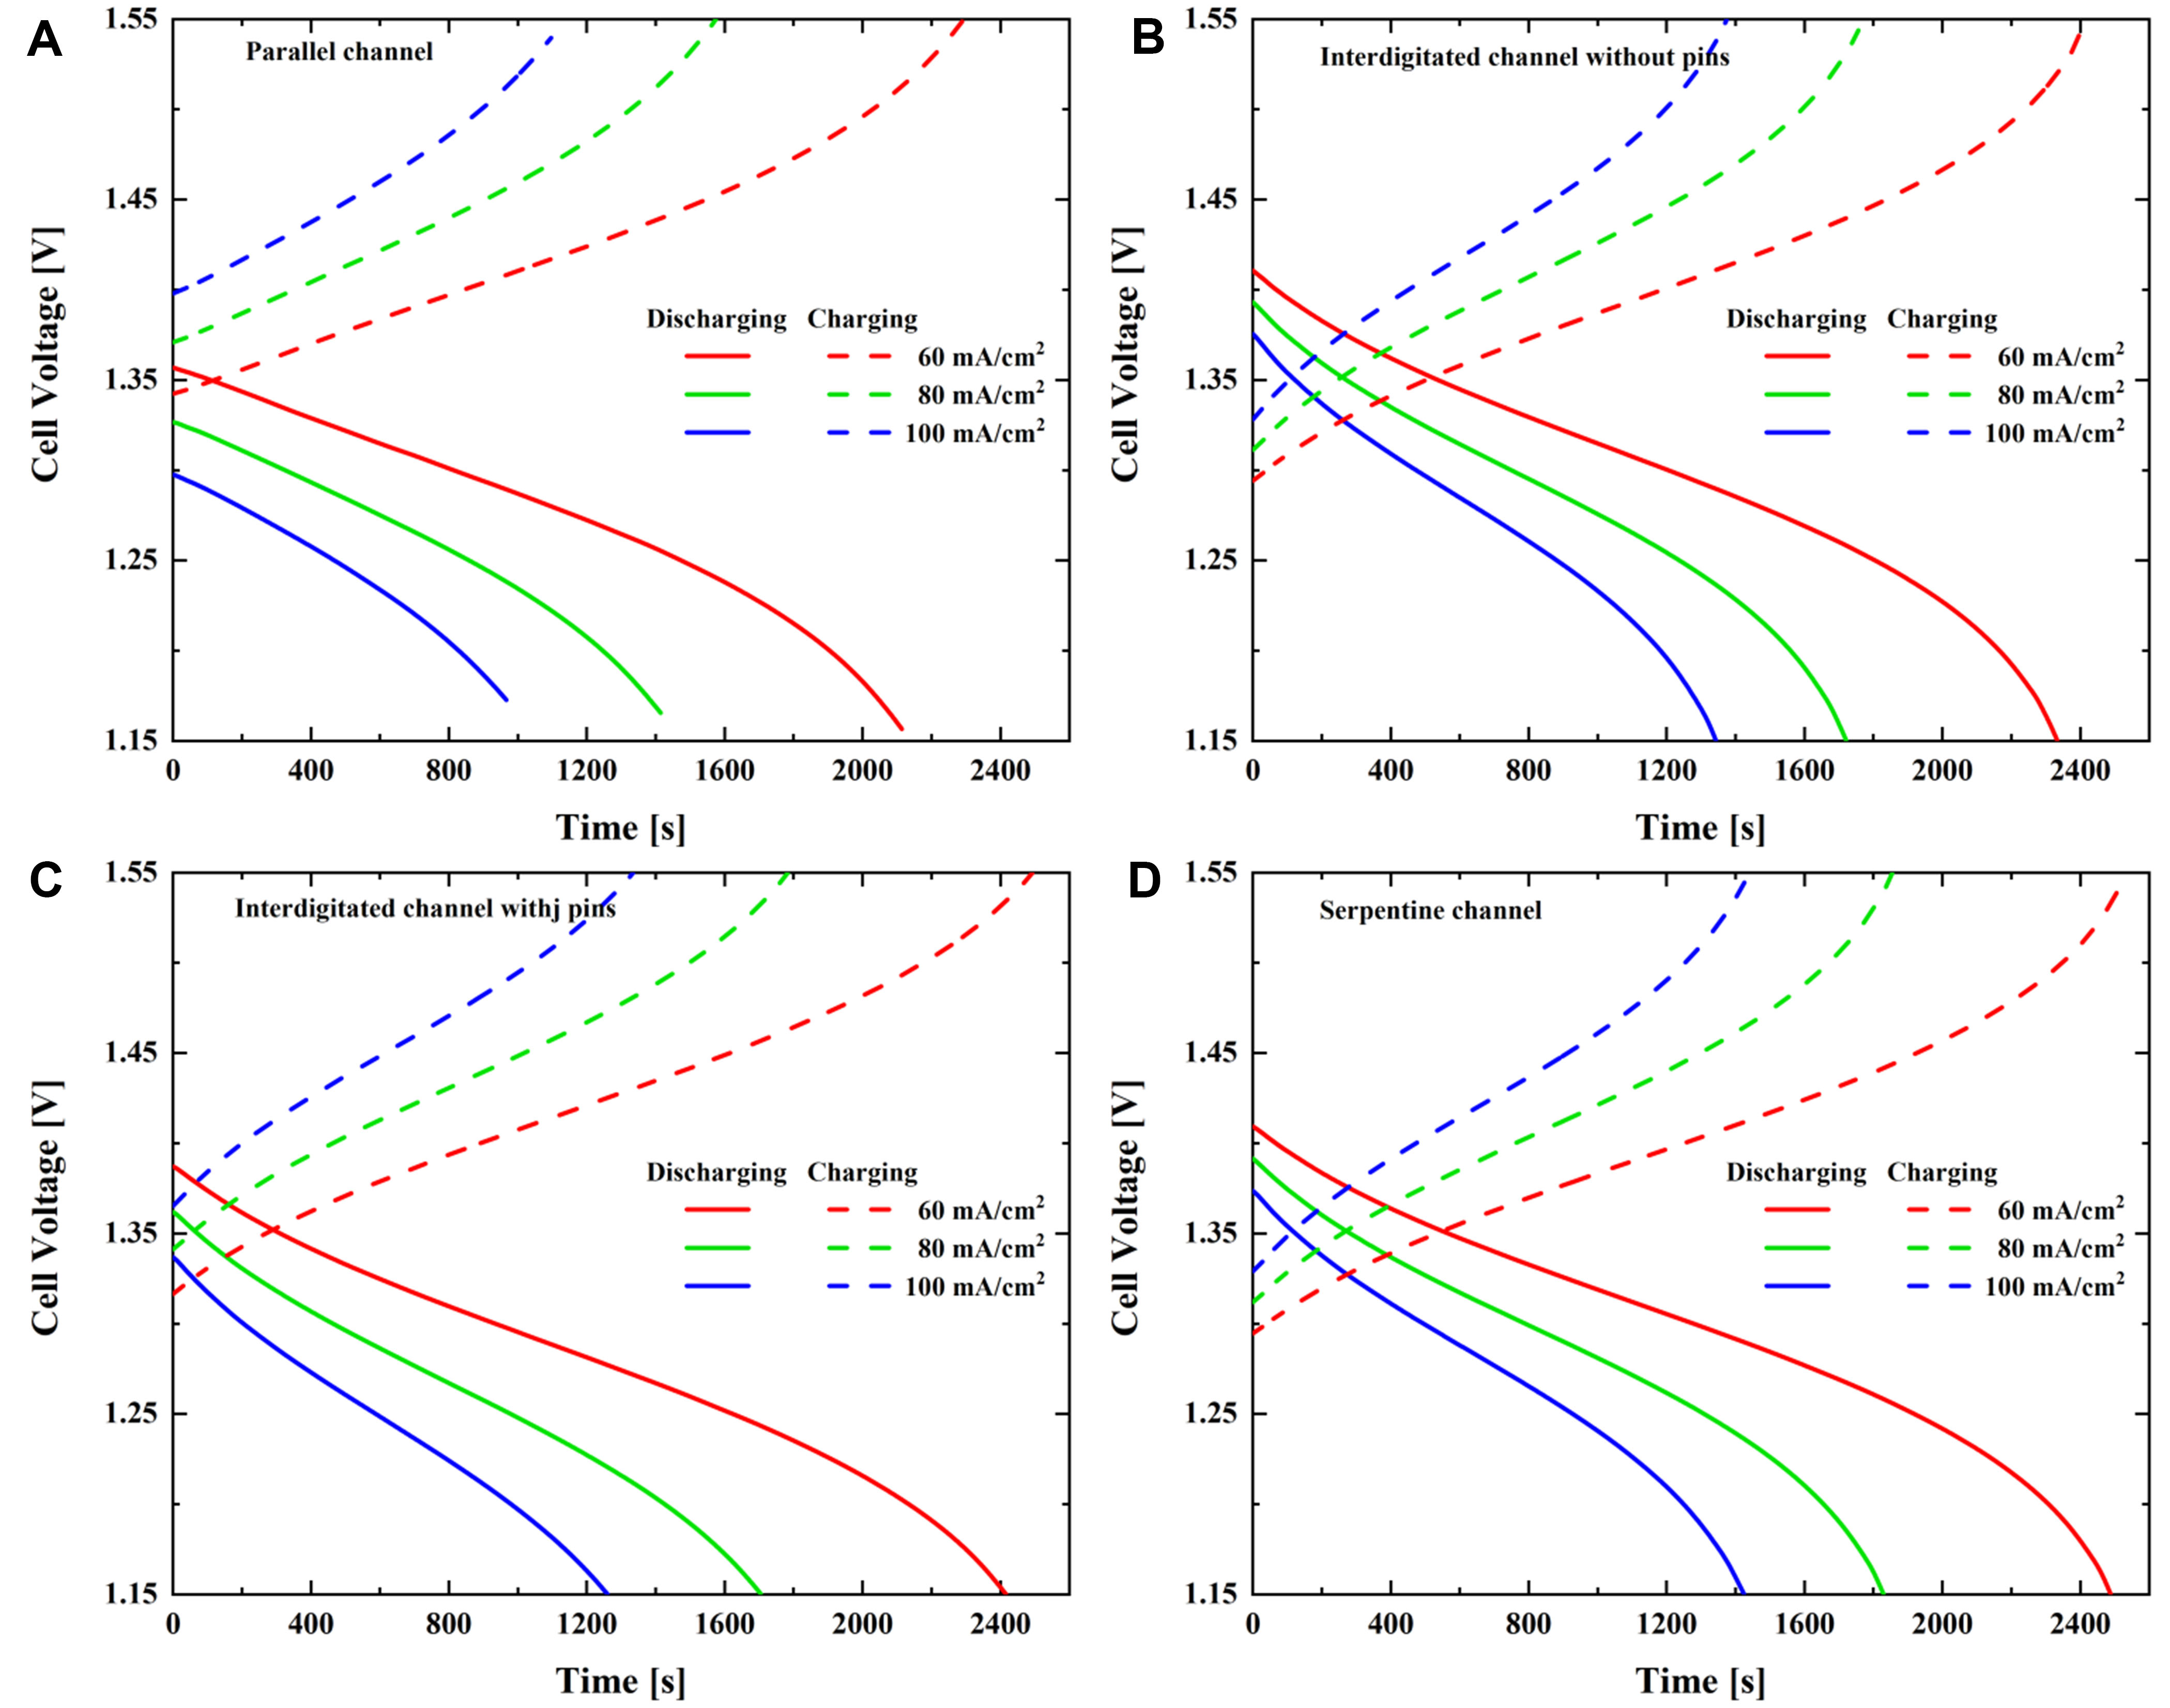
Figure 5. Variations of voltage of VRFB with time for four flow channels. (A) Parallel channel; (B) Interdigitated channel without pins; (C) Interdigitated channel with pins; (D) Serpentine channel. VRFB: Vanadium redox flow battery.
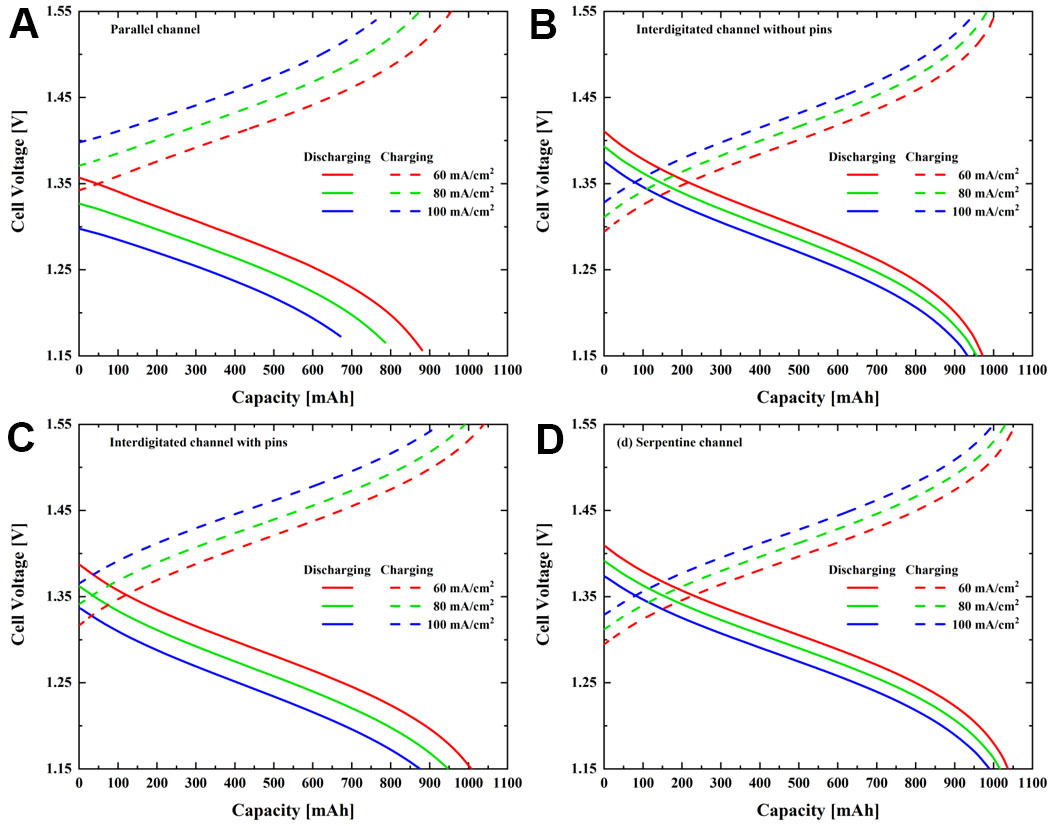
Figure 6. Variations of voltage of VRFB with capacity for four flow channels. (A) Parallel channel; (B) Interdigitated channel without pins; (C) Interdigitated channel with pins; (D) Serpentine channel. VRFB: Vanadium redox flow battery.
To better analyze the effect brought by the flow channel geometry, the data are obtained at i = 80 mA cm-2, and these data are shown in Figure 7. At i = 80 mA cm-2, the SFC has the longest discharge time of 1,820.23 s, followed by 1,721.56 s for the IFC, 1,705.75 s for the IFC with pins, and 1,414.2 s for the PFC. Among them, it can be found from Figure 7A that the PFC completes the discharge reaction before reaching the cut-off voltage of 1.15 V. Because the PFC does not have the forced diffusion characteristics of the IFC and the IFC with pins, the channel length is also much shorter than that of the SFC, which causes the electrolyte in the PFC to flow through the electrode quickly and cannot fully carry out a sufficient reaction to convert chemical energy into electrical energy, resulting in the ions in the electrolyte not being fully utilized and immediately flowing out of the battery. For the next cycle, this design will result in poor electrolyte utilization and faster voltage drop.
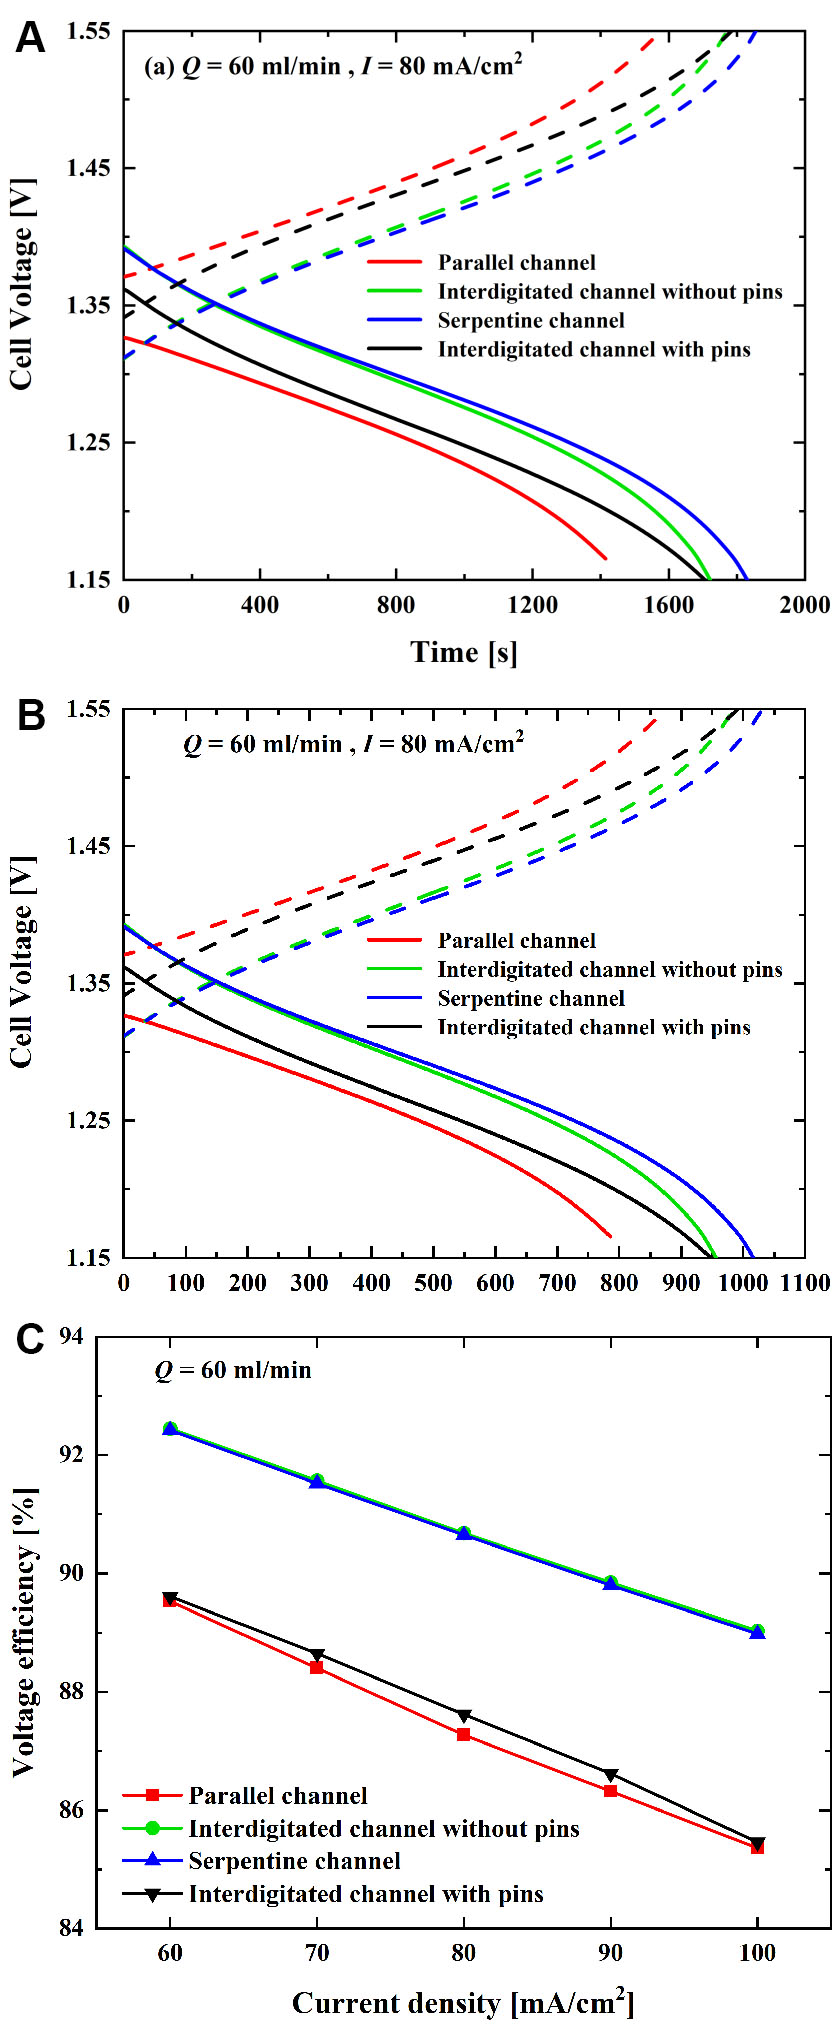
Figure 7. Comparison of VRFBs with four flow channels: (A) Voltage-time graph; (B) Voltage-capacity graph; (C) Voltage-efficiency graph. VRFB: Vanadium redox flow battery.
The charge and discharge capacity is obtained by multiplying the battery charge and discharge time, current density, and battery reaction area. At i = 80 mA cm-2, the SFC has the largest discharge capacity of 1,016.79 mAh, followed by 956.42 mAh for IFC, 947.64 mAh for the IFC with pins, and 671.22 mAh for the PFC. Figure 7B and C show that although the voltage efficiency of the SFC is 90.65%, slightly lower than the 90.68% of the IFC, its single charge and discharge capacities are the largest, demonstrating the SFC’s superior overall performance. The IFC and the IFC with pins have similar values in terms of capacity, but the IFC has an advantage in terms of voltage efficiency. The performance of the PFC is the worst among the four geometries.
Effects of current densities on starting voltage of battery at charging and discharging processes
Among the four flow channel geometries, the VRFB with SFC has the best performance, so it is selected for further discussion at i = 60, 70, 80, 90, and 100 mA cm-2. The effects of current density on the starting voltage of the battery during charging and discharging are investigated in this section. At i = 60, 70, 80, 90 and 100 mA cm-2, the corresponding discharge starting voltages are 1.409 V, 1.4 V, 1.392 V, 1.383 V, and 1.374 V respectively; the charging starting voltages are also 1.295 V, 1.303 V, 1.312 V, 1.321 V, and 1.329 V, respectively. Figure 8A shows that during the charging and discharging processes, a higher current density has a lower discharge starting voltage and a higher charging starting voltage, and a lower current density has a higher discharge starting voltage and a lower charging starting voltage. The starting voltage will affect the time from the battery charging and discharging voltage to the cut-off voltage. The phenomenon of starting voltage is mainly affected by ohmic polarization and electrochemical active polarization. As the current density increases, the resistance of the internal materials of the battery, such as electrodes, electrolyte, and proton exchange membrane, leads to greater voltage loss. In addition, electrochemical reactions all need to overcome the activation overpotential before they can start to react. A higher current density will intensify the active polarization effect of electrochemistry, causing the battery to overcome a larger activation overpotential, resulting in lower discharge starting voltage and higher charging starting voltage.
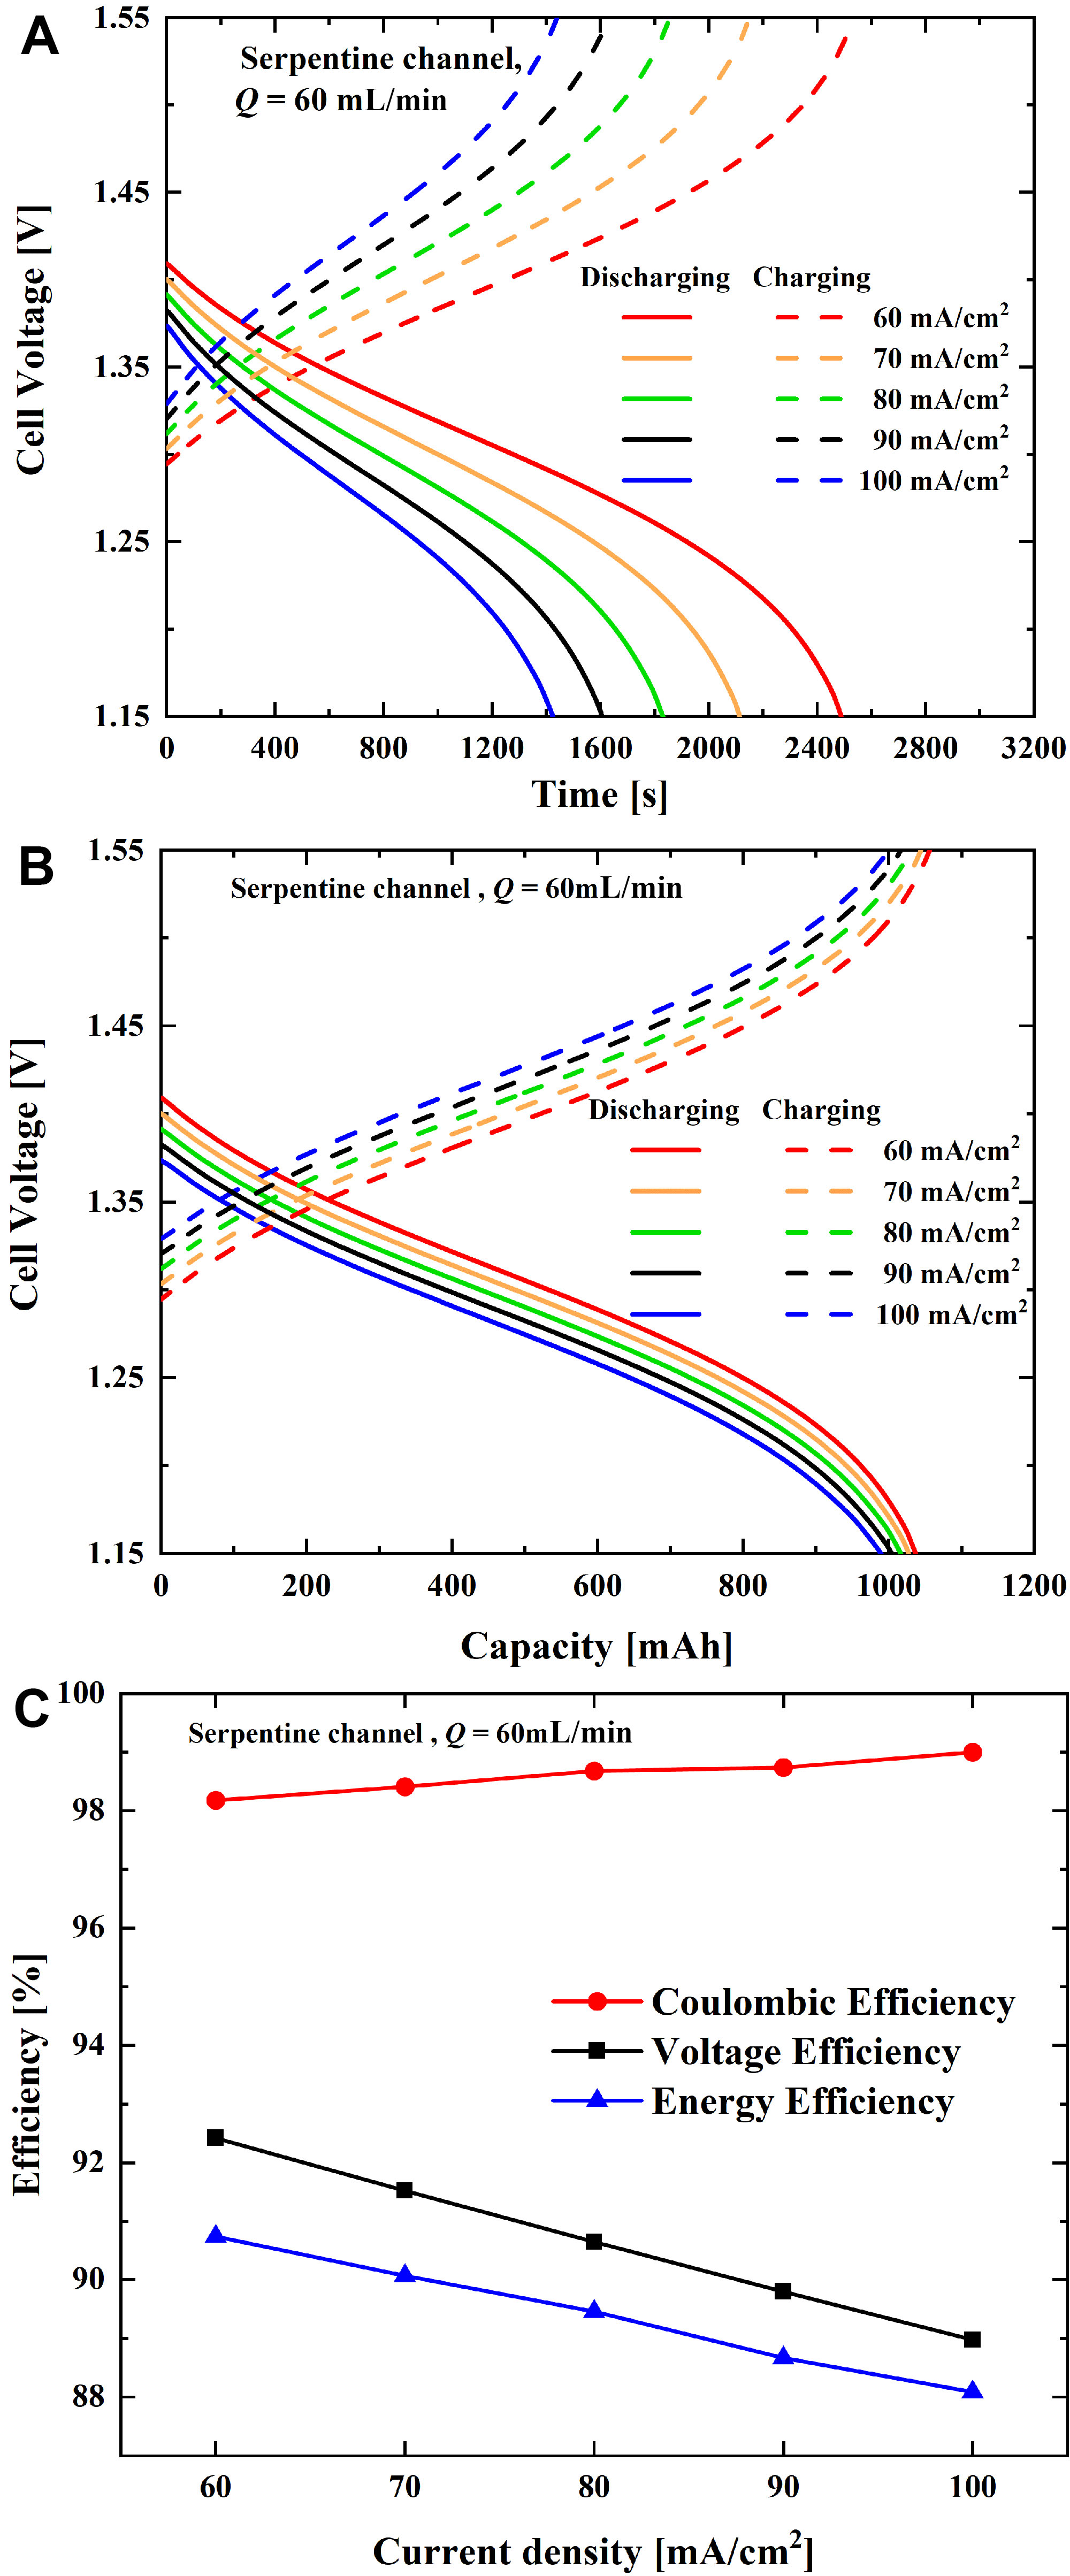
Figure 8. Comparison of current density effects of battery with SFC: (A) Voltage-time graph; (B) Voltage-capacity graph; (C) Voltage-efficiency graph. SFC: Serpentine flow channel.
Effect of current densities on battery charge and discharge capacities
The detailed charge and discharge capacity data for SFC at different current densities are provided in Table 5. In addition, Figure 8B shows that as the current density increases, the charging capacity of the battery decreases from 1,056.2 to 999.43 mAh, and the discharge capacity decreases from 1,036.98 to 989.45 mAh. Due to the lower initial discharge voltage and higher initial charge voltage caused by ohmic polarization and electrochemical active polarization, the charge and discharge processes with high current density will reach the cut-off voltage faster. This reduces the charge and discharge time, and as a result, the charge and discharge capacities are also decreased. Concentration polarization can also affect the capacity. Under high current density, the reactants near the electrode are rapidly consumed in large quantities, causing the concentration of the reactants near the electrode to decrease, and a concentration gradient appears, causing the electrochemical reaction rate to decrease. This provides the additional voltage need for battery to overcome the concentration polarization overpotential, causing the battery to reach the cut-off voltage faster, reducing the charge and discharge time, and decreasing the charge and discharge capacity.
Results under different current densities and voltage efficiencies for four flow channels
| Type of flow field | Current density (mA cm-2) | Capacity (mAh) | Energy (Wh) | Efficiencies (%) | ||||
| Charge | Discharge | Charge | Discharge | CE | EE | VE | ||
| PFC | 60 | 955.54 | 880.75 | 1.36 | 1.12 | 92.2 | 82.5 | 89.5 |
| 80 | 875 | 785.67 | 1.26 | 0.99 | 89.8 | 78.4 | 87.3 | |
| 100 | 761.87 | 671.22 | 1.11 | 0.84 | 88.1 | 75.2 | 85.4 | |
| IFC | 60 | 1,006.79 | 972.44 | 1.41 | 1.26 | 96.6 | 89.3 | 92.5 |
| 80 | 983.43 | 956.42 | 1.39 | 1.23 | 97.3 | 88.2 | 90.7 | |
| 100 | 954.77 | 933.18 | 1.37 | 1.19 | 97.7 | 87.0 | 89.0 | |
| IFC with pins | 60 | 1,038.96 | 1,007.11 | 1.48 | 1.29 | 96.9 | 86.9 | 89.6 |
| 80 | 991.11 | 947.64 | 1.43 | 1.20 | 95.6 | 83.7 | 87.5 | |
| 100 | 926.93 | 875.51 | 1.35 | 1.09 | 94.5 | 80.7 | 85.5 | |
| SFC | 60 | 1,056.2 | 1,036.98 | 1.48 | 1.35 | 98.2 | 90.7 | 92.4 |
| 80 | 1,030.36 | 1,016.79 | 1.46 | 1.31 | 98.7 | 89.5 | 90.7 | |
| 100 | 999.43 | 989.45 | 1.43 | 1.26 | 99.0 | 88.1 | 89.0 | |
Effect of different current densities on battery efficiency
Coulombic efficiency is related to the charge loss caused by battery side reactions and electrolyte cross-contamination. Energy efficiency reflects the losses in the battery energy conversion process, including voltage loss, Coulombic loss, etc. Voltage efficiency is mainly affected by ohmic polarization, concentration polarization, and electrochemically activated polarization. Coulombic efficiency (CE), energy efficiency (EE), and voltage efficiency (VE) are expressed as follows:
As shown in Figure 8C, the CE of the SFC increases with increasing current density, from 98.2% to 99%. As the current density increases, the reaction rate of the VRFB accelerates, causing the vanadium ions in the electrolyte to be consumed more quickly, thus shortening its time on both sides of the proton exchange membrane, which reduces the chance of cross-contamination of the electrolyte. VE decreases with increasing current density, from 92.4% to 89%. When the current density increases, the ohmic polarization, concentration polarization, and electrochemical active polarization inside the battery gradually increase, resulting in greater voltage loss and reduced VE. EE also decreases with increasing current density, from 90.7% to 88.1%. EE is calculated by multiplying CE and VE, showing the impact on overall cell performance. Although high current density can improve CE and reduce electrolyte cross-contamination and side reactions, the significant drop in VE shows that increasing current density brings greater voltage loss, ultimately leading to a downward trend in overall EE.
Effects of electrolyte flow rate
From Figure 9A, the effects of different electrolyte flow rates on the starting voltage of the battery in charge and discharge processes can be observed. The electrolyte flow rate was 20, 40, 60, 80, and 100 mL min-1 under charge and discharge processes. When the electrolyte flow is 20, 40, 60, 80, and 100 mL min-1, the corresponding discharge starting voltages are 1.379 V, 1.388 V, 1.392 V, 1.393 V, and 1.394 V respectively; the charging starting voltages are 1.325 V, 1.316 V, 1.312 V, 1.31 V, and 1.309 V. It can be seen from Figure 9A that at the beginning of the discharge process, the initial discharge voltage increases slightly as the electrolyte flow rate increases. When the flow rate increases from 20 mL min-1 to 100 mL min-1, the initial discharge voltage is increased from 1.379 V to nearly 1.394 V. At the beginning of the charging process, the initial charging voltage decreases as the electrolyte flow rate increases. When the flow rate increases from 20 to 100 mL min-1, the initial discharge voltage is decreased from about 1.325 V to 1.309 V. The reasons for the trend of the initial voltage caused by adjusting the flow rate are different from those caused by adjusting the current density. The trend caused by adjusting the current density is mainly affected by ohmic polarization and electrochemical active polarization, while the trend caused by adjusting the flow rate is mainly affected by concentration polarization. As the electrolyte flow rate increases, the mass transfer effect of the electrolyte near the electrode increases, which can effectively reduce the concentration gradient caused by insufficient replenishment of reactants, showing that a higher electrolyte flow rate helps to reduce concentration polarization.
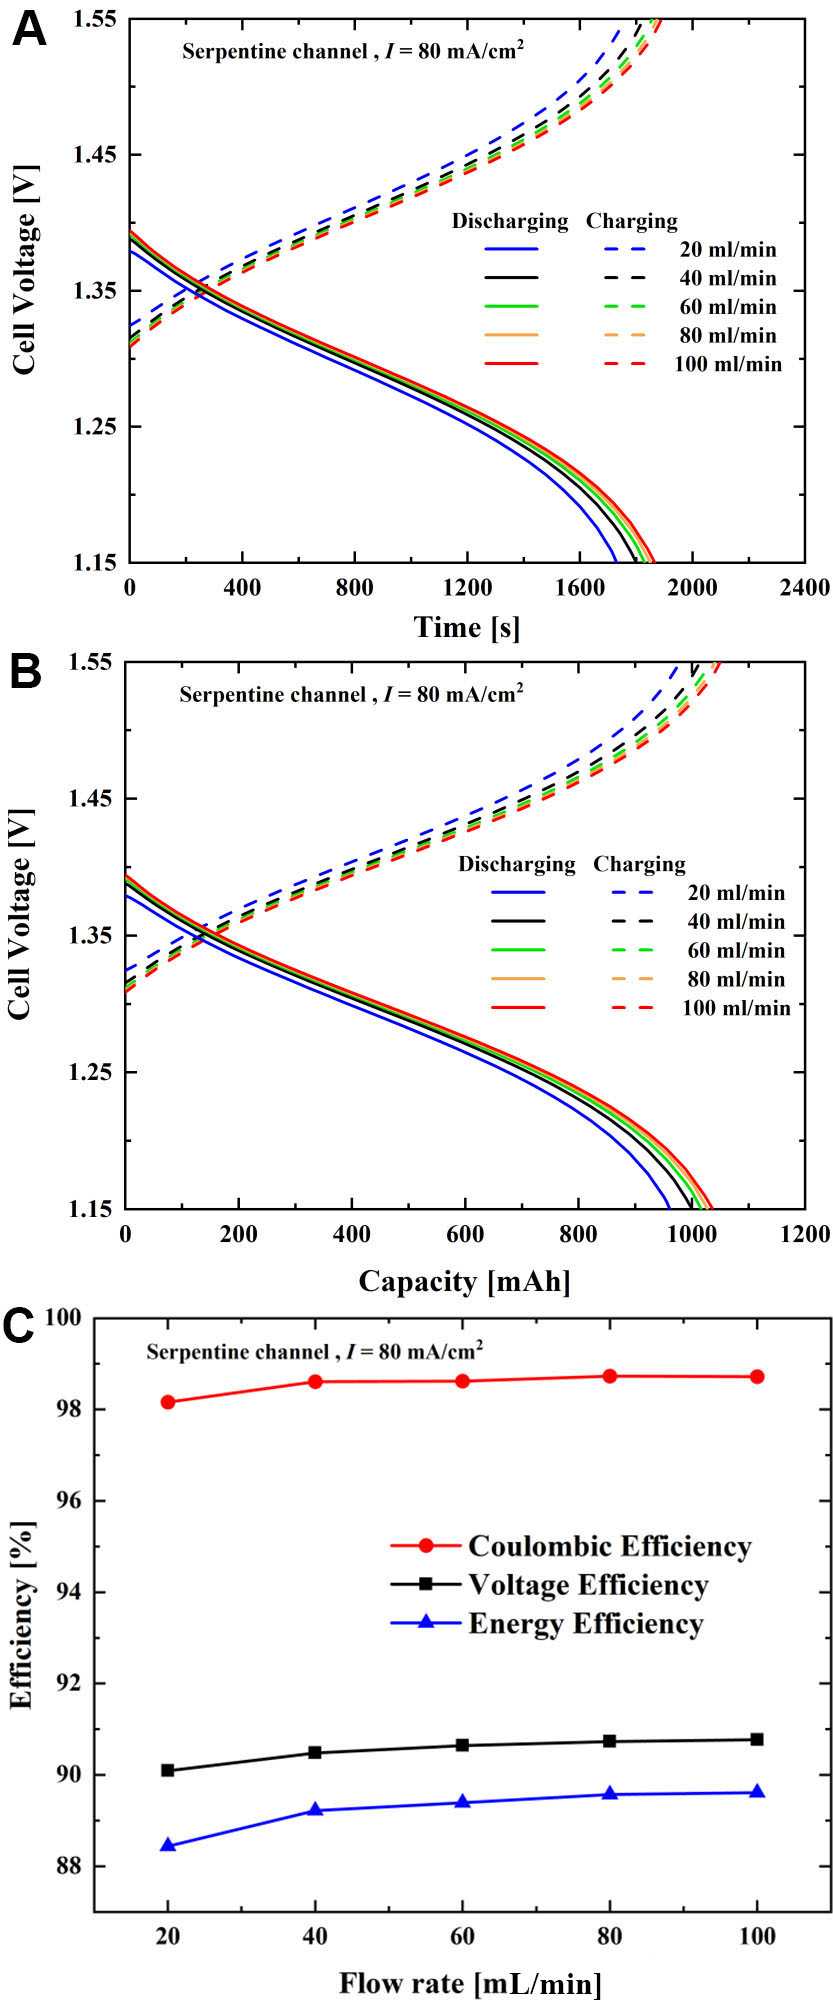
Figure 9. Comparison diagram of electrolyte flow effect of battery with SFC: (A) Voltage-time diagram; (B) Voltage-capacity diagram; (C) Voltage-efficiency diagram. SFC: Serpentine flow channel.
The detailed charge and discharge capacity data for the case of SFC at different electrolyte flow rates are provided in Table 6. It can be seen from Figure 9B that when the electrolyte flow rate increases from 20 to 100 mL min-1, the charging capacity of the battery increases from 979.2 to 1,049.78 mAh, and the discharge capacity increases from 961.23 to 1,036.39 mAh. When the electrolyte flow rate decreases from 100 to 20 mL min-1, the charge and discharge capacities of the battery decrease. Supplying electrolyte with a high flow rate can quickly replenish the vanadium ions consumed near the electrode, reduce the concentration overpotential, allow more vanadium ions to be utilized within the same voltage difference range, and lengthen the reaction time of the flow battery, so it has more charge and discharge capacities. When the electrolyte flow rate increases from 20 to 40 mL min-1, the battery discharge capacity increases by 4.08%. When the electrolyte flow rate increases from 40 to 60 mL min-1, the battery discharge capacity increases by 1.63%. When the electrolyte flow rate increases from 60 to 80 mL min-1, the battery discharge capacity increases by 1.07%. When the electrolyte flow rate increases from 80 to 100 mL min-1, the battery discharge capacity increases by 0.85%. When the electrolyte flow rate becomes larger and larger, although the battery discharge capacity will increase, the increase will become smaller and smaller. The electrolyte flow rate will also greatly affect the power of the pump, so it cannot continue to increase without any limitation.
Results under different electrolyte flow rates and voltage efficiencies of battery with SFC
| Flow rate (mL min-1) | Capacity (mAh) | Energy (Wh) | Efficiencies (%) | ||||
| Charge | Discharge | Charge | Discharge | CE | EE | VE | |
| 20 | 979.2 | 961.23 | 1.393 | 1.232 | 98.2 | 88.4 | 90.1 |
| 40 | 1,014.55 | 1,000.48 | 1.44 | 1.285 | 98.6 | 89.2 | 90.5 |
| 60 | 1,031.06 | 1,016.79 | 1.46 | 1.31 | 98.6 | 89.4 | 90.6 |
| 80 | 1,040.9 | 1,027.69 | 1.475 | 1.321 | 98.7 | 89.6 | 90.7 |
| 100 | 1,049.78 | 1,036.39 | 1.487 | 1.333 | 98.7 | 89.6 | 90.8 |
As shown in Figure 9C and Table 6, the CE of the SFC increases with increasing electrolyte flow rate, from 98.2% to 98.7%. When the electrolyte flow rate increases, the time for side reaction products to stay in the electrode and flow channel is reduced, reducing the chance of electrolyte cross-contamination. VE also increases with increasing electrolyte flow rate, from 90.1% to 90.8%. When the electrolyte flow rate increases, the electrolyte can quickly replenish the ions that complete the reaction near the electrode, reducing the possibility of concentration gradients, improving the efficiency of the electrochemical reaction, and reducing the voltage loss of the battery owing to concentration polarization. Finally, EE is a comprehensive index of the overall efficiency of the battery, which is obtained by multiplying CE and VE. Therefore, the EE increases from 88.4% to 89.6% by increasing these two parameters. As with discharge capacity, when the electrolyte flow rate increases, the efficiency of the three batteries tends to increase, but the increase rate becomes increasingly gentle. The electrolyte flow rate cannot continue to increase indefinitely; otherwise, it will impose a significant burden on the pump.
Electrolyte velocity vector plots at different electrolyte flow rates are shown in Figure 10. The results indicate that increasing the electrolyte flow rate enhances electrolyte permeation and convective transport within the porous electrode, allowing the reactants to be delivered more effectively to the electrode interior. Consequently, the non-uniform distribution of active species is alleviated, thereby reducing concentration polarization.
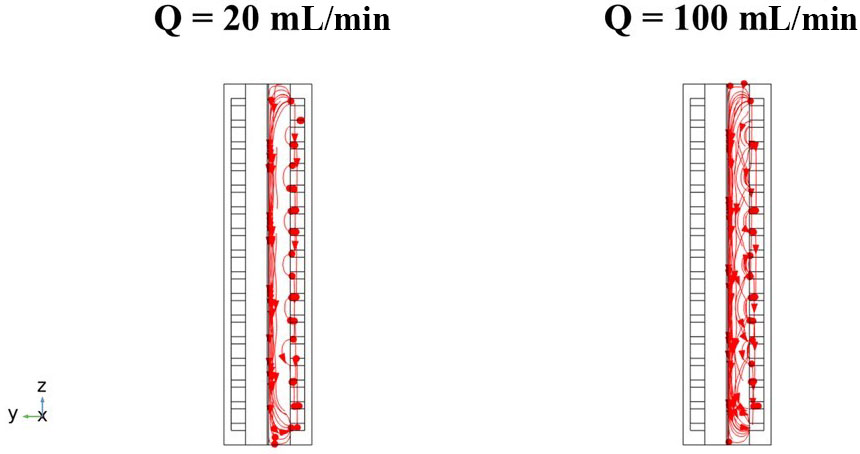
Figure 10. Electrolyte velocity vector plots at different electrolyte flow rates.
CONCLUSIONS
This study used four models of the VRFB flow channel, including PFC, IFC, IFC with pins, and SFC, to analyze the flow channel geometry and pressure distribution. The VRFB was also studied at different current densities and electrolyte flow rates for charging and discharging states, and the effects of these parameters on starting voltage, charge and discharge capacities, CE, VE, and EE were investigated. It was found that the pressure drops of the four types of flow channels in descending order are 5,023.4 Pa for the SFC, 332.75 Pa for the IFC, 203.07 Pa for the IFC with pins, and 135.79 Pa for the PFC. At a current density of 80 mA cm-2, the SFC has the largest discharge capacity of 1,016.79 mAh, followed by 956.42 mAh for the IFC, 947.64 mAh for the IFC with pins, and 671.22 mAh for the PFC. At high current densities, the charge and discharge time and capacity of the battery decrease. Although increasing the current density can improve the CE of the battery, it will increase the voltage loss and reduce the VE.
DECLARATIONS
Authors’ contributions
Conceptualization: Yang, T. F.; Hsieh, C. Y.; Lin, C. Y.; Yan, W. M.
Methodology: Yang, T. F.; Hsieh, C. Y.; Lin, C. Y.; Yan, W. M.
Investigation: Yang, T. F.; Hsieh, C. Y.; Lin, C. Y.; Yan, W. M.
Resources: Yang, T. F.; Hsieh, C. Y.; Lin, C. Y.; Yan, W. M.
Validation: Yang, T. F.; Hsieh, C. Y.; Lin, C. Y.; Yan, W. M.
Writing - original draft: Yang, T. F.; Hsieh, C. Y.; Lin, C. Y.; Yan, W. M.
Writing - review and editing: Rashidi. S.
Availability of data and materials
The raw data supporting the conclusions of this article will be made available by the authors on request.
AI and AI-assisted tools statement
During the preparation of this work, the author(s) used the AI tool ChatGPT (GPT-5.5, accessed May 2026) for editing the language and generating the Graphical Abstract. The authors reviewed and edited all AI-generated content and accept full responsibility for the published material.
Financial support and sponsorship
None.
Conflicts of interest
Yan, W. M. is the Editor-in-Chief of Advanced Energy Conversion. Lin, C. Y. is affiliated with Aurora Borealis Technology Co., Ltd. Neither of them was involved in any part of the editorial process, including reviewer selection, manuscript handling, or decision-making. The other authors declare that they have no conflicts of interest.
Ethical approval and consent to participate
Not applicable.
Consent for publication
Not applicable.
Copyright
© The Author(s) 2026.
REFERENCES
1. Enasel, E.; Dumitrascu, G. Storage solutions for renewable energy: a review. Energy. Nexus. 2025, 17, 100391.
2. Malik, F. H.; Hussain, G. A.; Alsmadi, Y. M. S.; Haider, Z. M.; Mansoor, W.; Lehtonen, M. Integrating energy storage technologies with renewable energy sources: a pathway toward sustainable power grids. Sustainability 2025, 17, 4097.
3. Hossain, M. H.; Abdullah, N.; Tan, K. H.; Saidur, R.; Mohd Radzi, M. A.; Shafie, S. Evolution of vanadium redox flow battery in electrode. Chem. Rec. 2023, 24, e202300092.
4. Yu, Z.; Jia, X.; Cai, Y.; et al. Electrolyte engineering for efficient and stable vanadium redox flow batteries. Energy. Storage. Mater. 2024, 69, 103404.
5. Remmler, N.; Bron, M. Recent progress in our understanding of the degradation of carbon-based electrodes in vanadium redox flow batteries - current status and next steps. ChemElectroChem 2024, 11, e202400127.
6. Brahma, K.; Nayak, R.; Verma, S. K. Sonika. Recent advances in development and application of polymer nanocomposite ion exchange membrane for high performance vanadium redox flow battery. J. Energy. Storage. 2024, 97, 112850.
7. Liao, H.; Gao, Y.; Wang, L.; et al. Chemical doping and O functionalization of carbon -based electrode to improve vanadium redox flow batteries. ChemSusChem 2024, 17, e202400705.
8. Ye, J.; Xia, L.; Li, H.; De Arquer, F. P. G.; Wang, H. The critical analysis of membranes toward sustainable and efficient vanadium redox flow batteries. Adv. Mater. 2024, 36, 2402090.
9. Chen, Y.; Bao, J.; Xu, Z.; et al. A hybrid analytical and numerical model for cross-over and performance decay in a unit cell vanadium redox flow battery. J. Power. Sources. 2023, 578, 233210.
10. Xiong, B.; Zhao, J.; Tseng, K.; Skyllas-Kazacos, M.; Lim, T. M.; Zhang, Y. Thermal hydraulic behavior and efficiency analysis of an all-vanadium redox flow battery. J. Power. Sources. 2013, 242, 314-24.
11. Tang, A.; Bao, J.; Skyllas-Kazacos, M. Thermal modelling of battery configuration and self-discharge reactions in vanadium redox flow battery. J. Power. Sources. 2012, 216, 489-501.
12. Lim, H.; Yi, J. S.; Lee, D. Correlations of through-plane cell voltage losses, imbalance of electrolytes, and energy storage efficiency of a vanadium redox flow battery. ChemSusChem 2019, 12, 1459-68.
13. Kim, D. K.; Yoon, S. J.; Lee, J.; Kim, S. Parametric study and flow rate optimization of all-vanadium redox flow batteries. Appl. Energy. 2018, 228, 891-901.
14. Zarei-Jelyani, M.; Loghavi, M. M.; Babaiee, M.; Eqra, R. The significance of charge and discharge current densities in the performance of vanadium redox flow battery. Electrochim. Acta. 2023, 443, 141922.
15. You, D.; Zhang, H.; Chen, J. A simple model for the vanadium redox battery. Electrochim. Acta. 2009, 54, 6827-36.
16. Yoon, S. J.; Kim, S.; Kim, D. K. Optimization of local porosity in the electrode as an advanced channel for all-vanadium redox flow battery. Energy 2019, 172, 26-35.
17. Mehboob, S.; Lee, J.; Hun Ahn, J.; et al. Perfect capacity retention of all-vanadium redox flow battery using Nafion/polyaniline composite membranes. J. Ind. Eng. Chem. 2023, 121, 348-57.
18. Zou, W.; Kim, Y.; Jung, S. Capacity fade prediction for vanadium redox flow batteries during long-term operations. Appl. Energy. 2024, 356, 122329.
19. Oh, K.; Moazzam, M.; Gwak, G.; Ju, H. Water crossover phenomena in all-vanadium redox flow batteries. Electrochim. Acta. 2019, 297, 101-11.
20. Jeong, D.; Jung, S. Numerical analysis of cycling performance of vanadium redox flow battery. Int. J. Energy. Res. 2020, 44, 5209-22.
21. Lemmermann, T.; Becker, M.; Stehle, M.; et al. Monitoring of vanadium mass transfer using redox potential probes inside membranes during charge and discharge of flow batteries: an experimental study. J. Power. Sources. 2024, 596, 233983.
22. Huang, Z.; Liu, Y.; Xie, X.; Huang, Q.; Huang, C. Experimental study on efficiency improvement methods of vanadium redox flow battery for large-scale energy storage. Electrochim. Acta. 2023, 466, 143025.
23. Kim, J.; Park, H. Experimental analysis of discharge characteristics in vanadium redox flow battery. Appl. Energy. 2017, 206, 451-7.
24. Zhang, B.; Lei, Y.; Bai, B.; Zhao, T. A two-dimensional model for the design of flow fields in vanadium redox flow batteries. Int. J. Heat. Mass. Transfer. 2019, 135, 460-9.
25. Tsushima, S.; Suzuki, T. Modeling and simulation of vanadium redox flow battery with interdigitated flow field for optimizing electrode architecture. J. Electrochem. Soc. 2020, 167, 020553.
26. Chen, W.; Kang, J.; Shu, Q.; Zhang, Y. Analysis of storage capacity and energy conversion on the performance of gradient and double-layered porous electrode in all-vanadium redox flow batteries. Energy 2019, 180, 341-55.
27. Knehr, K. W.; Agar, E.; Dennison, C. R.; Kalidindi, A. R.; Kumbur, E. C. A transient vanadium flow battery model incorporating vanadium crossover and water transport through the membrane. J. Electrochem. Soc. 2012, 159, A1446-59.
28. Yang, T.; Zheng, L.; Lin, C.; Teng, L.; Yan, W.; Rashidi, S. A comprehensive parametric study on thermal aspects of vanadium redox flow batteries. J. Therm. Anal. Calorim. 2023, 148, 14081-96.
29. Huang, Z.; Mu, A. Numerical research on a novel flow field design for vanadium redox flow batteries in microgrid. Int. J. Energy. Res. 2021, 45, 14579-91.
30. Wu, H.; Zeng, Y. Effect of baffles in flow channel on the performance of vanadium redox flow battery. Processes 2023, 11, 523.
31. Yang, F.; Qu, D.; Chai, Y.; Zhu, M.; Fan, L. Development of three-dimensional model for the analysis of the mass transport in vanadium redox flow batteries. Int. J. Hydrogen. Energy. 2022, 47, 27358-73.
32. Won, S.; Oh, K.; Ju, H. Numerical analysis of vanadium crossover effects in all-vanadium redox flow batteries. Electrochim. Acta. 2015, 177, 310-20.
33. Ali, E.; Kwon, H.; Choi, J.; Lee, J.; Kim, J.; Park, H. A numerical study of electrode thickness and porosity effects in all vanadium redox flow batteries. J. Energy. Storage. 2020, 28, 101208.
34. Kim, A. R.; Poudel, M. B.; Yoo, D. J. Metal organic framework-derived, N-C-SO3H/COOH-incorporated, phenolphthalein-based propyl sulfonated poly(arylene ether) composite membranes for proton exchange membranes in fuel cells. J. Membr. Sci. 2025, 735, 124555.
35. Yaji, K.; Yamasaki, S.; Tsushima, S.; Suzuki, T.; Fujita, K. Topology optimization for the design of flow fields in a redox flow battery. Struct. Multidisc. Optim. 2017, 57, 535-46.
36. Maurya, S.; Nguyen, P. T.; Kim, Y. S.; Kang, Q.; Mukundan, R. Effect of flow field geometry on operating current density, capacity and performance of vanadium redox flow battery. J. Power. Sources. 2018, 404, 20-7.
37. Lu, M.; Jiao, Y.; Tang, X.; Yang, W.; Ye, M.; Xu, Q. Blocked serpentine flow field with enhanced species transport and improved flow distribution for vanadium redox flow battery. J. Energy. Storage. 2021, 35, 102284.
38. Xu, Q.; Zhao, T. Fundamental models for flow batteries. Progr. Energy. Combust. Sci. 2015, 49, 40-58.
39. Yin, C.; Gao, Y.; Xie, G.; Li, T.; Tang, H. Three dimensional multi-physical modeling study of interdigitated flow field in porous electrode for vanadium redox flow battery. J. Power. Sources. 2019, 438, 227023.
40. Ma, X.; Zhang, H.; Xing, F. A three-dimensional model for negative half cell of the vanadium redox flow battery. Electrochim. Acta. 2011, 58, 238-46.
41. Kim, Y.; Choi, Y. Y.; Yun, N.; et al. Activity gradient carbon felt electrodes for vanadium redox flow batteries. J. Power. Sources. 2018, 408, 128-35.
42. Wang, Q.; Yan, R.; Chen, J.; Jiang, Z.; Qu, Z. Numerical study of vanadium redox flow battery with gradient porosity induced by electrode compression. J. Energy. Storage. 2023, 72, 108465.
Cite This Article
 Open Access
How to Cite
Download Citation
Export Citation File:
Type of Import
Tips on Downloading Citation
Citation Manager File Format
Type of Import
Direct Import: When the Direct Import option is selected (the default state), a dialogue box will give you the option to Save or Open the downloaded citation data. Choosing Open will either launch your citation manager or give you a choice of applications with which to use the metadata. The Save option saves the file locally for later use.
Indirect Import: When the Indirect Import option is selected, the metadata is displayed and may be copied and pasted as needed.
About This Article
Copyright

Data & Comments
Data
0




Comments
Comments must be written in English. Spam, offensive content, impersonation, and private information will not be permitted. If any comment is reported and identified as inappropriate content by OAE staff, the comment will be removed without notice. If you have any queries or need any help, please contact us at support@oaepublish.com.