

From carbon emissions scenario simulation to source-sink integration technological pathways in central business districts
 0
0 Abstract
This study explores low-carbon transition strategies for central business districts (CBDs) using Qingpu New Town in Shanghai, China, as a case study. Employing a dual-path approach - combining top-down scenario simulation with bottom-up technological decarbonization potential accounting - we model carbon emissions from 2022 to 2040 under four scenarios: Business-As-Usual, General Development, Balanced Development, and High-Quality Development. Under the High-Quality Development scenario, carbon emissions peak in 2028 and decline by 47.3% compared with the Business-As-Usual scenario by 2040. Building on these results, six sectoral source-sink integration technological pathways - covering buildings, energy, transportation, solid waste, water resources, and carbon sinks - are evaluated. Results show that energy-efficient building design plays a leading role in emission reduction, while energy storage and optimization of green travel structures become increasingly important. All scenario-specific technology packages meet their projected reduction targets. The study recommends integrating scenario planning into CBD development processes, incentivizing multi-sectoral technological synergies, and fostering collaborative governance. These insights provide a practical roadmap for the low-carbon transformation of CBDs, aligning with China’s carbon neutrality goals.
Keywords
INTRODUCTION
Climate change represents one of the most pressing existential threats facing humanity today[1-4]. In response, countries worldwide have committed to ambitious targets such as carbon peaking and carbon neutrality, signaling a paradigm shift toward systemic, strategic decarbonization[2,4,5]. Urban areas, as centers of economic activity, population concentration, and infrastructure development, are at the forefront of this transition[3,6-11]. Within cities, Central Business Districts (CBDs) are particularly significant due to their intensive energy use, high-density built environments, and concentrated carbon emissions[12]. While CBDs are often regarded as engines of economic growth, they are also hotspots of carbon intensity, making them critical targets for emissions reduction strategies[7]. CBDs concentrate high-rise offices, transport flows, and service industries, creating emissions hotspots but also high-leverage opportunities for integrated, district-scale decarbonization[7,10,12,13].
Over the past decade, a growing body of literature has examined urban carbon emissions using two dominant methodological paradigms: top-down and bottom-up approaches[14]. Top-down models assess the influence of macro-level variables - such as population growth, GDP per capita, urbanization rates, energy intensity, and energy structure - on carbon emissions. These models often employ frameworks such as the Stochastic Impacts by Regression on Population, Affluence and Technology (STIRPAT) model[15,16], input-output analysis[17-19], and integrated energy-economy-environment system models[20,21]. These methods are valuable for projecting long-term trends under different development scenarios and analyzing interactions among sectors at regional or national scales[22-24]. However, they are often criticized for insufficiently capturing technological specifics that are crucial at the urban and district levels, particularly in high-density environments such as CBDs. In contrast, bottom-up approaches estimate emissions from buildings[13,25-27], transport[28,29], energy[30-32], water and solid waste systems[33], and urban green-blue infrastructure[34-36], enabling technology-level decarbonization roadmaps. Evidence shows substantial potential from deep energy retrofits and electrification of commercial buildings[25], rooftop or building-integrated photovoltaics (BIPV)[13,30], mobility demand management and electrified transit[37,38], smart hybrid energy systems[31,32], and nature-based carbon sinks[34,35,39]. Nonetheless, many bottom-up studies are project- or sector-specific, with limited linkage to broader socioeconomic trajectories, rebound risks, and multi-sector synergies or trade-offs that shape outcomes over time[40-42].
Most notably, both top-down and bottom-up studies have predominantly focused on city- or regional-scale analyses. Research specifically targeting CBDs - distinct spatial-functional units characterized by complex land use, vertical density, and interdependent systems - remains scarce. Existing CBD-focused studies typically examine building energy efficiency[43,44] or traffic flow optimization[45,46], while few have developed integrated frameworks that model emissions under multiple scenarios while aligning with concrete technological solutions and policy goals[47,48]. As cities move toward carbon neutrality by mid-century, it becomes increasingly important to align long-term emissions reduction targets with feasible technological implementation pathways, particularly in high-potential areas such as CBDs[5,47-49].
Addressing these gaps, this study proposes a comprehensive framework that integrates top-down and bottom-up approaches to explore and quantify carbon emissions trajectories and technological decarbonization potential in the Qingpu New Town CBD in Shanghai, China. From the top-down perspective, we build a multi-scenario forecasting model for the period 2022-2040, incorporating key socioeconomic drivers such as economic growth, energy intensity, and energy structure. Four scenarios are constructed: Business-As-Usual (BAU), General Development (GD), Balanced Development (BD), and High-Quality Development (HQD), reflecting climate action and sustainable urban development objectives. From a bottom-up perspective, we conduct a comprehensive review of national, provincial, and municipal policy documents related to China’s dual-carbon goals, identifying a portfolio of low-carbon technologies and green infrastructure strategies applicable to CBDs. These technologies encompass buildings, energy, transportation, water resources, solid waste management, and carbon sinks. Based on policy requirements, we then calculate the carbon reduction potential of these technology portfolios under different implementation intensities and compare the results with the emission reduction targets of each scenario for Qingpu New Town CBD. This approach verifies whether projected reductions from different technological configurations are sufficient to meet scenario-specific targets, providing quantitative and policy-aligned technological support for low-carbon development.
This study makes several key contributions. First, it proposes an integrated dual-pathway framework that bridges macro-level carbon scenario modeling with micro-level technology assessment, enhancing the coherence and practical relevance of carbon reduction planning. Second, it focuses on CBDs as a unique unit of analysis - an area underrepresented in the existing literature but highly significant for urban carbon governance. Third, by aligning emission targets from top-down modeling with bottom-up technological pathways and current policy frameworks, the study provides actionable insights for urban policymakers, planners, and infrastructure investors. Finally, the proposed methodology has broader implications beyond the case study area. As many global cities face similar challenges in balancing economic growth with environmental sustainability, this framework can serve as a replicable model for decarbonization planning in high-density urban cores, supporting science-based, technology-enabled, and policy-integrated pathways toward low-carbon cities.
METHODS
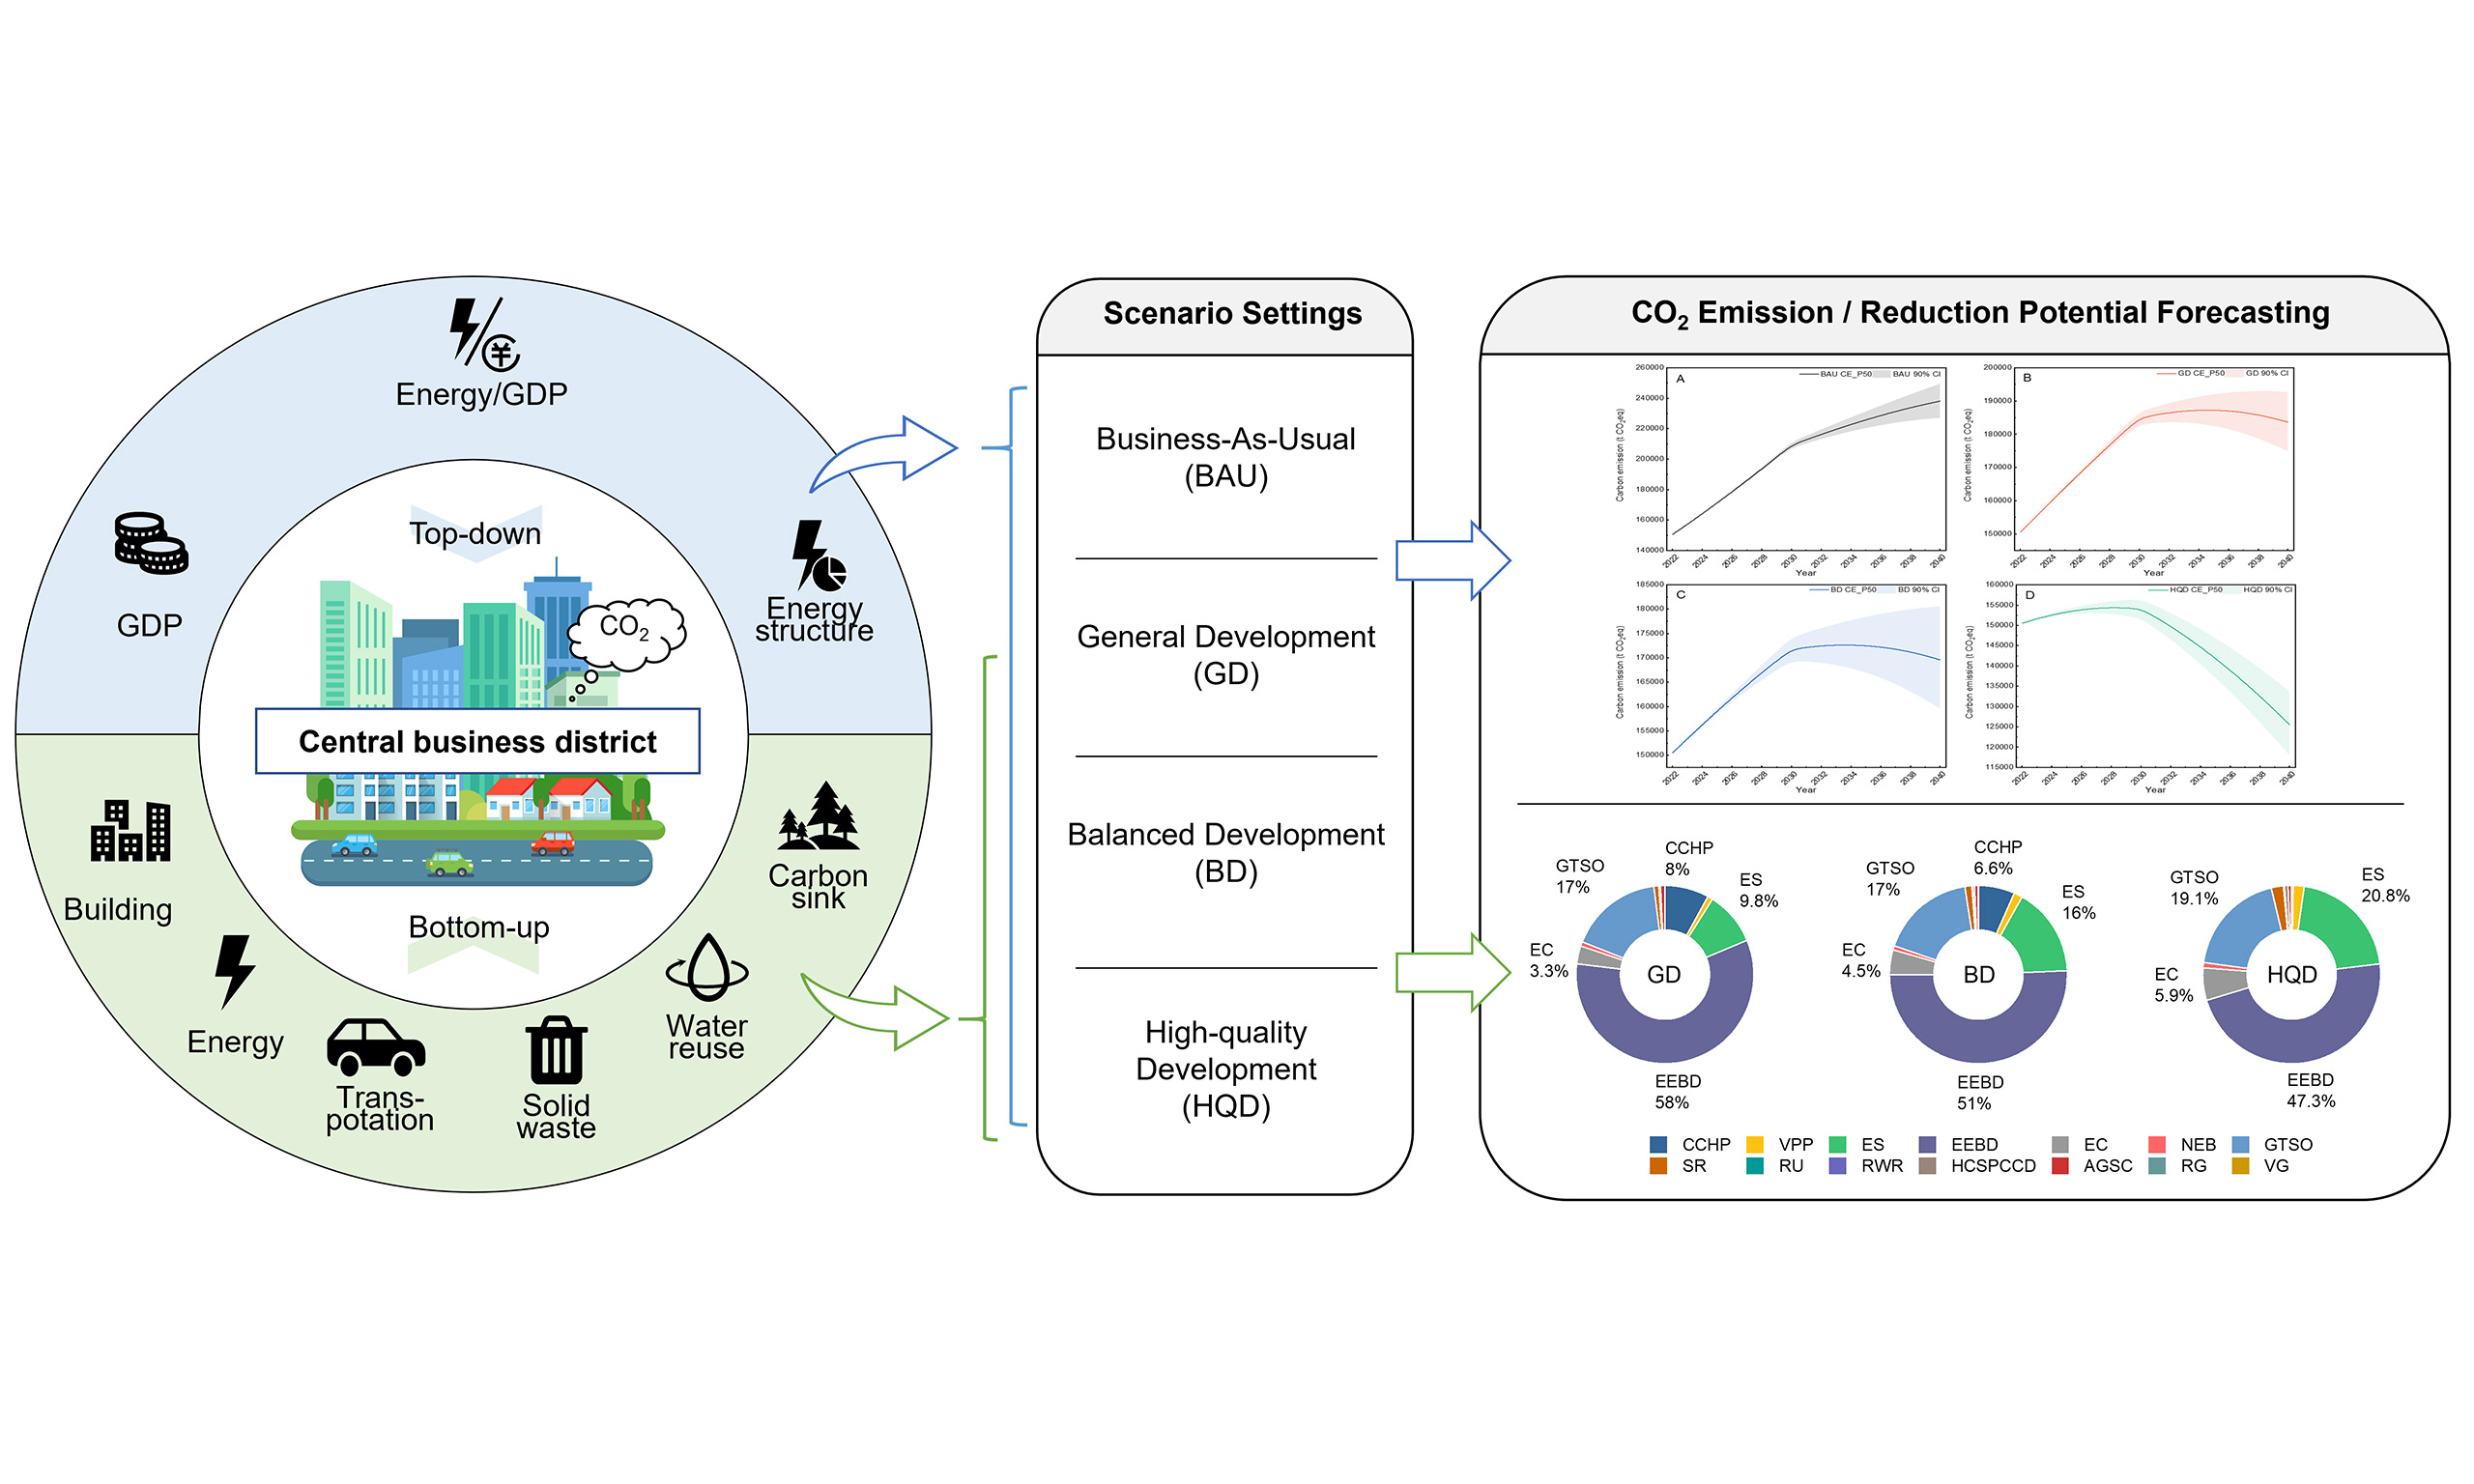
This study innovatively develops a dual-pathway analytical framework that integrates both bottom-up and top-down approaches. By combining socioeconomic data with multi-scenario simulations, we project future CBD carbon emissions with quantified uncertainty and conduct sensitivity analyses. Building on this foundation, and guided by policy directives and technological characteristics, we systematically evaluate the implementation potential of emission reduction technologies across sectors such as buildings, energy, transportation, solid waste, water resources, and carbon sinks, which can reduce carbon emissions and enhance carbon sinks. The framework quantifies carbon reduction benefits under varying levels of implementation intensity and ultimately formulates an integrated technological pathway for emission reduction and ecological enhancement.
Compared with traditional single-mode accounting frameworks, this approach overcomes key limitations and provides a scientifically robust and operationally feasible technological paradigm to support the low-carbon transition of CBDs. It offers significant practical value in guiding efforts to achieve urban carbon neutrality. The overall technical roadmap is shown in Figure 1.
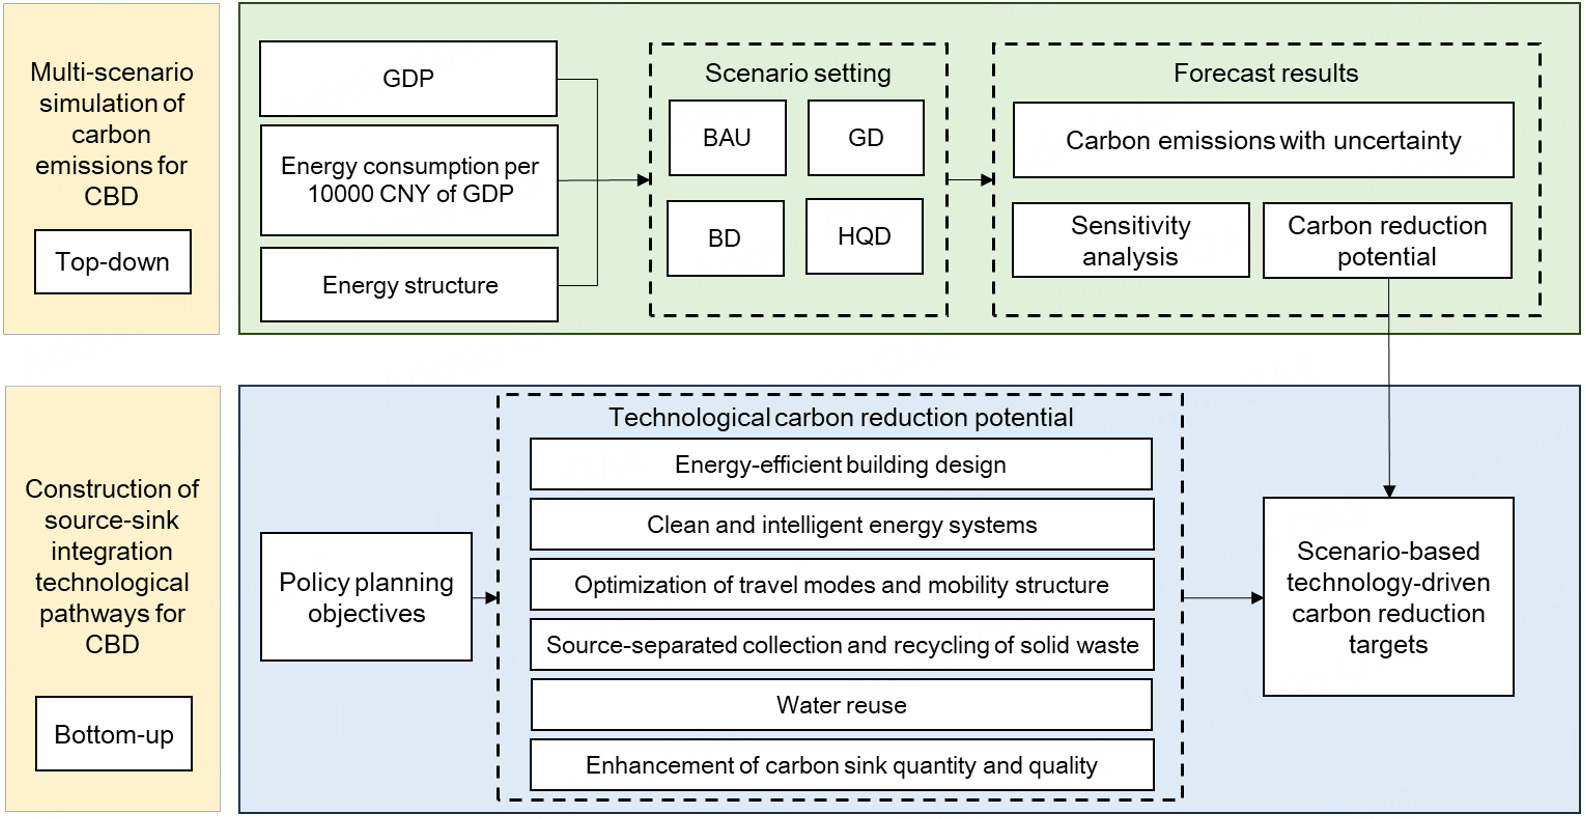
Figure 1. Technology roadmap. GDP: Gross domestic product; CNY: Chinese yuan; CBD: central business district; BAU: business-as-usual; GD: general development; BD: balanced development; HQD: high-quality development.
The CBD of Qingpu New Town is located at the intersection of the Yangtze River Delta Digital Mainline and the industrial-urban development axis of Waiqingsong Road. It is bordered by the Tongjiang-Sanya Highway to the east, Yinggang Road to the south, Shengli Road to the west, and Songze Avenue to the north, covering approximately 6.5 km2, with a sample area of 3 km2. As one of Shanghai’s “Five New Towns”, Qingpu New Town is planned as a comprehensive nodal city with a radiating influence within the Yangtze River Delta urban agglomeration. The CBD, as its core area, plays an exemplary role in promoting green, low-carbon construction, transformation, and sustainable urban development.
Data for this study were collected from multiple official sources. GDP data were sourced from the Shanghai Statistical Yearbook and Qingpu Statistical Yearbook (2013 to 2022). Industrial land data were derived from the “Overall Plan and Land Use Master Plan of Qingpu District, Shanghai (2017-2035)” and “The Relocation Plan for Enterprises in the CBD Park”. Land use in the business district, population statistics, solid waste generation, and water consumption indicators were obtained from the “Partial Adjustment of the Control Detailed Plan for QPC1-0012, QPC1-0008, and QPC1-0009 Units in Qingpu New Town, Qingpu District, Shanghai”. Building energy consumption data were taken from the “Research Report on the Implementation Plan for Carbon Peak in the Building Sector of Qingpu District” and the “2022 Energy Consumption Monitoring and Analysis Report for Government Office Buildings and Large Public Buildings in Shanghai”. Travel mode share data came from the “Comprehensive Transportation Plan for Qingpu New Town (2021-2035)”, and power emission factors were based on the “Notice on Adjusting the Emission Factor Values in the Greenhouse Gas Emission Accounting Guidelines of Shanghai Municipality”.
Carbon emissions forecast method
This study simulates carbon emissions in the business district under different economic development scenarios using a scenario-analysis approach based on a top-down accounting method. The analysis focuses on three main energy types - gasoline, natural gas, and electricity - with carbon emissions calculated separately for each, as given in[50]
where CE represents the carbon emissions of the business district (tCO2eq), GDP is the gross domestic product of the business district (10,000 CNY), EGDP denotes the energy consumption per 10,000 CNY of GDP (tce/10,000 CNY), and αO, αG, and αe are the shares of gasoline, natural gas, and electricity in total energy consumption (%), respectively; βO, βG, and βe are the energy conversion factors for gasoline (t/tce), natural gas (m3/tce), and electricity (kWh/tce), respectively; EFO, EFG, and EFe are the carbon emission factors for gasoline (tCO2eq/t), natural gas (tCO2eq/m3), electricity (tCO2eq/kWh), respectively; PRE is the share of renewable energy in total electricity consumption (%).
Due to data limitations, the base-year GDP of the business district is estimated based on the industrial GDP of the broader administrative region, scaled by area. As the region is currently dominated by secondary and tertiary industries, the calculation primarily considers GDP from these two sectors, as determined by[51]
where GDPSI,CBD and GDPRI,CBD represent the secondary and tertiary industry GDPs of the business district (10,000 CNY), respectively; GDPSI and GDPTI are the secondary and tertiary industry GDPs of the broader administrative region (10,000 CNY), respectively; SSI and STI are the land areas allocated to secondary and tertiary industries in the broader region (m2), respectively; SSI,CBD and SRI,CBD are the land areas used for secondary and tertiary industries within the business district (m2), respectively.
Key time-varying parameters - GDP growth and the share of renewable energy in total electricity consumption - are modeled with decreasing and increasing logistic functions, respectively, to capture long-run asymptotes and mid-term inflection points. Logistic parameters are determined through a two-point anchoring scheme using the base year, target year, and lower/upper bounds, as given in[52]
where PRE(t) denotes the share of renewable energy in total electricity consumption; Lp < Up are the long-run lower and upper bounds, rp > 0 is the steepness parameter, and
GDP levels are projected by compounding annual growth from the base-year GDP. All other parameters and energy shares are taken from externally specified year-by-year deterministic schedules and normalized annually.
Uncertainty is concentrated at the target-year anchors. To balance interpretability and robustness, the target-year values are assumed to follow a triangular distribution:
In the scenario simulation, the carbon reduction potential under the optimized scenario is calculated using Equation (7). The overall carbon emission reduction resulting from the decrease in the external electricity emission factor is not influenced by the technologies within the business district. Therefore, the technological carbon reduction target is expressed as Equation (8).
where G is the carbon reduction potential under the optimized scenario (tCO2eq); Gt is the technological carbon reduction target (tCO2eq); CEB and CEO are the carbon emissions in the baseline and optimized scenarios (tCO2eq), respectively; GDP is the Gross Domestic Product of the business district (10,000 CNY); EGDP is the energy consumption per 10,000 CNY of GDP (tce/10,000 CNY); αe is the proportion of electricity in total energy consumption (%); PRE is the proportion of renewable energy in total electricity consumption (%); βe is the conversion factor for electricity (kWh/tce); EFe,B and EFe,O are the electricity carbon emission factors in the baseline and optimized scenarios (tCO2eq/kWh), respectively.
Carbon emissions scenario settings
(1) Scenario setting
The CBD of Qingpu New Town is in a stage of rapid construction and development, and total energy consumption is expected to continue increasing. However, with ongoing green upgrades and optimization of the energy structure, the CBD is projected to achieve relatively slow growth in carbon emissions while maintaining sustained and rapid growth of the social economy. Based on the current energy supply situation and trend prediction, four different scenarios have been designed, each corresponding to different rates of socioeconomic growth, energy efficiency improvements, and energy structure adjustments. These scenarios are summarized in Table 1. It provides a window for technological preparation following the 2030 carbon peak target and connects to the 2060 carbon neutrality vision. Therefore, the scenario simulations in this chapter cover the period from 2022 to 2040.
Carbon emission scenario settings
| Scenario name | Scenario description |
| Business-As-Usual (BAU) | The business-as-usual scenario assumes that socioeconomic development continues at the current average pace, and the carbon emission factor for electricity remains unchanged. Regional development and construction proceed without the implementation of any additional targeted policies |
| General Development (GD) | Building upon BAU, this scenario incorporates improvements in energy efficiency and energy structure, leading to a moderate reduction in electricity carbon intensity. It supports the development of local photovoltaics, moderate deployment of hydrogen energy, gradual electrification of end-use sectors, application of new energy storage technologies, construction of low-carbon buildings, green transportation systems, and enhanced ecological carbon sink capacity |
| Balanced Development (BD) | Based on GD, this scenario assumes accelerated economic growth, further enhancements in energy efficiency and structure, and additional reductions in electricity carbon intensity. It emphasizes large-scale photovoltaic deployment, appropriate hydrogen development, increasing electrification in end-use sectors, efficient reclaimed water reuse systems, application of new energy storage technologies, construction of low-carbon buildings, green transport systems, and strengthened ecological carbon sinks |
| High-Quality Development (HQD) | On top of BD, this scenario envisions substantial improvements in energy efficiency and structure, with a sharp reduction in the electricity carbon intensity and high-quality socioeconomic growth. It promotes full-scale photovoltaic deployment, active hydrogen energy utilization, increased procurement of clean external electricity, higher electrification of end-use sectors, establishment of efficient water reuse systems, adoption of new energy storage technologies, development of high-quality low-carbon buildings, people-oriented green transport systems, and the formation of high-capacity ecological carbon sinks |
(2) Parameter settings
a. GDP growth rate
In 2022, the GDP of the CBD of Qingpu New Town was estimated at 2.722 billion CNY. Due to limitations in data availability, this study sets GDP growth rates based on historical data from Qingpu District over the past decade and relevant research reports. Between 2013 and 2023, Qingpu District’s average annual GDP growth rate was 5.53%. According to Shanghai’s 14th Five-Year Plan, the city’s expected average annual GDP growth rate from 2021 to 2025 is projected to align closely with the national economic growth rate. The State Information Center[53] projects China’s GDP to grow at an average annual rate of 5.0% between 2021 and 2035, and 3.5% between 2036 and 2050. Based on these data, the GDP growth rate of the CBD of Qingpu New Town, g(t), is assumed to follow a decreasing logistic trajectory. Long-run bounds are set at
b. Share of renewable energy generation
According to the 2022 National Renewable Energy Power Development Monitoring and Evaluation Report released by the National Energy Administration, the share of renewable energy in Shanghai’s total electricity consumption was 29.8%. Future projections of this share are based on the Implementation Plan for Carbon Peaking in the Energy and Power Sector of Shanghai, which targets a renewable energy share of approximately 40% by 2030. In addition, the Implementation Plan for the Construction of the Chongming World-Class Ecological Island Carbon Neutral Demonstration Zone (2022 Edition) anticipates that by 2035, renewable energy will comprise more than 60% of Chongming Island’s total electricity consumption. Considering these references and the specific characteristics of the CBD, the share of renewable energy in total electricity consumption, PRE(t), is modeled as an increasing logistic function. Long-run bounds are set at Lp = 0 and Up = 0.8. The base-year anchor is PRE(2022) = 0.298. The target-year anchor in 2040 follows a triangular distribution: Tri(0.277, 0.298, 0.319) for BAU, Tri(0.326, 0.350, 0.375) for GD, Tri(0.419, 0.45, 0.48) for BD, and Tri(0.465, 0.500, 0.535)for HQD. Rates for core years are shown in
c. Annual decline rate of energy consumption per unit of GDP
Due to data limitations, the energy consumption per unit of GDP for Shanghai is used as a proxy for that of the CBD of Qingpu New Town. Based on this approach, the energy consumption per 10,000 CNY of GDP in 2022 was calculated as 0.26 tce. The national 14th Five-Year Plan calls for a 13%-14% reduction in energy consumption per unit of GDP, which corresponds to an average annual reduction of approximately 2.66%. The Implementation Opinions on Fully, Accurately, and Comprehensively Implementing the New Development Philosophy and Advancing Carbon Peaking and Carbon Neutrality and the Carbon Peaking Implementation Plan of Shanghai both set a target of a 14% reduction in energy consumption per unit of GDP by 2025 relative to 2020. Given variations in energy intensity reduction across Shanghai’s districts and the fact that the CBD of Qingpu New Town is in a phase of rapid development and construction from 2022 to 2040, the annual reduction rates of energy consumption per 10,000 CNY of GDP are set based on historical data, national targets, and the CBD’s development trajectory: Under the BAU: 1% for 2023-2030 and 3% for 2031-2040; Under the GD: 1.5% for 2023-2030 and 3% for 2031-2040; Under BD: 2% for 2023-2030 and 3% for 2031-2040; Under HQD: 2% for 2023-2030 and 3% for 2031-2040. Rates for core years are presented in Supplementary Table 3.
d. Energy structure
The Greenhouse Gas Emissions Inventory Report of Qingpu District indicates that, in 2022, the district’s energy mix consisted of 32.7% gasoline, 7.3% natural gas, and 60.0% electricity. In the CBD, gasoline is primarily used in transportation, natural gas is mainly used for heating, cooling, and hot water, and electricity accounts for a significant share of building energy use, supporting functions such as lighting, air conditioning, elevators, and office equipment. Electricity is also the primary energy source for electric vehicles in transportation. Given the anticipated increase in electrification in both building and transportation sectors, and the already high share of electricity in buildings within the CBD, the projected energy mix for 2040 under GD, BD, and HQD is 12.0% gasoline, 15.0% natural gas, and 73.0% electricity. From the base year to 2040, the share of gasoline is projected to decline linearly, while natural gas and electricity shares increase linearly. Key values for milestone years are presented in
e. Electricity emission factor
In this study, the electricity emission factor primarily refers to the emission factor of purchased electricity. According to the Notice from the Shanghai Municipal Bureau of Ecology and Environment on Adjusting the Emission Factors in the Municipal Greenhouse Gas Accounting Guidelines, the current electricity emission factor in Shanghai is 4.2 tCO2eq/104 kWh. The Research Report on the Carbon Peaking Implementation Plan for the Building Sector in Qingpu District projects that Shanghai’s electricity emission factor will decrease to 3.25 tCO2eq/104 kWh by 2040. Furthermore, according to the latest forecasts from relevant experts and institutions, the emission factor is expected to decline to
f. Population
The population of the CBD in Qingpu New Town was 20,000 in 2022. According to the Shanghai New Town Planning and Construction Guidelines, population density in new cities should be no less than 12,000 people per square kilometer. Based on the planned area of 6.46 km2, the total population is expected to reach approximately 80,000. Therefore, this study sets the population at 20,000 in 2022 and 80,000 in 2040, with linear growth assumed for the intervening years. Population figures for core years are shown in Supplementary Table 7.
Estimation of technological emission reduction potential
To achieve low-carbon development in the business district, it is essential to build an integrated system of technologies. This system should follow three core principles: systematic integration, practical feasibility, and problem-oriented focus, with the goal of establishing a low-carbon technology framework tailored to the specific needs of CBDs. First, the system should emphasize a comprehensive technological pathway by integrating technologies across multiple domains, including buildings, energy, transportation, solid waste, water resources, and carbon sinks. Second, practical feasibility must be considered by selecting low-carbon technologies that are well-suited to local resource conditions and the characteristics of the business district, ensuring strong adaptability and operational viability. Lastly, the approach should be problem-oriented, targeting key challenges such as suboptimal carbon emission structures and insufficient green infrastructure. By aligning technology integration with actual needs, this approach aims to drive an efficient and low-carbon transformation of the business district.
(1) Buildings
This study aims to reduce building operational energy consumption within the business district by incorporating nearly zero-energy buildings, ultra-low-energy buildings, three-star green buildings, and two-star green buildings. The potential energy savings of these building types are shown in Table 2. In the table, percentage values represent the reduction in energy consumption compared to current building standards, while numerical values represent the maximum allowable integrated energy consumption for each building type (unit: kWh/m2/a). The integrated energy consumption values exclude contributions from renewable energy generation. Therefore, the carbon reduction benefits from solar photovoltaic systems - detailed under energy technologies - are already accounted for in the carbon reduction attributed to this building-related strategy.
Energy consumption requirements for green/nearly zero-energy/ultra-low energy buildings
| Type | Residential buildings | Public | Reference |
| Nearly zero-energy buildings | 55 | 60% | Technical Standard for Nearly Zero-Energy Buildings |
| Ultra-low energy buildings | 65 | 50% | Technical Standard for Nearly Zero-Energy Buildings |
| Three-star Green Buildings | 15% | 15% | Green Building Evaluation Standard |
| Two-star Green Buildings | 10% | 10% | Green Building Evaluation Standard |
The carbon reduction is calculated as follows[54]:
where CERBES is the carbon emission reduction from building energy-saving design (tCO2eq), S is the building area (m2), EGB is the energy consumption per unit area of green/ultra-low energy/nearly zero-energy buildings (kWh/m2), ECS is the current building energy consumption per unit area (kWh/m2), and
(2) Energy
a. Solar Photovoltaic Technology, including rooftop photovoltaics and photovoltaic curtain walls. The carbon reduction is calculated using[42,54]
where CERRP is the carbon reduction from rooftop photovoltaics (tCO2eq), CERPCW is the carbon reduction from photovoltaic curtain walls (tCO2eq), S is the building land area (m2), ρ is the building density, α is the rooftop utilization rate, β is the conversion coefficient, AEG is the average annual electricity generation per unit area (MWh/m2), EF is the electricity emission factor (tCO2eq/MWh), FAR is the floor area ratio, γ is the facade sunlight area coefficient, and δ is the installation area coefficient.
b. Combined Cooling, Heating and Power (CCHP) Technology, with its carbon reduction calculated as[54]:
where CERCCHP is the carbon reduction from the CCHP system (tCO2eq), EGPG is the electricity supplied to the grid (MWh), EH is the heating output (MWh), EC is the cooling output (MWh), EFe is the electricity emission factor (tCO2eq/MWh), Cgas is the natural gas consumption (m3), and EFgas is the natural gas emission factor (tCO2eq/m3).
c. Virtual Power Plant Technology, with its carbon reduction calculated as[55]:
where CERVPP is the carbon reduction from the virtual power plant (tCO2eq), S is the building area (m2), P is the power load per unit building area (MW), EFL is the proportion of flexible, adjustable load (%), x is the proportion connected to the virtual power plant (%), T is the peak regulation time (hours), and EFe is the electricity emission factor (tCO2eq/MWh).
d. Energy Storage Technology, with its carbon reduction calculated as[56]:
where CERES is the carbon reduction from energy storage technology (tCO2eq), V is the storage capacity (MW), P is the annual storage time (hours), MP is the peak period electricity price (CNY/kWh), MV is the valley period electricity price (CNY/kWh), MU is the normal period electricity price (CNY/kWh), and EFe is the electricity emission factor (tCO2eq/MWh).
(3) Transportation
a. New Energy Vehicles, including new energy buses and electric cars, have their carbon reduction calculated as[42,54]:
where CERNEV is the carbon reduction from new energy vehicles (tCO2eq), EFNEV is the carbon emission factor of new energy vehicles under the baseline scenario (gCO2eq/person trips/km), EFNEV,o is the carbon emission factor under the optimized scenario (gCO2eq/person trips/km), y is the proportion of trips made by new energy vehicles (%),O0 is the total daily trips by the resident population in the business district (person trips), and D is the trip distance (km).
b. Green Travel Structure Optimization Technology. Transit-Oriented Development (TOD) and slow traffic network systems function synergistically to improve the travel structure and reduce trip intensity, thereby supporting low-carbon transportation goals. Due to tight data coupling, these factors are calculated together[42,54]:
where CERtc is the annual carbon reduction from green travel structure optimization (tCO2eq), CEt,o and CEt are annual traffic carbon emissions under the optimized and baseline scenarios (gCO2eq), respectively, S is the total area of the business district (km2), αi,land is the land use proportion of the i-th land type (%), βi,land is the travel correction coefficient per unit area, xland is the average daily trips per unit area (person
(4) Solid waste
In the solid waste management of the business district, the focus is placed on source-sorted recycling technologies, with carbon reduction calculated as[57]:
where CERsr is the carbon reduction from source-sorted recycling technologies (tCO2eq), CEwd and CEwd,o are the carbon emissions from solid waste treatment under the BAU and optimized scenarios, solid waste treatment (tCO2eq), Ww is the amount of solid waste generated in the business district (kg), Wwr and Wwr,o are the amounts of recyclable waste under the BAU and optimized scenarios (kg), and EFwd is the carbon emission factor for waste treatment (kgCO2eq/kg).
(5) Water reuse
This study adopts unconventional water reuse technologies, including reclaimed water reuse and rainwater utilization. The carbon reduction is calculated as[57]:
where CERWU is the carbon reduction from water-saving technologies (tCO2eq), VSW is the volume of unconventional water sources substituting tap water (t), and EFTW is the carbon emission factor for tap water production (kgCO2eq/t).
(6) Carbon sink
Carbon sink technologies are divided into high carbon sink plant combinations and community design, rooftop greening, vertical greening, and affiliated green space construction technologies. For high carbon sink plant combinations and community design, the carbon reduction is calculated as[54]:
where CERpd is the carbon reduction from high carbon sink plant combinations and community design (tCO2eq), CFg,o and CFg are the optimized and baseline annual carbon absorption per unit green space area (kgCO2eq/ m2), and Sg is the green space area (m2).
For rooftop greening, vertical greening, and affiliated green space construction, the carbon reduction is calculated as[54]:
where CERgt is the annual carbon absorption (tCO2eq), CF is the annual carbon absorption factor per unit area under different scenarios (kgCO2eq/m2), and S is the implementation area of the carbon sink technology (m2).
RESULTS
Carbon emissions scenario forecast analysis
According to the carbon emissions forecasts under different scenarios [Table 3 and Figure 2], the results show that under BAU, carbon emissions in the CBD of Qingpu New Town show an increasing trend in the planning timeframe. By 2040, total carbon emissions are projected to reach 23.82 × 10⁴ tCO2eq, with a carbon emission intensity of 0.38 × 10⁴ tCO2eq/104 CNY. This indicates that continuing the current development model will lead to sustained emission growth, further intensifying the conflict between economic expansion and resource-environmental constraints. Under GD, the carbon emission peak occurs the latest (in 2035) and at a relatively high level. This outcome suggests that relying solely on conventional carbon reduction measures delays peaking and results in greater cumulative emissions. BD lies between BAU and GD, reflecting the stage-by-stage balance between economic growth and emission reduction. Compared with BAU, emissions in 2040 are 22.9% lower under GD and 28.8% lower under BD, demonstrating the limited effectiveness of incremental emission reduction pathways. HQD emphasizes economic development driven by a strong shift toward clean energy. It achieves a high-quality, low-level carbon peak in 2028, with a significant reduction in peak emissions compared with BAU. By 2040, total emissions under HQD decrease by 47.3% compared with BAU, with an emission intensity of only
Scenario forecasting results (P50)
| Scenario | Peak year | Carbon emission peak (104 tCO2eq) | 2040 carbon emissions (104 tCO2eq) | 2040 carbon emission intensity (tCO2eq/104 CNY) |
| BAU | / | / | 23.82 | 0.38 |
| GD | 2035 | 18.73 | 18.36 | 0.29 |
| BD | 2034 | 17.26 | 16.96 | 0.25 |
| HQD | 2028 | 15.44 | 12.55 | 0.18 |
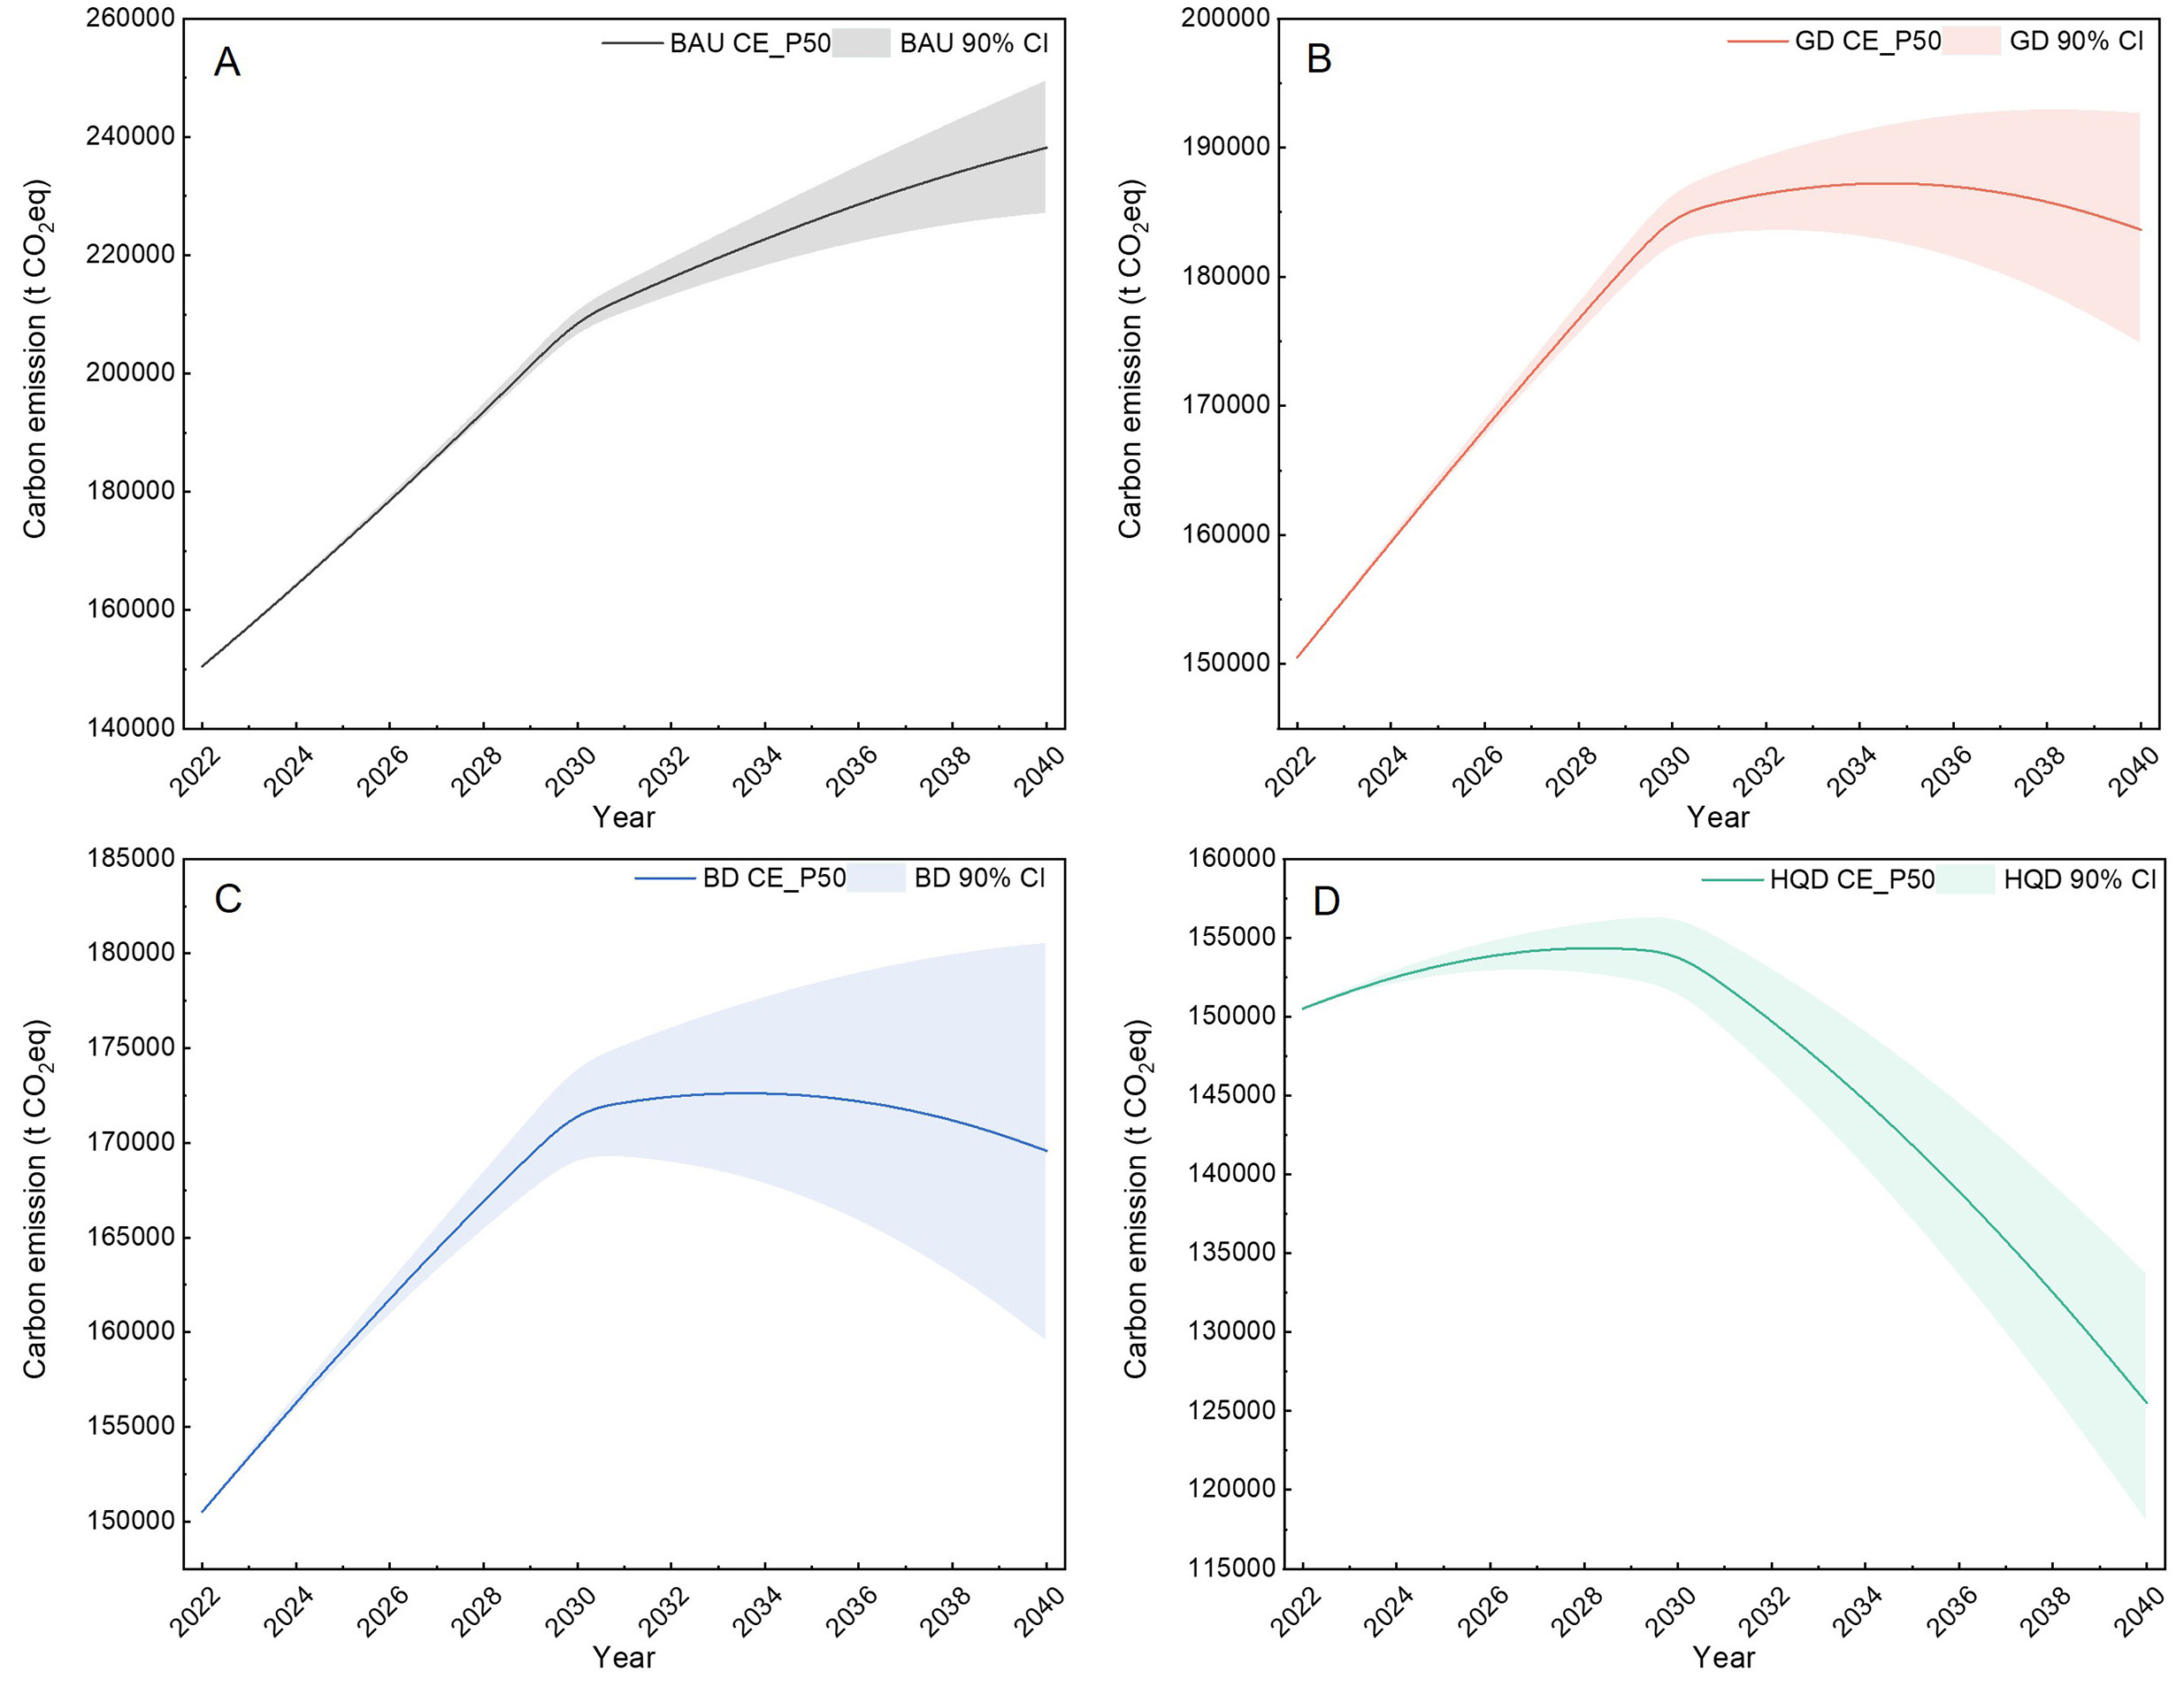
Figure 2. Carbon emission forecast trends in the CBD of Qingpu New Town. (A) BAU, (B) GD, (C) BD, (D) HQD. CBD: Central business district; BAU: business-as-usual; GD: general development; BD: balanced development; HQD: high-quality development.
The HQD scenario is selected as an illustrative case for further analysis. Parameter settings are presented in Supplementary Table 8. Based on the OAT sensitivity results [Figure 3], the signs of parameter effects align with theoretical expectations. In the near term, changes in the EFe and PRE are the most influential drivers of CBD emissions, while variations in EGDP and g exert moderate effects. Over the long term, the influence of
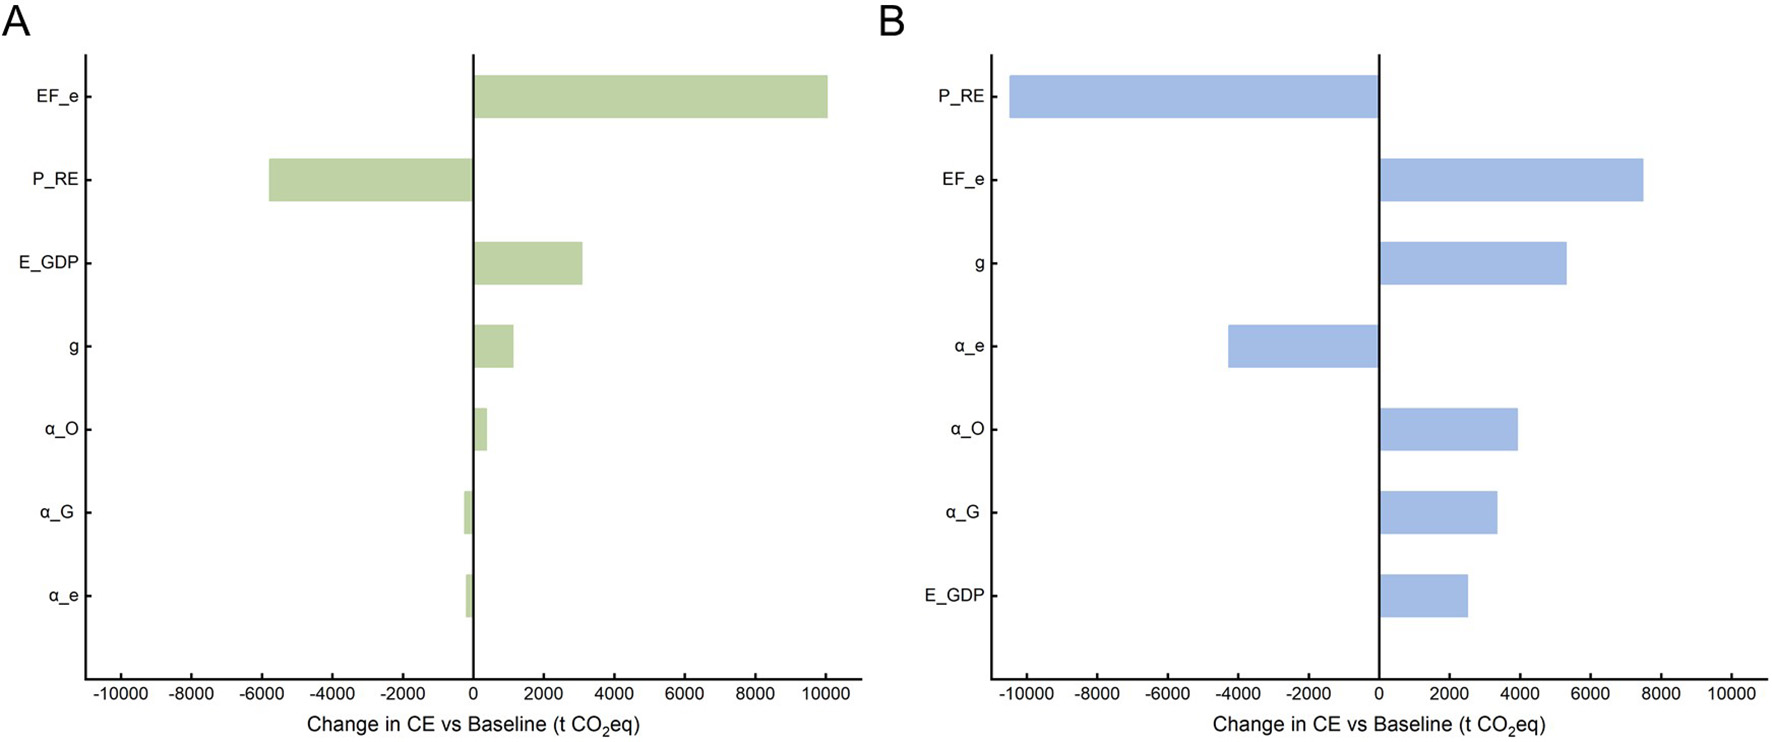
Figure 3. Sensitivity analysis. (A) Absolute changes in emissions in 2030. (B) Absolute changes in emissions in 2040. P_RE: Share of renewable energy in total electricity consumption; EF_e: carbon emission factor for electricity; g: GDP growth rate; α_e: proportion of electricity in total energy consumption; α_O: proportion of gasoline in total energy consumption; α_G: proportion of natural gas in total energy consumption; E_GDP: energy consumption per 10,000 CNY of GDP.
Using BAU as the baseline for 2040, the emission reductions under GD, BD, and HQD from 2022 to 2040 are calculated to estimate the carbon reduction potential of the CBD in Qingpu New Town. If GD measures are adopted, the carbon reduction potential will reach 54,500 tCO2eq by 2040. Under BD, more stringent measures will lead to a reduction of 68,600 tCO2eq, while the HQD will achieve a reduction of
Analysis of multi-scenario source-sink integration technological pathways
To quantitatively assess the contribution of various low-carbon technologies under different development scenarios, this study calculates the emission reduction potential of a comprehensive set of Source-Sink Integration technologies for the Qingpu New Town CBD by the year 2040, as shown in Figure 4A. The evaluation includes three scenarios: GD, BD, and HQD, with total technology-driven emission reductions reaching 59,467 tCO2eq, 72,038 tCO2eq, and 77,547 tCO2eq, respectively.
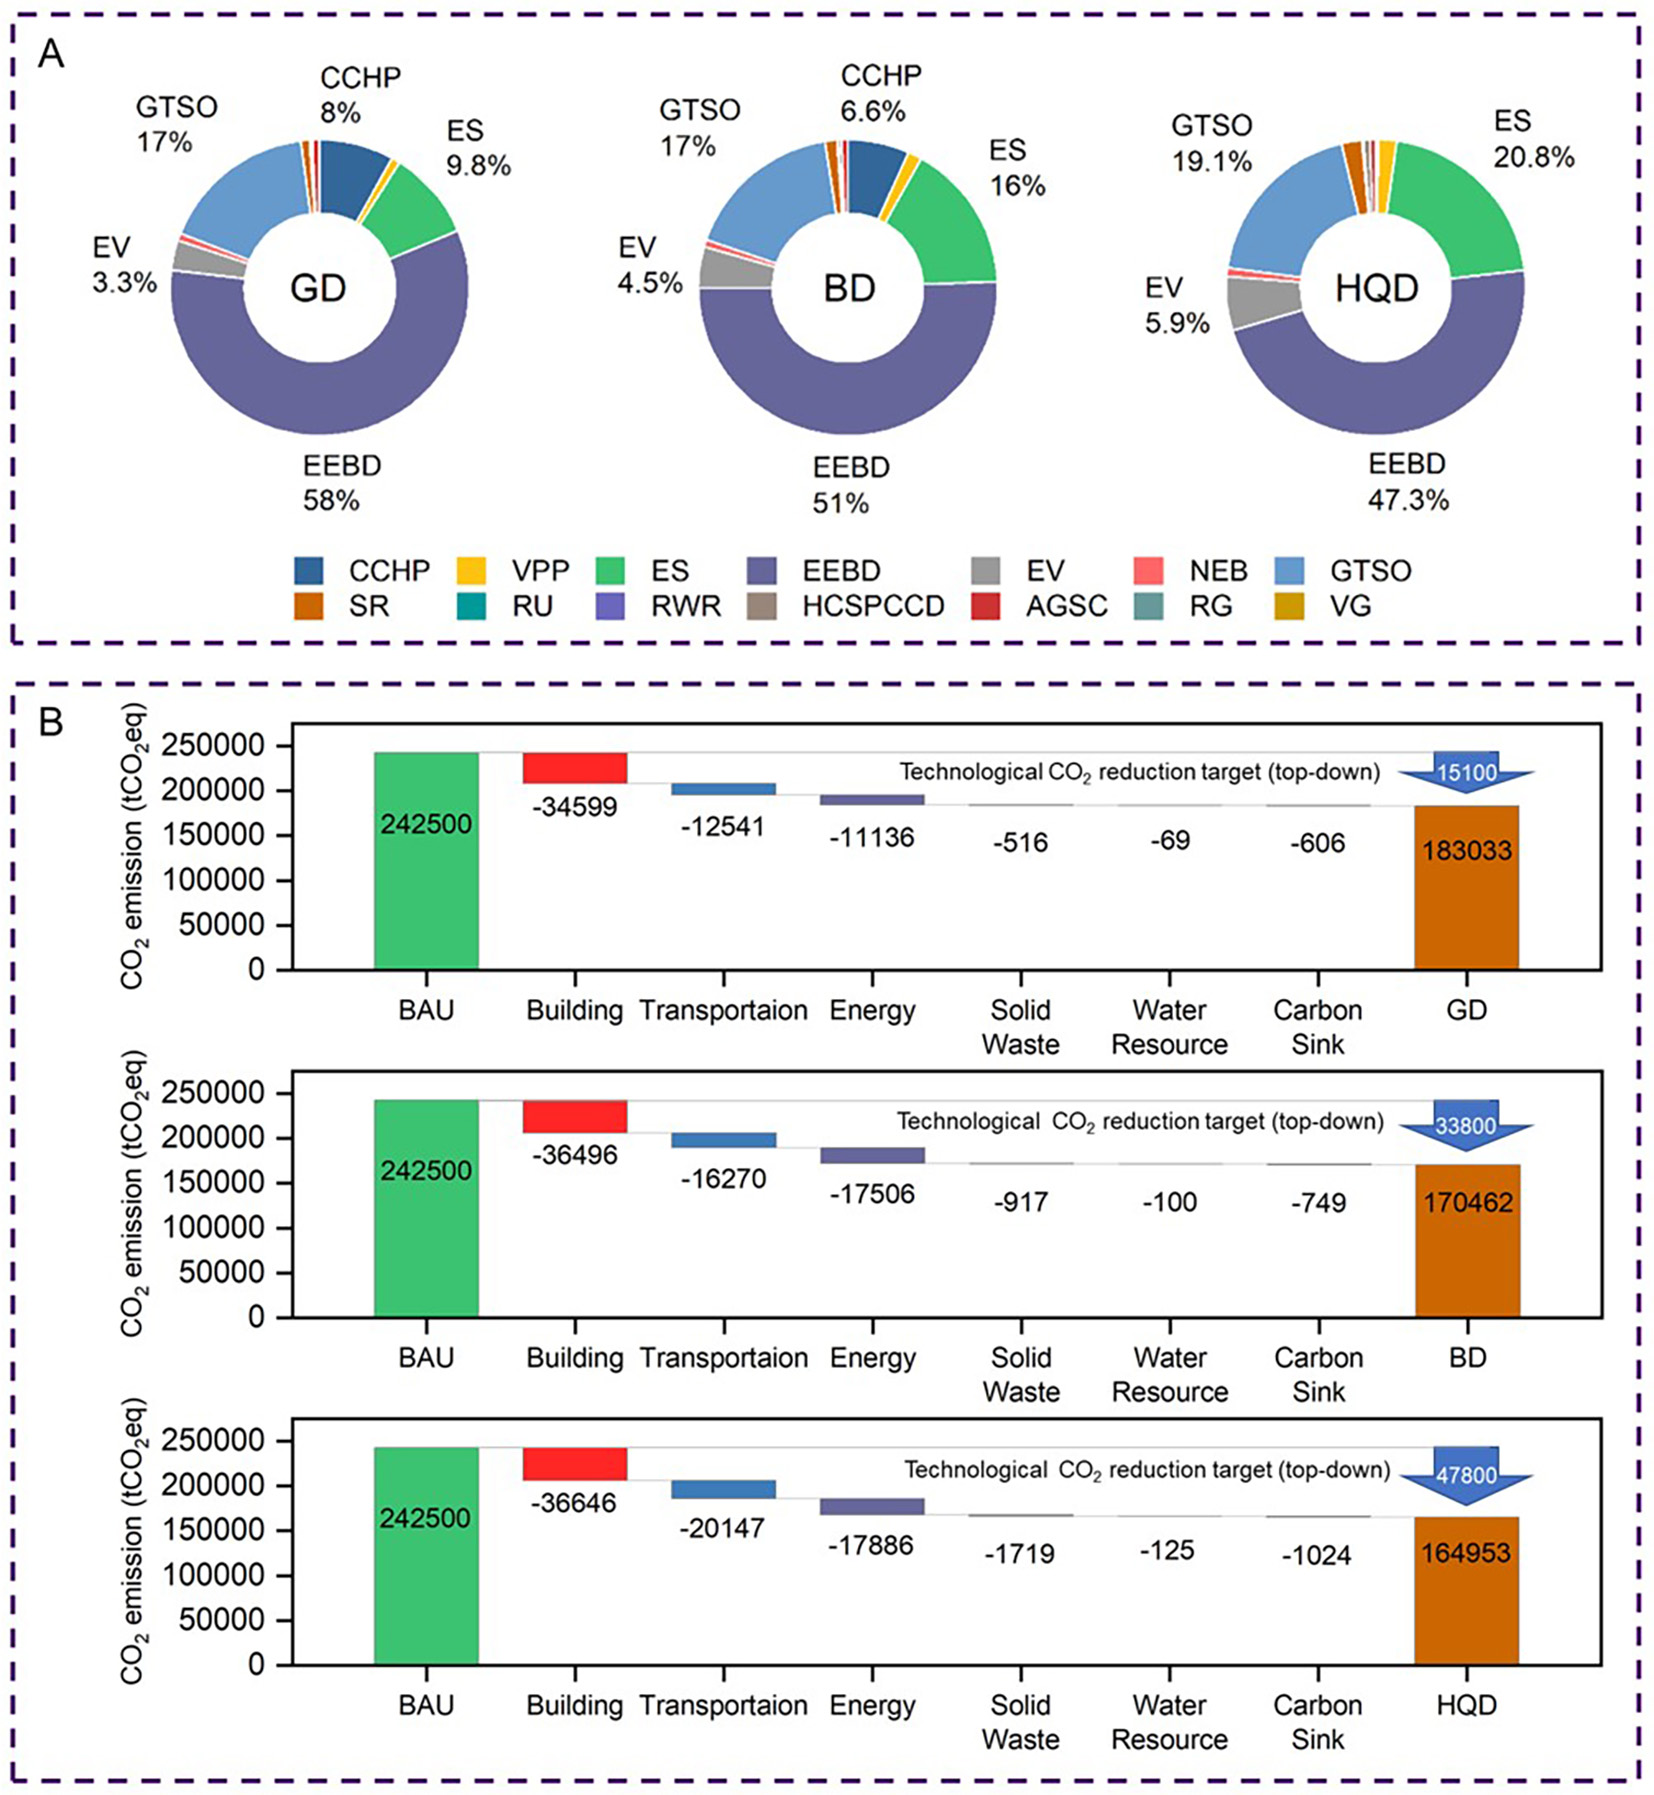
Figure 4. Carbon Emission Reduction potential of a comprehensive set of Source-Sink Integration technologies. (A) Proportion of Carbon Reduction from Technologies under Different Scenarios in 2040. (B) Comparison of 2040 Technology Portfolios with Scenario Simulation Results. BAU: Business-as-usual; GD: general development; BD: balanced development; HQD: high-quality development; CCHP: combined cooling, heating and power; VPP: virtual power plant; ES: energy storage; EEBD: energy-efficient building design; EC: electric car; NEB: new energy bus; GTSO: green travel structure optimization; SR: source-sorted recycling; RU: rainwater utilization; RWR: reclaimed water reuse; HCSPCCD: high carbon sink plant combinations and community design; AGSC: affiliated green space construction; RG: rooftop greening; VG: vertical greening.
Under all scenarios, building-related technologies emerge as the dominant contributors to emission reduction. Energy-efficient building design alone accounts for approximately 34,599 tCO2eq (GB),
Overall, this analysis underscores the importance of integrating multiple technological pathways to meet scenario-specific carbon reduction targets, as shown in Figure 4B. While energy-efficient building design remains the backbone of the carbon reduction technological strategy, scalable improvements in energy, transportation, and carbon sink are essential to achieving a comprehensive and resilient low-carbon CBD by 2040.
DISCUSSION
The scenario analysis clearly shows that operational emissions in the CBD are jointly driven by macroeconomic demand scale and the pace of power-sector decarbonization. Relative to BAU, the GD, BD, and HQD scenarios exhibit progressively greater efficiency gains and cleaner power penetration, yielding earlier and lower peaks. Among these, HQD achieves earlier peaking and larger reductions under higher clean-power targets and steadier intensity improvements. Monte Carlo draws around target-year anchors indicate that uncertainty bands are narrower when targets are coherent with the base year and policy bounds are clear, but widen markedly when anchors are more ambitious or weakly constrained - highlighting the decisive influence of policy implementation tempo and external clean-power supply on scenario realization. OAT results indicate that in the short term, EFe and PRE dominate CBD emissions, while EGDP and g have moderate influence. In the long run, the effect of PRE grows stronger, whereas changes in fossil fuel shares show only minor impacts.
Comparing technology pathways with scenario targets suggests that building energy efficiency constitutes the foundational abatement wedge; distributed resources, storage, and flexibility provide system-level support; travel-mode shifts and electrification deliver steady long-run gains; and solid waste, water systems, and carbon sinks offer complementary contributions. Under HQD, the scenario-specific technology bundle can match and even exceed the required “technical abatement” gap, indicating that coordinated source-grid-load-storage-mobility strategies combining “strong efficiency + high clean-power share + demand-side management” can deliver substantial reductions without compromising development quality.
Limitations and future directions
This analysis is primarily district-scale and top-down, so it only partially captures intra-sector heterogeneity, rebound effects, and endogenous feedbacks along technology-adoption paths. The S-curve identification strategy favors interpretability and may be conservative under shocks or structural breaks. Although we quantify parameter uncertainty using OAT and Monte Carlo sampling, structural uncertainty warrants deeper treatment. Data constraints, particularly the lack of systematic building-level energy records and other high-resolution inputs, may underrepresent spatial and structural variability within the CBD. In addition, the absence of material ledgers, process parameters, and end-of-life pathways prevents the inclusion of Life Cycle Assessment (LCA) at this stage. Future research could move toward single-building resolution via sub-metering and digital twins, assemble a Life Cycle Inventory and implement hybrid LCA, and couple this framework with bottom-up engineering models to better reflect sectoral heterogeneity and system feedbacks - thereby improving robustness and policy relevance under uncertainty.
Policy implications
To promote the low-carbon transition of the CBD, multi-scenario carbon emission simulations should be systematically embedded into urban planning and evaluation systems. This would enable the early assessment of carbon impacts under different development pathways, thereby supporting informed and scientific decision-making. Meanwhile, a coordinated incentive mechanism based on the integration of “technology-scenarios-benefits” should be established to foster the deep integration of low-carbon technologies into specific application contexts and to strengthen the quantifiable evaluation and dynamic feedback of emission reduction outcomes. At the regional level, a cross-departmental coordination mechanism is needed to break down sectoral silos, promote resource integration and data sharing, and build a unified and efficient joint regulatory system. On this basis, diversified policy tools, such as fiscal subsidies, carbon points, green credit, and credit evaluation, should be employed to incentivize active participation from the public, enterprises, and social organizations, thereby building a collaborative governance model that provides strong support for green, low-carbon, and high-quality CBD development.
At the operational level, it is recommended that all CBD projects submit a concise Carbon Impact Statement (CIS) that tests several “what-if” scenarios and ensures compliance with two conditions: (1) the project fits within the CBD’s overall carbon budget; and (2) it meets basic fairness criteria. Responsibilities are kept simple: the Planning Department incorporates the CIS into permitting procedures, the Environmental Bureau oversees Measurement, Reporting, and Verification (MRV) and enforcement, the Finance Bureau manages the Equity Retrofit Fund (ERF) and green finance, utilities upgrade the grid and share data, and Energy Service Companies (ESCOs) conduct retrofit work under standardized performance contracts. Results should be published regularly, and adjustments made through a rapid Plan-Do-Check-Act cycle.
To safeguard fairness, public infrastructure is financed through city budgets and green bonds, while building retrofits are repaid through shared-savings contracts with ESCOs or via on-bill repayment mechanisms. The ERF should prioritize higher levels of grants and credit guarantees for low-income groups and Small and Medium Enterprises (SMEs). An affordability index should be adopted to ensure repayment capacity, while rent-protection rules should prevent landlords from passing costs to tenants without corresponding benefits. The CBD management committee should further support SMEs through bulk procurement, a one-stop help desk, tiered compliance pathways, and green lease mechanisms that fairly distribute verified savings between landlords and tenants. In this way, CBD decarbonization can achieve efficiency, fairness, and sustainability simultaneously. Stakeholder Participation Matrix is shown in Table 4.
Stakeholder participation matrix
| Who | What they do | Their tools |
| Planning Bureau | Put CIS into permits; apply the two-gate rule | Permit conditions; CIS checklist |
| Environment Bureau | Set standards; do MRV; enforce compliance | Codes, audits, public disclosure |
| Finance Bureau | Run ERF; arrange green finance | Grants/rebates, guarantees, green bonds |
| Utilities | Provide enabling infrastructure & data | Grid upgrades, connection terms, open data |
| CBD Committee | Orchestrate and help SMEs | Bulk buying; one-stop technical assistance; vendor lists |
| ESCOs/Developers | Deliver retrofits end-to-end | Shared-savings & on-bill contracts |
| Owners & Tenants (including SMEs) | Join programs; sign green leases | Green lease templates; technical assistance kits |
| Community/Low-income groups | Co-design protections; give feedback | ERF grants; rent safeguards |
CONCLUSION
CBDs hold particular significance due to their high energy consumption, densely built environments, and concentrated carbon emissions. While they are frequently viewed as engines of economic growth, CBDs also represent hotspots for carbon intensity, rendering them critical targets for emission reduction strategies. Based on the current development and planning goals of Qingpu New Town CBD, this study constructed four carbon emission scenarios - BAU, GD, BD, and HQD - and conducted a top-down simulation and carbon reduction potential assessment for 2022-2040. The results indicate that under BAU, emissions continue to rise without reaching a peak, highlighting the unsustainability of traditional development models. In contrast, GD and BD show progressively earlier and lower emission peaks, while HQD peaks in 2028 and achieves a 47.3% reduction in total emissions and a 52.6% decline in carbon intensity compared with BAU by 2040. OAT analysis shows that in the near term, EFe and PRE are the primary determinants of CBD emissions, with EGDP and g exerting secondary effects. Over the longer term, the role of PRE becomes increasingly significant, while adjustments in fossil fuel shares contribute only marginally. After excluding the external effects of grid decarbonization, the 2040 technology-based carbon reduction targets for GD, BD, and HQD are calculated at 15,100, 33,800, and 47,800 tCO2eq, respectively.
A systematic assessment of sectoral carbon reduction potentials was conducted across six key areas: buildings, energy, transport, solid waste, water resources, and carbon sinks. Energy-efficient building design emerges as the dominant contributor, with a maximum share of 58.2% among all scenarios. The energy system exhibits a transition toward storage-led and smart-grid solutions, with storage technologies contributing up to 20.8% in HQD. In the transport sector, decarbonization is driven by electric vehicle adoption and optimization of urban mobility patterns. Solid waste and water-related carbon reductions rely on improved recycling and reuse efficiencies. Carbon sink strategies focus on vertical greening and high carbon sequestration plant communities. By 2040, the total technological carbon reduction potentials for GD, BD, and HQD reach 59,500, 72,000, and 77,500 tCO2eq, respectively, all aligning with their scenario-based emission reduction targets. These findings demonstrate the feasibility and policy relevance of a multi-scenario low-carbon transition pathway for CBDs.
DECLARATIONS
Authors’ contributions
Conceptualization, methodology: Wang, L.; Guo, R.; Li, A.; Peng, K.; Xu, C.; Jing, X.; Zhang, Y.; Liu, J.; Chen, B.; Ma, T.; Huang, X.
Data curation, writing - original draft, formal analysis: Wang, L.; Li, A.; Xu, C.; Jing, X.; Zhang, Y.
Funding acquisition, supervision: Guo, R.; Peng, K.; Liu, J.; Chen, B.; Ma, T.; Huang, X.
Validation: Wang, L.; Guo, R.; Li, A.; Peng, K.; Xu, C.; Jing, X.; Zhang, Y.
Visualization: Wang, L.; Wu, H.; Cai, A.
Writing - review & editing: Wang, L.; Guo, R.; Li, A.; Peng, K.; Shi, X.
Availability of data and materials
The data that support the findings of this study are available from the corresponding author upon reasonable request.
Financial support and sponsorship
This work was supported by the National Natural Science Foundation of China (4237011166), the Science and Technology Innovation Plan of Shanghai Science and Technology Commission (22DZ1209500), and the project “The Special Planning and Construction Guidelines Project for Near-Zero Carbon in the Central Business District of Qingpu New Town”.
Conflicts of interest
Xu, C. and Chen, B. are affiliated with Shanghai Tongji Urban Planning & Design Institute Co., Ltd., while the other authors have declared that they have no conflicts of interest.
Ethical approval and consent to participate
Not applicable.
Consent for publication
Not applicable.
Copyright
© The Author(s) 2025.
Supplementary Materials
REFERENCES
1. Du, L.; Li, X.; Zhao, H.; Ma, W.; Jiang, P. System dynamic modeling of urban carbon emissions based on the regional National Economy and Social Development Plan: a case study of Shanghai city. J. Clean. Prod. 2018, 172, 1501-13.
2. Gu, S.; Fu, B.; Thriveni, T.; Fujita, T.; Ahn, J. W. Coupled LMDI and system dynamics model for estimating urban CO2 emission mitigation potential in Shanghai, China. J. Clean. Prod. 2019, 240, 118034.
3. Dhakal, S. GHG emissions from urbanization and opportunities for urban carbon mitigation. Curr. Opin. Environ. Sustain. 2010, 2, 277-83.
4. Intergovernmental Panel on Climate Change (IPCC). Urban Systems and other settlements. In: Climate Change 2022 - Mitigation of Climate Change. Cambridge University Press; 2023. pp. 861-952.
5. National Development and Reform Commission (NDRC). Working guidance for carbon dioxide peaking and carbon neutrality in full and faithful implementation of the new development philosophy; 2021. Available from: https://en.ndrc.gov.cn/policies/202110/t20211024_1300725.html [Last accessed on 28 Oct 2025].
6. Wang, C.; Xu, L.; Zheng, X.; Hua, Y.; He, T.; Xue, X. Carbon emission estimation at the urban functional zone scale: integrating multi-source data and machine learning approach. 2024.
7. Säynäjoki, E.; Inkeri, V.; Heinonen, J.; Junnila, S. How central business district developments facilitate environmental sustainability - A multiple case study in Finland. Cities 2014, 41, 101-13.
8. Intergovernmental Panel on Climate Change. Chapter 12 - Human settlements, infrastructure, and spatial planning. In: Climate Change 2014: Mitigation of Climate Change. Cambridge University Press; 2015. pp. 923-1000.
9. Creutzig, F.; Agoston, P.; Minx, J. C.; et al. Urban infrastructure choices structure climate solutions. Nat. Clim. Chang. 2016, 6, 1054-6.
10. Kennedy, C.; Steinberger, J.; Gasson, B.; et al. Greenhouse gas emissions from global cities. Environ. Sci. Technol. 2009, 43, 7297-302.
11. Ramaswami, A.; Hillman, T.; Janson, B.; Reiner, M.; Thomas, G. A demand-centered, hybrid life-cycle methodology for city-scale greenhouse gas inventories. Environ. Sci. Technol. 2008, 42, 6455-61.
12. Xu, D.; Zhang, Y.; Li, D.; Han, H.; Wang, R.; Wang, T. Low-carbon evaluation system for Central Business Districts in China. Jones Lang LaSalle Report. 2023. Available from: https://app.jingsocial.com/microFrontend/leadGeneration/jsf-leads/list/contentMarketing/RHijixWnvs8XToQsoUH4Ce/xPs2r5moArqP9DZoqYNgoG [Last accessed on 31 Oct 2025].
13. Hong, T.; Lee, S. H.; Zhang, W.; Sun, K.; Hooper, B.; Kim, J. Nexus of electrification and energy efficiency retrofit of commercial buildings at the district scale. Sustain. Cities. Soc. 2023, 95, 104608.
14. Yin, L.; Sharifi, A.; Liqiao, H.; Jinyu, C. Urban carbon accounting: an overview. Urban. Clim. 2022, 44, 101195.
15. Thio, E.; Tan, M.; Li, L.; et al. The estimation of influencing factors for carbon emissions based on EKC hypothesis and STIRPAT model: evidence from top 10 countries. Environ. Dev. Sustain. 2022, 24, 11226-59.
16. Zhang, N.; Yu, K.; Chen, Z. How does urbanization affect carbon dioxide emissions? A cross-country panel data analysis. Energy. Policy. 2017, 107, 678-87.
17. Hung, C. C.; Hsu, S.; Cheng, K. Quantifying city-scale carbon emissions of the construction sector based on multi-regional input-output analysis. Resour. Conserv. Recy. 2019, 149, 75-85.
18. Chen, Q.; Su, M.; Meng, F.; et al. Analysis of urban carbon metabolism characteristics based on provincial input-output tables. J. Environ. Manag. 2020, 265, 110561.
19. Wiedmann, T. C.; Wilting, H.; Lenzen, M.; Lutter, S.; Palm, V. Quo Vadis MRIO? Methodological, data and institutional requirements for multi-region input-output analysis. Ecol. Econ. 2011, 70, 1937-45.
20. Fu, Z.; Zhang, Y.; He, S.; Wang, H.; Jiang, X.; Wang, S. Multi-objective programming for economy-energy-environment system and policy mix with dual constraints of carbon emission and water consumption based on multi-scenario analysis. Energy. Rep. 2022, 8, 7884-91.
21. Li, G.; Zhou, H.; Kang, J.; Shen, N.; Zhong, H.; Xu, S. Optimising urban office block morphologies with photovoltaic system integration: an energy-environment-economic evaluation under climate change scenarios. Energy. Build. 2025, 330, 115318.
22. Guan, D.; Peters, G. P.; Weber, C. L.; Hubacek, K. Journey to world top emitter: an analysis of the driving forces of China's recent CO2 emissions surge. Geophys. Res. Lett. 2009, 36, 2008GL036540.
23. Davis, S. J.; Caldeira, K. Consumption-based accounting of CO2 emissions. Proc. Natl. Acad. Sci. USA. 2010, 107, 5687-92.
24. Grubler, A.; Wilson, C.; Bento, N.; et al. A low energy demand scenario for meeting the 1.5 °C target and sustainable development goals without negative emission technologies. Nat. Energy. 2018, 3, 515-27.
25. Lou, Y.; Ye, Y.; Yang, Y.; Zuo, W. Long-term carbon emission reduction potential of building retrofits with dynamically changing electricity emission factors. Build. Environ. 2022, 210, 108683.
26. Xiong, L.; Wang, M.; Mao, J.; Huang, B. A review of building carbon emission accounting methods under low-carbon building background. Buildings 2024, 14, 777.
27. ürge-Vorsatz, D.; Danny, Harvey. L. D.; Mirasgedis, S.; Levine, M. D. Mitigating CO2 emissions from energy use in the world's buildings. Build. Res. Inf. 2007, 35, 379-98.
28. Guerrieri, M.; La, Gennusa. M.; Peri, G.; Rizzo, G.; Scaccianoce, G. University campuses as small-scale models of cities: quantitative assessment of a low carbon transition path. Renew. Sustain. Energy. Rev. 2019, 113, 109263.
29. Tan, X.; Tu, T.; Gu, B.; Zeng, Y. Scenario simulation of CO2 emissions from light-duty passenger vehicles under land use-transport planning: a case of Shenzhen International Low Carbon City. Sustain. Cities. Soc. 2021, 75, 103266.
30. Zhang, Y.; Cao, Y.; Chen, T.; Lucchi, E. Optimized community-level distributed photovoltaic generation (DPVG): aesthetic, technical, economic, and environmental assessment of building integrated photovoltaic (BIPV) systems. J. Build. Eng. 2025, 103, 112085.
31. Wu, W.; Chou, S.; Viswanathan, K. Optimal dispatching of smart hybrid energy systems for addressing a low-carbon community. Energies 2023, 16, 3698.
32. Zhang, Z.; Mu, X.; Tu, C.; Sun, Z.; Hu, G. Hierarchical network planning of distributed renewable energy in a net-zero energy community. Clean. Technol. Environ. Policy. 2023, 25, 1643-58.
33. Valencia, A.; Hossain, M. U.; Chang, N. Building energy retrofit simulation for exploring decarbonization pathways in a community-scale food-energy-water-waste nexus. Sustain. Cities. Soc. 2022, 87, 104173.
34. Feng, Y.; Fang, C.; Jia, X.; et al. Dual pathways of carbon neutrality in urban green spaces: assessment and regulatory strategies. Sustain. Cities. Soc. 2025, 125, 106311.
35. Yang, B.; Lee, D. Urban Green space arrangement for an optimal landscape planning strategy for runoff reduction. Land 2021, 10, 897.
36. Chhipi-shrestha, G.; Hewage, K.; Sadiq, R. Impacts of neighborhood densification on water-energy-carbon nexus: Investigating water distribution and residential landscaping system. J. Clean. Prod. 2017, 156, 786-95.
37. Newman, P. W. Sustainability and cities: extending the metabolism model. Lands. Urban. Plan. 1999, 44, 219-26.
38. Zhou, Y.; Fang, W.; Li, M.; Liu, W. Exploring the impacts of a low-carbon policy instrument: a case of carbon tax on transportation in China. Resour. Conserv. Recy. 2018, 139, 307-14.
39. Nowak, D. J.; Crane, D. E. Carbon storage and sequestration by urban trees in the USA. Environ. Pollut. 2002, 116, 381-9.
40. Sorrell, S. Jevons’ Paradox revisited: The evidence for backfire from improved energy efficiency. Energy. Policy. 2009, 37, 1456-69.
41. Rivera-Marín, A.; Alfonso-Solar, D.; Vargas-Salgado, C.; Català-Mortes, S. Methodology for estimating the decarbonization potential at the neighborhood level in an urban area: application to La Carrasca in Valencia city - Spain. J. Clean. Prod. 2023, 417, 138087.
42. Pulselli, R. M.; Marchi, M.; Neri, E.; Marchettini, N.; Bastianoni, S. Carbon accounting framework for decarbonisation of European city neighbourhoods. J. Clean. Prod. 2019, 208, 850-68.
43. Thebuwena, A. C. H. J.; Samarakoon, S. M. S. M. K.; Ratnayake, R. M. C. Optimization of energy consumption in vertical mobility systems of high-rise office buildings: a case study from a developing economy. Energy. Efficiency. 2024, 17, 10246.
44. Farizal, F.; Noviandri, M. A.; Hamdani, H. Sustainability development through a nearly zero energy building implementation case: an office building in South Jakarta. Sustainability 2024, 16, 7027.
45. Noor, M. A.; Ashrafi, S.; Fattah, M. A.; Morshed, S. R.; Rahman, S. Assessment of traffic congestion scenario at the CBD areas in a developing city: In the context of Khulna City, Bangladesh. Transp. Res. Interdiscip. Perspect. 2021, 11, 100435.
46. Shiftan, Y.; Kaplan, S.; Hakkert, S. Scenario building as a tool for planning a sustainable transportation system. Trans. Res. Part. D. 2003, 8, 323-42.
47. C40 Cities. Climate action planning framework; 2018. Available from: https://www.c40knowledgehub.org/s/article/Climate-Action-Planning-Framework?language=en_US [Last accessed on 28 Oct 2025].
48. Bai, X.; Dawson, R. J.; Ürge-Vorsatz, D.; et al. Six research priorities for cities and climate change. Nature 2018, 555, 23-5.
49. Ma, X.; Yang, J.; Sun, D.; Zhang, R.; Xiao, X.; Xia, J. Fine allocation of sectoral carbon emissions at block scale and contribution of functional zones. Ecol. Inf. 2023, 78, 102293.
50. Zhang, Y.; Guo, R.; Peng, K.; et al. Carbon-neutrality-transformation pathway in ecoregions: an empirical study of Chongming district, Shanghai, China. Water. Energy. Nexus. 2024, 7, 200-12.
51. Goodchild, M. F.; Lam, N. S. N. Areal interpolation: a variant of the traditional spatial problem. Geo-Processing 1980, 1, 297-312. Available from: https://asu.elsevierpure.com/en/publications/areal-interpolation-a-variant-of-the-traditional-spatial-problem/?utm_source=chatgpt.com [Last accessed on 31 Oct 2025].
53. National Information Center of China. Mid- and long-term goals, strategies and pathways for China's economic and social development. 2020. Available from: https://www.efchina.org/Attachments/Report/report-lceg-20210207-4/%E4%B8%AD%E5%9B%BD%E7%BB%8F%E6%B5%8E%E7%A4%BE%E4%BC%9A%E5%8F%91%E5%B1%95%E7%9A%84%E4%B8%AD%E9%95%BF%E6%9C%9F%E7%9B%AE%E6%A0%87-%E6%88%98%E7%95%A5%E4%B8%8E%E8%B7%AF%E5%BE%84.pdf [Last accessed on 31 Oct 2025].
54. Sun, J. Methodology of integrated planning toward urban block-level carbon reduction. Urban. Plan. Forum. 2022, 6, 102-109.
55. Kong, X.; Wang, Z.; Liu, C.; Zhang, D.; Gao, H. Refined peak shaving potential assessment and differentiated decision-making method for user load in virtual power plants. Appl. Energy. 2023, 334, 120609.
56. Pimm, A. J.; Palczewski, J.; Barbour, E. R.; Cockerill, T. T. Using electricity storage to reduce greenhouse gas emissions. Appl. Energy. 2021, 282, 116199.
Cite This Article
How to Cite
Download Citation
Export Citation File:
Type of Import
Tips on Downloading Citation
Citation Manager File Format
Type of Import
Direct Import: When the Direct Import option is selected (the default state), a dialogue box will give you the option to Save or Open the downloaded citation data. Choosing Open will either launch your citation manager or give you a choice of applications with which to use the metadata. The Save option saves the file locally for later use.
Indirect Import: When the Indirect Import option is selected, the metadata is displayed and may be copied and pasted as needed.
About This Article
Copyright

Data & Comments
Data
0


Comments
Comments must be written in English. Spam, offensive content, impersonation, and private information will not be permitted. If any comment is reported and identified as inappropriate content by OAE staff, the comment will be removed without notice. If you have any queries or need any help, please contact us at support@oaepublish.com.