

Achieving urban synergistic governance of carbon, air pollution, solid waste, and water resources: lessons from 289 cities in China
 0
0 Abstract
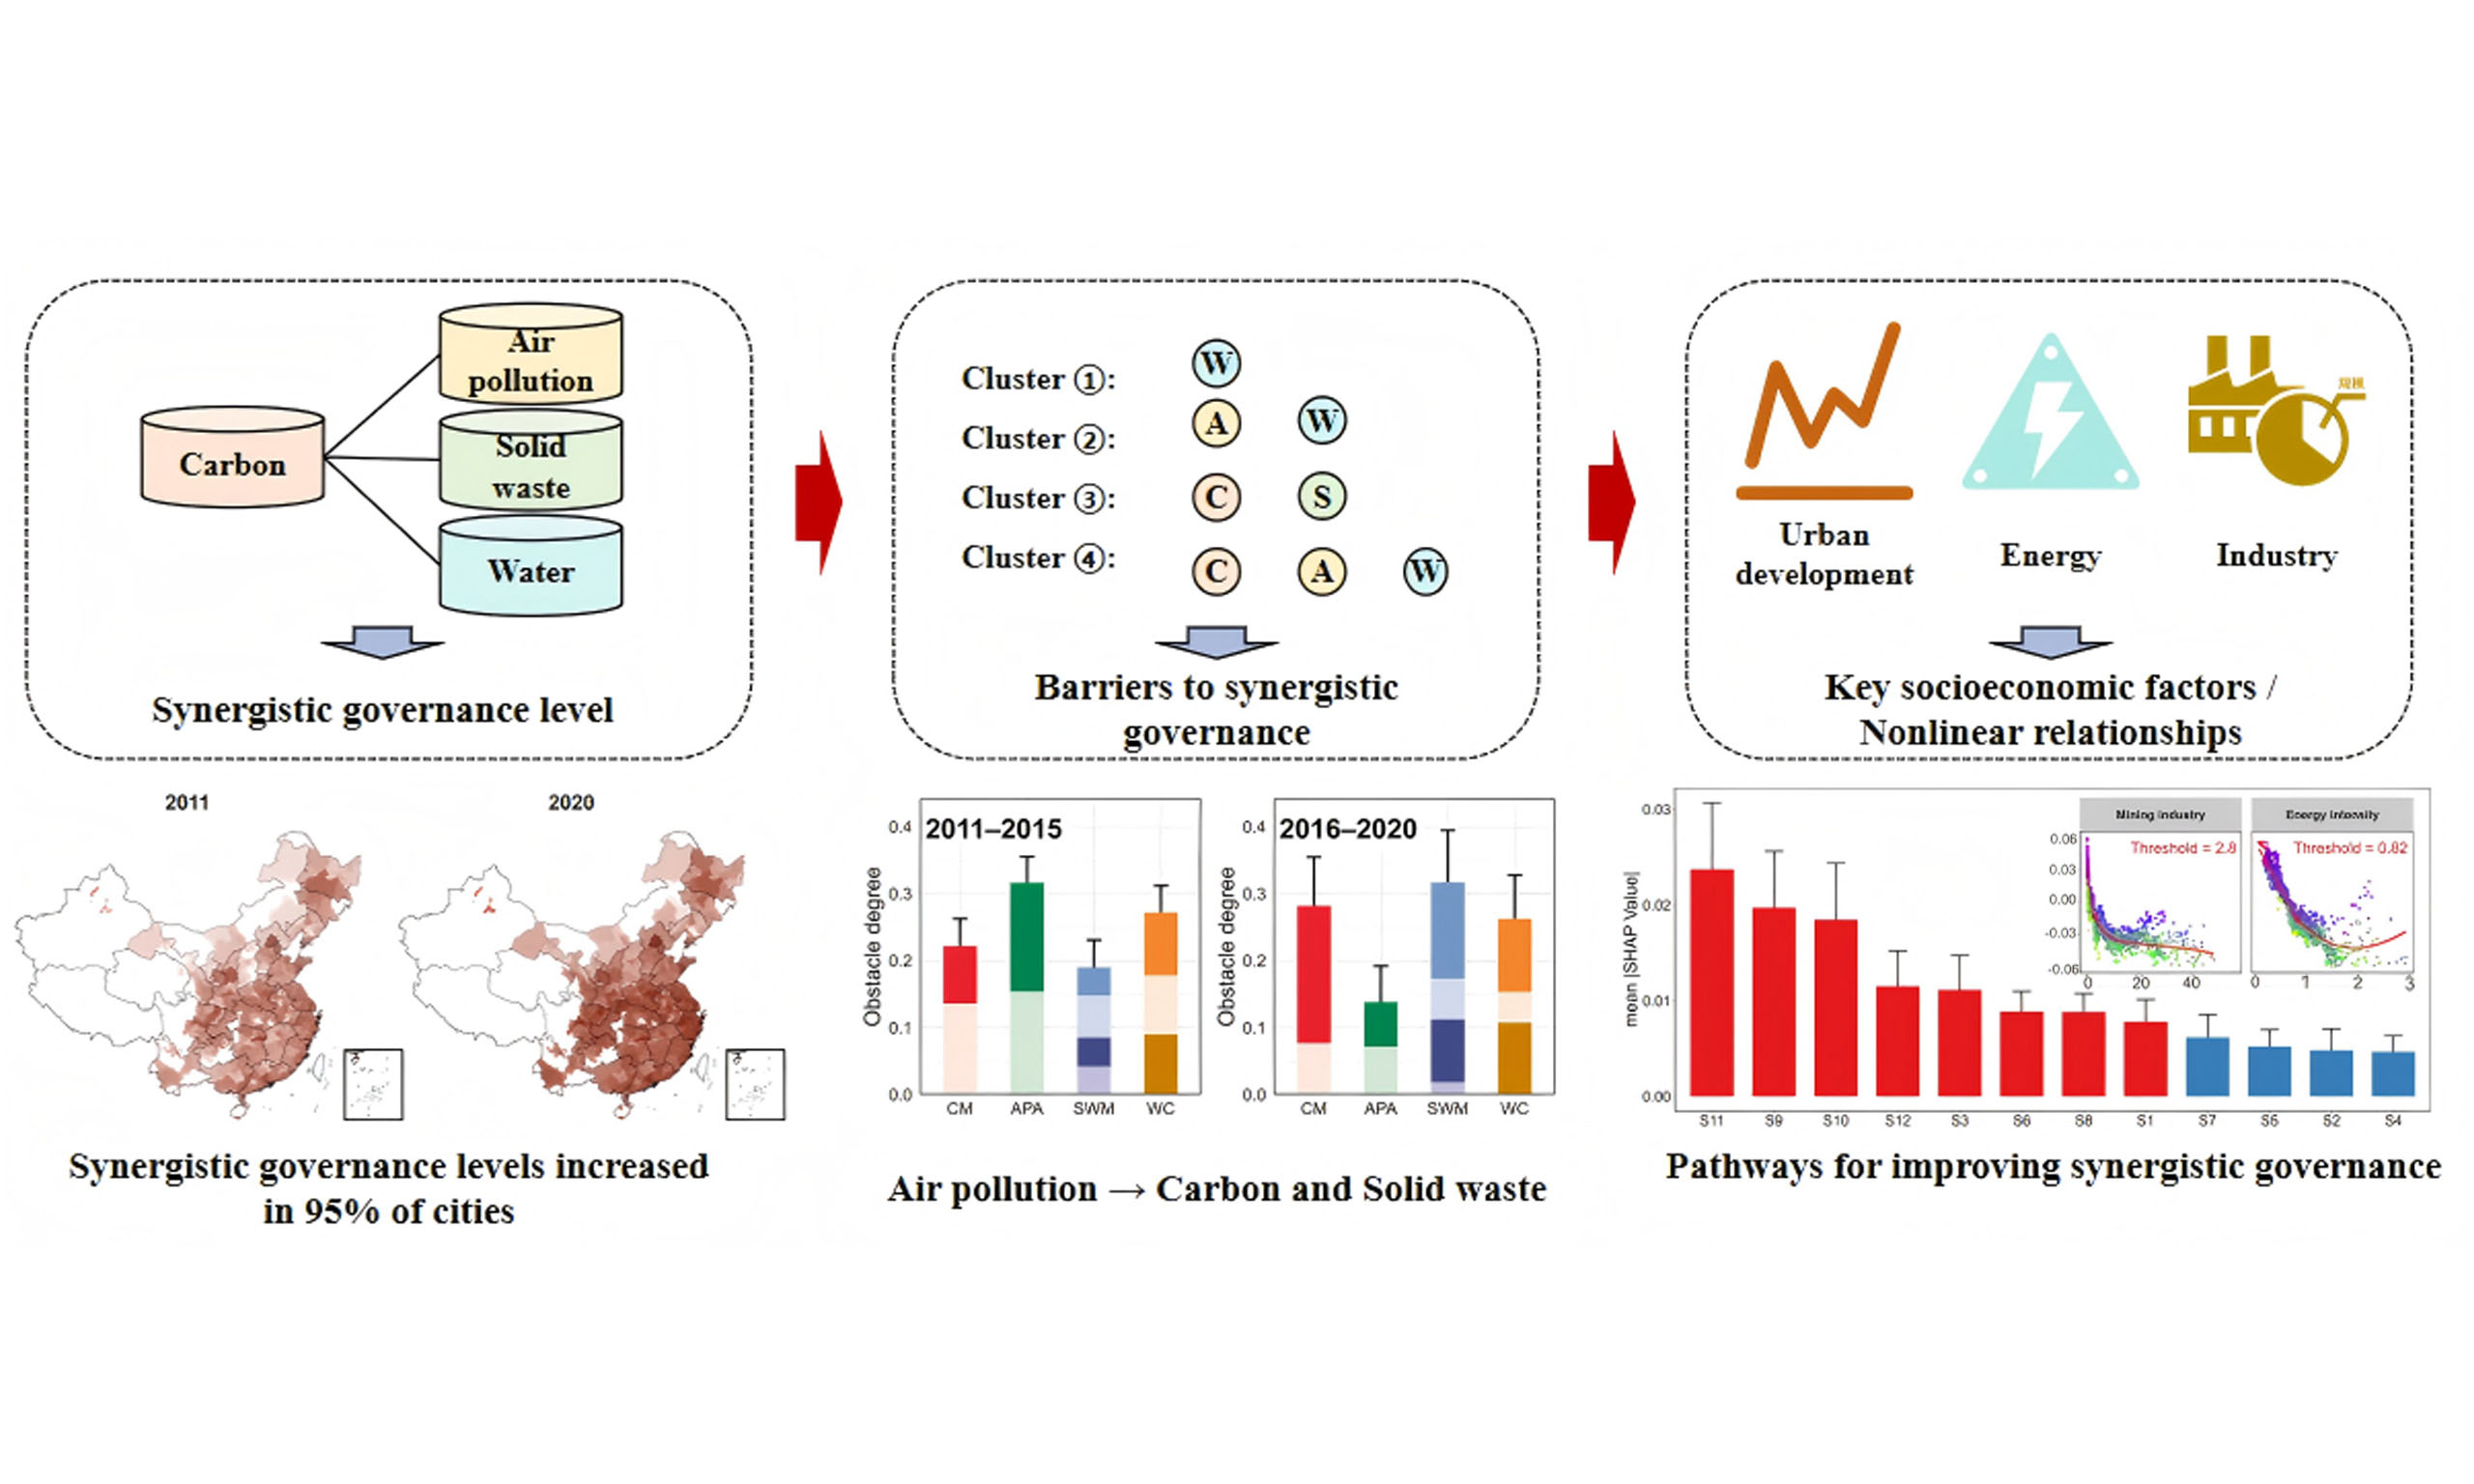
Amid China’s “dual-carbon” goals and mounting environmental pressures, cross-sector synergy is essential for sustainable urban development. We develop an integrated assessment framework to evaluate synergistic governance across four subsystems - carbon mitigation, air-pollution abatement, solid-waste management, and water conservation - for 289 prefecture-level cities during 2011-2020. An obstacle degree model diagnoses which subsystems constrain overall synergy, while a machine-learning random forest model interpreted with Shapley Additive Explanations (SHAP) values quantifies the relative importance and nonlinear effects of twelve socioeconomic drivers. Results indicate broad improvements in synergistic level across most cities, with marked gains in air-pollution control and water conservation driving overall progress. In contrast, only moderate advances in carbon mitigation and high volatility in solid-waste management emerge as the principal barriers to further improvement. Spatial heterogeneity is pronounced: major urban agglomerations generally outperform other areas, with Pearl River Delta, Yangtze River Delta, and Chengdu-Chongqing (Chengyu) exhibiting strong cross-system improvement, whereas Central-Southern Liaoning and the Guanzhong Plain face persistent structural constraints. Machine-learning diagnostics further highlight energy intensity, energy structure, and the dominance of mining and electricity-supply sectors as top predictors of city-level synergistic performance, showing clear threshold effects. Based on these findings, we offer targeted and region-specific policy pathways to accelerate coordinated environmental governance across China’s leading urban agglomerations.
Keywords
INTRODUCTION
Unlike many high-income countries that have largely completed conventional pollution control and are now prioritizing decarbonization, China must advance air-pollution abatement (APA) and carbon mitigation (CM) in parallel[1,2]. Emissions remain elevated under a coal-dominated energy system, particularly in energy-intensive industries such as steel, cement, and chemicals[3,4]. Although air quality has improved, PM2.5 pollution and ozone exceedances persist in parts of the country, especially across major urban agglomerations and industrial belts[5,6]. Meanwhile, rapid urbanization and industrial expansion continue to increase solid-waste burdens and strain water resources, with some regions facing chronic scarcity and pronounced spatial mismatches between supply and demand[7,8]. Meeting the objectives of a Beautiful China and the “dual carbon” strategy therefore requires an integrated approach that tackles these pressures simultaneously while safeguarding long-term, sustainable development[9,10].
The large spatial overlap and shared sources of major air pollutants and greenhouse gases make joint control a practical route to greener growth[11,12]. Yet in China, responsibilities for carbon, air pollution, solid waste, and water are spread across multiple agencies, often with overlapping mandates and siloed data and accountability systems[13,14]. This institutional fragmentation can weaken policy effectiveness and create unintended trade-offs - for instance, some decarbonization measures increase water demand or solid-waste burdens[15,16]. What is needed is a governance framework that evaluates coordination across these domains, pinpoints cross-agency bottlenecks, and provides evidence to improve collaboration and performance[17]. Given wide regional differences in development, industrial structure, and scale, policy packages also need to be place-specific, with priority on high-impact sectors where coordination gains are largest[18-20]. A growing literature has begun to assess such synergies, estimate the joint effects of policies on carbon and environmental outcomes, and project pathways under alternative governance scenarios using indicator systems, econometric designs, and integrated modeling[21-23].
However, most existing work has concentrated on carbon-air synergies (e.g., with SO2 and PM2.5), and has paid less attention to how climate action interacts with other environmental pressures[24-26]. Recent evidence points to substantial links with solid-waste management (SWM) and water conservation (WC) as well[27,28]. For example, using input-output analysis, Zhao et al.[29] show a tight association between urban water use and carbon emissions and identify priority sectors for coordinated water-carbon management. At the same time, some mitigation options can create new trade-offs[30,31]. Rapid deployment of wind and solar may affect land use, increase local water stress, and generate end-of-life waste from panels and turbines if recycling and disposal systems lag behind[32]. Together, these findings argue for extending synergy analysis beyond carbon and air pollution to a broader set of environmental domains.
Synergistic governance is also shaped by local socioeconomic conditions - energy mix, industrial structure, urbanization, and fiscal capacity - and these effects are often non-linear and region-dependent[33,34]. Yet most studies still lean on standard regressions or simple correlations, which have limited ability to model higher-order interactions and often break down under multicollinearity[35,36]. Full-sample estimates also tend to report average relationships, masking place-specific drivers and bottlenecks[7,37]. More flexible approaches that can capture non-linearity and heterogeneity are therefore needed to clarify how socioeconomic factors influence synergies, trade-offs, and coordination across multiple environmental goals.
Most studies also work at national or provincial scales, which can mask large differences in city-level capacity and constraints[38-40]. City-level research has grown, but it often evaluates the effects of individual policies rather than diagnosing the underlying barriers that limit coordination across environmental goals[41-44]. In practice, co-governance is frequently organized around urban agglomerations, where economic linkages, shared infrastructure, and cross-boundary spillovers tie cities together[45,46]. Evaluating performance at the city level - while explicitly situating cities within these agglomerations - helps reveal heterogeneity, identify common bottlenecks, and track recurring development paths[47-49]. This provides a clearer empirical basis for tailoring co-governance strategies to the socioeconomic conditions of different regions.
To overcome current gaps in spatial resolution, mechanism diagnosis, and analytical tools - and to inform more targeted pollution and carbon-reduction practice in China - this study develops an indicator system covering four domains: climate change, air pollution, solid waste, and water resources. Using entropy weighting, we evaluate environmental governance performance for 289 cities and ten major urban agglomerations from 2011 to 2020. We then apply the Coupling Coordination Degree (CCD) model to quantify synergy across the four subsystems, and use a barrier-degree model to identify the main constraints on improvement and track how they change over time. To capture non-linear patterns, we use a Random Forest (RF) model to characterize the associations between 12 socioeconomic variables and synergistic performance, and to rank variables by their predictive importance. Finally, we propose differentiated optimization pathways based on cities’ development stages and industrial structures.
This study addresses three questions: (1) How has synergistic environmental governance changed over time across China’s prefecture-level cities and major urban agglomerations? (2) Which constraints most limit synergy in different cities, and how have these barriers shifted over time? (3) What socioeconomic factors are most strongly associated with synergistic performance across cities, and how can city-type-specific improvement pathways be designed accordingly?
METHODS
Assessment of absolute governance level of subsystems
In this study, the absolute level of environmental governance refers to cities’ observed performance in four subsystems: CM, APA, SWM, and WC. We construct a corresponding indicator system [Table 1]. Although the “dual-carbon” agenda has encouraged a gradual shift toward dual control of total carbon emissions and carbon intensity, implementation still largely follows the long-standing framework of dual control of total energy use and energy intensity, and an explicit, binding cap on total carbon emissions has not been fully established[17,50]. In addition, because most Chinese cities have not yet peaked in carbon emissions, water use, or solid-waste generation, total-volume measures alone do not adequately reflect governance progress[51,52]. Per-capita and intensity-based indicators are better suited to capture improvements relative to population size or economic activity[53]. We therefore use both per-capita and intensity measures to assess performance across the four subsystems.
Indicator framework and weighting scheme for environmental subsystems
| Subsystems | Indicators | Calculation method | Weights |
| Carbon mitigation | Per capita carbon emissions | Total carbon emissions/Number of resident populations | 0.49 |
| Carbon emission intensity | Total carbon emissions/GDP | 0.51 | |
| air-pollution abatement | SO2 emission intensity | Total SO2 emissions/GDP | 0.51 |
| Industrial dust emission intensity | Total industrial dust emissions/GDP | 0.49 | |
| Solid-waste management | Per capita domestic waste removal volume | Domestic waste removal volume/Number of resident populations | 0.30 |
| Industrial solid waste emission intensity | Total industrial solid waste emissions/GDP | 0.40 | |
| Comprehensive utilization rate of industrial solid waste | Industrial solid waste comprehensively utilized/Industrial solid waste generated | 0.15 | |
| Harmless treatment rate of municipal solid waste | Municipal solid waste harmlessly treated/Municipal solid waste collected and transported | 0.15 | |
| Water conservation | Per capita water consumption | Total water consumption/Number of resident populations | 0.28 |
| Water consumption intensity | Total water consumption/GDP | 0.29 | |
| Share of groundwater in total water use | Groundwater use/Total water use | 0.43 |
Specifically, CM is measured using per-capita carbon emissions and carbon intensity. APA is proxied by the emission intensities of sulfur dioxide and industrial dust, consistent with prior studies[54,55]. For SWM, we cover both household and industrial sources using per-capita municipal waste removal and industrial solid-waste emission intensity, and further add two treatment indicators - the comprehensive utilization rate of industrial solid waste and the harmless treatment rate of municipal solid waste - to capture recycling and disposal capacity. For WC, we focus on water stress using per-capita water use and water use per unit of Gross Domestic Product (GDP), and additionally include the share of groundwater in total water use to reflect pressure on groundwater supplies.
To address differences in indicator dimensions and units and ensure the comparability of evaluation results, this study standardizes the raw data using the extreme value method[56]. For a positive indicator, the normalized value is calculated as
whereas for a negative indicator, it is calculated as
Here, i denotes the city ( i = 1, 2, …, n), and j indicates the indicator (j = 1, 2, …, m). Xij epresents the original value of the j-th indicator for city i, and Zij epresents the corresponding normalized value. The terms max(Xij) and min(Xij) denote the maximum and minimum values of indicator j across all cities, respectively. After normalization, all indicator values are rescaled to the interval [0, 1].
Subsequently, the entropy weighting method was applied to assign weights based on the degree of variation across indicators[57]. The calculation proceeds as follows:
where n represents the number of cities and m indicates the number of indicators. pᵢj is the proportion of the standardized value of city i under indicator j relative to the sum of standardized values for all cities. ej denotes the information entropy of indicator j, and wj is the corresponding weight [Table 1]. Finally, the linear weighting method is used to calculate the absolute governance level of each city's environmental subsystem[58].
Evaluation of synergistic governance level among subsystems
The CCD comprises two components: the coupling degree (C) and the development degree (T)[59]. C reflects the dynamic interdependence among subsystems during the governance process, while T indicates the overall progress achieved across all subsystems[60], as given by
where C represents the degree of coupling, reflecting the strength of interaction among the subsystems during the governance process. Ucarbon, Uair, Usolid and Uwater denote the absolute governance levels of CM, APA, SWM, and WC, respectively.
where T represents the degree of development, indicating the overall progress of all subsystems’ absolute governance levels and reflecting the quality of synergistic governance. α1, α2, α3, and α4 are the weighting coefficients for the four subsystems - CM, APA, SWM, and WC. This study assumes equal importance for each subsystem, setting all coefficients to 1/4. The final CCD score, calculated using
reflects the overall level of synergistic governance across the four domains: the higher the CCD value, the stronger the synergy among the subsystems and the greater the overall progress.
Identifying barriers to synergistic governance
By calculating the obstacle degree of each indicator, the analysis highlights major environmental weaknesses and provides a basis for prioritizing future governance efforts[61]. Specifically, the obstacle degree of each indicator (ODj) to urban synergistic governance is calculated as:
where Fj represents the weight of indicator j in the overall synergistic governance evaluation system, calculated as the product of its weight wj within the subsystem and the subsystem’s weight coefficient (set as 1/4 for all four subsystems in this study). Zj denotes the deviation of the standardized value of indicator j from the optimal value of 1, computed as 1 minus the standardized score. m is the total number of indicators (in this study, m = 11). ODj represents the obstacle degree of indicator j, with larger values indicating a stronger constraint on a city’s synergistic governance.
It then aggregates the obstacle degree within each environmental subsystem to reflect its overall influence on the city’s synergistic governance performance. Subsystem-level obstacles are obtained by summing ODj across all indicators within the subsystem, which helps identify the main environmental bottlenecks to coordinated progress in pollution control and carbon reduction.
Building on this, the study applies the unsupervised K-means clustering algorithm to group cities based on the barrier characteristics of their four environmental subsystems - carbon emissions, air pollution, solid waste, and water resources. This classification divides cities nationwide into categories, each facing similar environmental challenges. To examine the temporal evolution of these barrier structures, the analysis is conducted separately for two periods (2011-2015 and 2016-2020), allowing comparison of key constraints and their changes over time.
The clustering is implemented using the “factoextra” package in R, with the optimal number of clusters (K) determined via the Gap Statistic method[62]. This involves generating uniformly distributed random samples equal in size to the original data using Monte Carlo simulation, performing repeated K-means clustering, and comparing the observed and reference loss functions[63]. The K value that maximizes the Gap statistic is selected as optimal. Results show that clustering performance is optimal at K = 4, suggesting that dividing cities into four categories yields the most meaningful distinctions. These findings help identify typical patterns of constraint and their trajectories in collaborative pollution and carbon reduction, offering a basis for targeted and differentiated policy design.
Analysis of socio-economic drivers of synergistic governance
This study uses the RF model to examine the socioeconomic correlates of multifactor synergistic environmental governance, with emphasis on variable importance and non-linear interactions[64,65]. The dependent variable is the CCD across the four subsystems, and the 12 predictors capture energy structure and intensity, industrial composition, and economic development
Twelve explanatory variables for synergistic governance level
| Categories | Corresponding indicators | Calculation method | Abbreviation |
| Urban development | Per capita GDP | GDP/Number of resident populations | S1 |
| Foreign capital utilization rate | Actual use of foreign capital/GDP | S2 | |
| Urbanization level | Urban population/Number of resident populations | S3 | |
| Fixed asset investment | Fixed asset investment/Local general public budget expenditure | S4 | |
| Government expenditure ratio | Local general public budget expenditure/GDP | S5 | |
| Industrial structure | Value added of tertiary industry/GDP | S6 | |
| Human capital level | Number of undergraduate students/Number of resident populations | S7 | |
| Science and technology level | Logarithm of number of granted patents | S8 | |
| Energy | Energy intensity | Total energy consumption/GDP | S9 |
| Energy structure | Coal consumption/Total energy consumption | S10 | |
| Polluting industries | Mining industry | Employment in mining/Urban employment | S11 |
| Power supply industry | Employment in power supply/Urban employment | S12 |
Model performance is assessed using 10-fold cross-validation. In this process, the data set is randomly divided into ten equal folds, nine folds are used for training while the remaining fold is used for testing[66]. This procedure is repeated ten times to ensure stability of the results. To balance accuracy and computational cost, the forest contains 500 trees with a maximum depth of six, which also limits overfitting[67]. Predictive accuracy and explanatory power are evaluated with root-mean-square error (RMSE), the coefficient of determination (R2), and mean absolute percentage error (MAPE). The models were implemented using the “randomForest” package in R (version 4.3.0).
After constructing the RF model, the study employed SHAP to evaluate the importance and directional contribution of each variable to the model's predictions. Higher SHAP values indicate a greater impact on the level of synergistic governance. The analysis was conducted using the “treeshap” package in R, which generated SHAP values for each explanatory variable across all city samples. By ranking variables based on their average SHAP values, the study identified the key influencing factors[68]. SHAP scatter plots were used to illustrate interactions between socio-economic factors and synergistic governance levels, with curves fitted using locally estimated scatterplot smoothing (LOESS) and shaded areas denoting the 95% confidence intervals.
In addition, we tested for threshold effects using segmented linear regression, where the SHAP value was regressed on the observed socio-economic variable with an unknown breakpoint estimated from the data. We assessed the statistical evidence for a structural change in slope using standard breakpoint tests and reported the estimated breakpoint with its confidence interval.
Robustness check
This study conducts three sets of checks and supplementary analyses to assess the robustness of indicator construction, policy effects, and the identification of associated factors.
First, we test the robustness of indicator construction along three dimensions. We vary indicator definitions by alternatively using per-capita measures and intensity measures across subsystems; we examine sensitivity to outliers by re-estimating results after trimming the top and bottom 1% and 5% of observations; and we compare weighting schemes by applying equal weights, entropy-based weights, and principal component analysis (PCA). Under each specification, we recompute subsystem-specific absolute governance scores and the overall synergistic governance index, and compare regional rankings and temporal trajectories.
Second, to examine whether the diagnosed obstacles are consistent with observed policy processes, we incorporate major environmental policies implemented during 2011-2020, including the Air Pollution Prevention and Control Action Plan, the carbon emissions trading scheme, and the “zero-waste city” initiative. A difference-in-differences (DID) design is employed, controlling for per-capita GDP, energy structure, and industrial structure, to evaluate the effects of these policies on subsystem governance outcomes and overall synergistic performance.
Third, recognizing potential endogeneity and spatial dependence in city-level panel data, we complement the RF analysis of nonlinear associations with panel regressions including city and year fixed effects, and further estimate spatial Durbin models to account for spatial spillovers and dependence. Consistency across models is used to strengthen confidence in the identification of key socioeconomic correlates. In all regression-based analyses, statistical significance is evaluated using two-sided t-tests. Robust standard errors are employed to account for potential heteroskedasticity, and in panel specifications, standard errors are clustered at the city level to address within-city serial correlation. Statistical significance is assessed at conventional levels (P < 0.05, P < 0.01, and P < 0.001).
RESULTS
Trends in absolute and synergistic governance across cities and major urban agglomerations
As shown in Supplementary Figure 1A-D and Supplementary Table 1, city-level governance in the APA and WC subsystems improved markedly during the study period. Across 289 cities in this study, 286 (99%) and 241 (83%) recorded positive growth in APA and WC, respectively, with the APA averaging a 97% increase. In contrast, CM and SWM saw improvements in 212 and 182 cities, yet average gains were only about 5%. In terms of synergistic governance, roughly 95% of cities achieved significant advances [Figure 1A], while only 15 cities in Northeast and Inner Mongolia declined. The number of cities achieving a high level of collaboration (CCD > 0.8) increased from one (Shenzhen) in 2011 to fourteen in 2020, indicating expansion beyond pilots but still limited in overall scale.
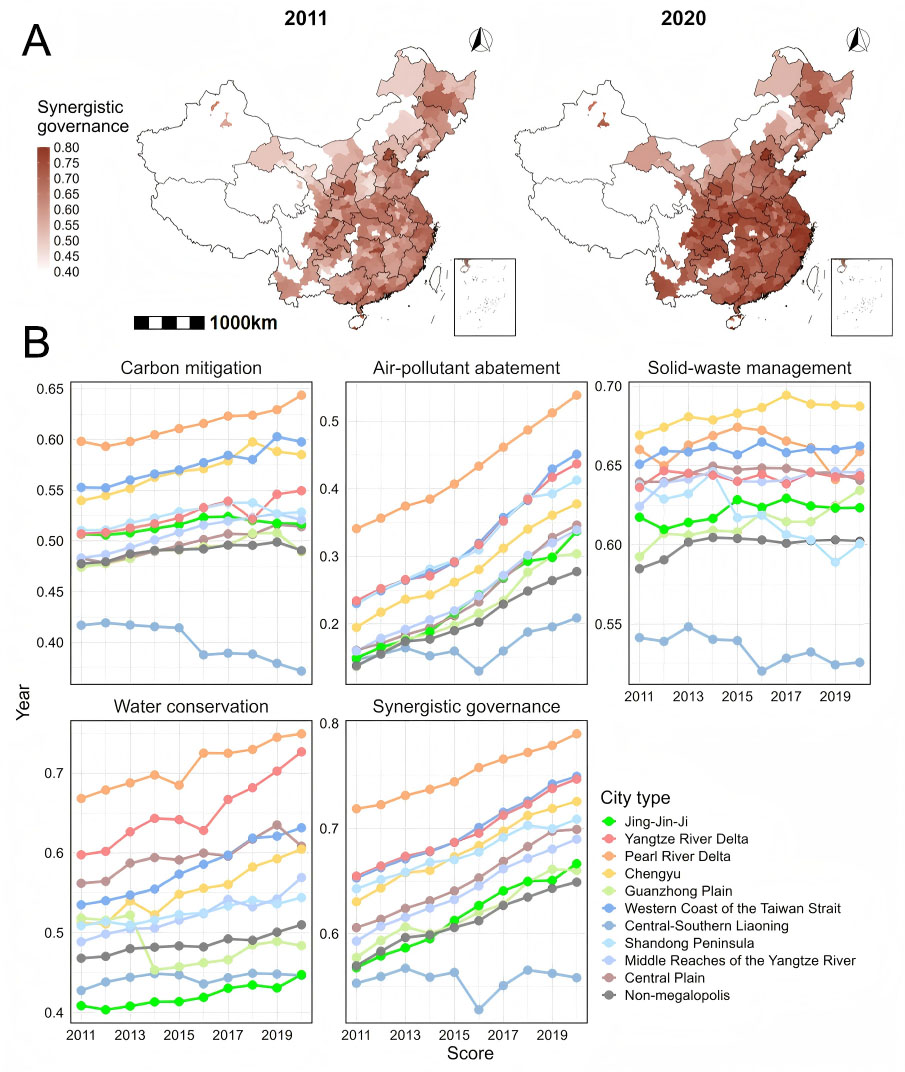
Figure 1. Absolute and synergistic governance across four subsystems at city and urban-agglomeration scales. (A) Comparison of city-level synergistic governance levels in 2011 and 2020. (B) Temporal evolution of subsystem-level absolute governance and overall synergistic governance across urban agglomerations. Score reflects the level of absolute and synergistic governance of an urban agglomeration across the four subsystems, calculated as the average of its constituent cities. A higher score indicates greater progress within that subsystem relative to other cities. The absolute governance levels are not directly comparable across different subsystems. The base map is from the Standard Map Service of the Ministry of Natural Resources of China (Approval No. GS(2019)1822), available at https://bzdt.ch.mnr.gov.cn/.
Spatial patterns show pronounced variation in environmental governance across cities. CM, APA, and SWM are generally stronger in the South - especially along the southeast coast - and weaker in the inland Northwest and parts of the Northeast. WC shows a different geography: performance is higher in the southeast coastal region and the Yangtze River Basin, consistent with higher water-use efficiency and lower reliance on groundwater extraction, but lower across many northern cities. Overall, synergistic governance is concentrated in the Southeast and remains relatively weak in the Northwest, the Northeast, and Shanxi.
To reduce intercity noise, we summarize results at the urban-agglomeration level. From 2011 to 2020, all ten major agglomerations improved in APA, with growth above 40%, consistent with intensified controls under the Air Pollution Prevention and Control Action Plan and the Blue-Sky Protection Campaign [Figure 1B and Supplementary Table 2]. CM and WC also increased, with over 90% of agglomerations rising by more than 5%, though carbon progress remained slower. In contrast, SWM improved little and unevenly, with marked declines in the Liaozhongnan and Shandong Peninsula agglomerations.
Regionally, cities within urban agglomerations generally show higher absolute environmental governance than those outside, reflecting stronger policy support, greater investment capacity, and spillovers from core cities. Among the leading agglomerations, the Pearl River Delta, Chengyu, the Yangtze River Delta, and the Western Coast of the Taiwan Strait perform strongly across all four subsystems, consistent with sustained industrial upgrading, larger shares of advanced manufacturing and modern services, and stronger fiscal and governance capacity.
By contrast, the Central-Southern Liaoning, Central Plains, and Guanzhong Plain agglomerations lag behind, largely due to continued reliance on heavy industry and fossil fuels and slower industrial transition. The Central-Southern Liaoning agglomeration is a notable case where path dependence in old industrial bases has coincided with worsening performance in CM and SWM in some cities, pulling down overall synergy. A clear core-periphery pattern is also evident in the Jing-Jin-Ji agglomeration: Beijing and Tianjin perform well across all four subsystems, while persistently high carbon intensity and pollution in Hebei constrain the agglomeration’s overall synergistic performance.
Main obstacles that constrain multi-factor synergistic governance
Figure 2A summarizes the obstacle-degree (OD) results for 2011-2015 and 2016-2020. In 2011-2015, APA (OD = 0.32) and WC (OD = 0.27) were the main constraints, whereas CM
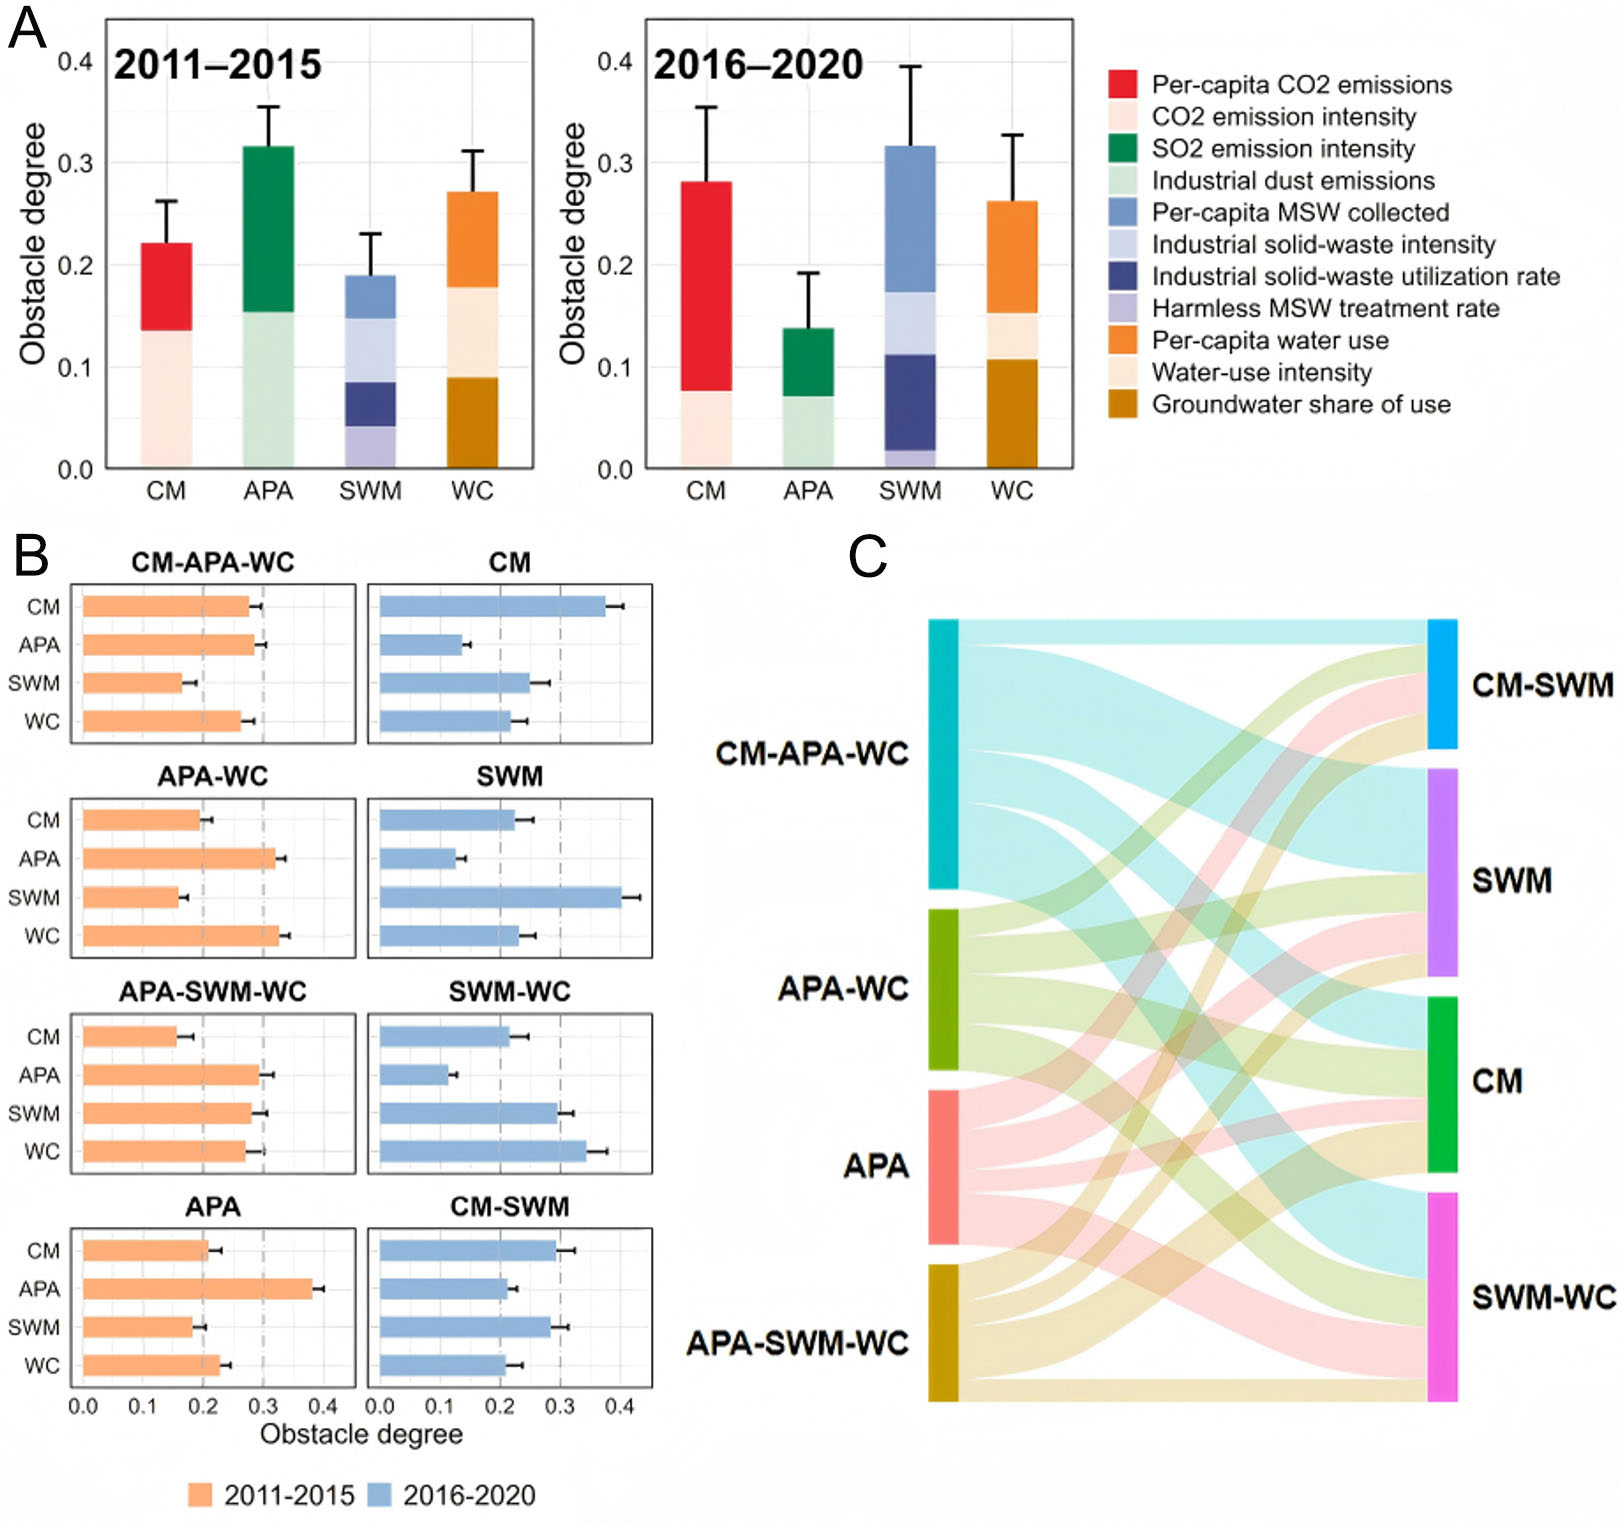
Figure 2. Identifying obstacles to the synergistic governance of cities and tracing their evolution. (A) National-level changes in subsystem obstacle degrees between 2011-2015 and 2016-2020. (B) Distribution of subsystem obstacle degrees across different barrier types in the two periods (left: 2011-2015, right: 2016-2020). (C) Transitions in dominant barrier types over time. Barrier types are denoted by subsystem initials. APA: Air-pollution abatement; CM: carbon mitigation; SWM: solid-waste management; WC: water conservation.
At the indicator level, the key constraint within the carbon-mitigation subsystem shifted over time: carbon intensity dominated in 2011-2015 (OD = 0.14), whereas per capita carbon emissions became the main barrier in 2016-2020 (OD = 0.20). A similar shift appeared in SWM. In 2011-2015, industrial solid waste posed a larger obstacle (OD = 0.06) than municipal solid waste (OD = 0.04); however, in 2016-2020, municipal solid waste became the dominant constraint (OD = 0.14), clearly exceeding industrial solid waste. Water-related constraints also evolved: in 2011-2015, the three water indicators contributed at comparable levels
Supplementary Figures 2 and 3 report the OD results for urban agglomerations in the two periods. Most agglomerations shifted from air pollution and water constraints in 2011-2015 to carbon emissions and solid-waste pressures in 2016-2020. The Pearl River Delta stands out early, facing severe carbon-mitigation pressure in the first phase, with per-capita carbon emissions overtaking carbon intensity as the main barrier. In 2016-2020, water constraints ease in many regions but remain prominent in Jing-Jin-Ji, Chengyu, and the Guanzhong Plain, alongside carbon and solid waste constraints. Central-Southern Liaoning remains constrained by both carbon intensity and water-use intensity.
To identify the dominant environmental problems facing each city in each period, we use K-means clustering to classify cities into four groups based on their OD profiles. Figure 2B shows the subsystem OD distributions for each group. Subsystems with obstacle degrees above 0.3 are treated as key constraints. In 2011-2015, cities were classified into four types: CM-APA-WC, APA-WC, APA, and APA-SWM-WC. In 2016-2020, the classification shifted to CM-SWM, SWM, CM, and SWM-WC.
Figure 2C illustrates the shift in cities’ dominant barrier types from 2011-2015 to 2016-2020. The most striking change is that APA is no longer the main binding constraint for most cities in the second phase. Instead, SWM becomes the most common obstacle, affecting 219 cities, and CM emerges as a major constraint for 122 cities. Transition patterns also vary across cities. Around 40 cities move from multi-constraint profiles in the first phase to more focused constraints in the second, with examples such as Shenzhen and Hangzhou shifting away from combined air-water pressures toward solid-waste constraints. In contrast, some cities experience the emergence of new dominant constraints as previous ones ease. For instance, in Shanghai and Guangzhou, air and water constraints weaken, but CM remains binding and solid-waste pressures become more prominent. In other cases, water constraints persist alongside rising solid-waste risks, as in Tangshan and Chengdu. Northwestern and northeastern cities such as Lanzhou and Anshan also show carbon-related constraints becoming more salient in the second phase as conventional pollution pressures recede.
Key socioeconomic factors that predict progress of synergistic governance
This study used the RF model with 12 socioeconomic variables to predict synergistic governance levels for 289 Chinese cities over 2011-2020, and evaluated performance using 10-fold cross-validation. As reported in Supplementary Figure 4 and Supplementary Table 3, RF outperformed conventional regression benchmarks, achieving an R2 of 0.823, a MAPE of 0.045, and an RMSE of 0.036. Overall, the model captures most variation in governance levels with low prediction error and limited large deviations.
To interpret the RF results, we use SHAP values to quantify each predictor’s contribution to the model output. Figure 3A shows mean absolute SHAP values for all 12 variables. Mining-industry share, energy intensity, and energy structure rank highest, each with mean |SHAP| above 0.015 and clearly larger than the others, indicating the strongest associations with predicted synergistic governance. The electricity-supply share, science and technology capacity, industrial structure, and urbanization also show notable importance, but at lower levels. These SHAP results reflect model-based associations rather than causal effects.
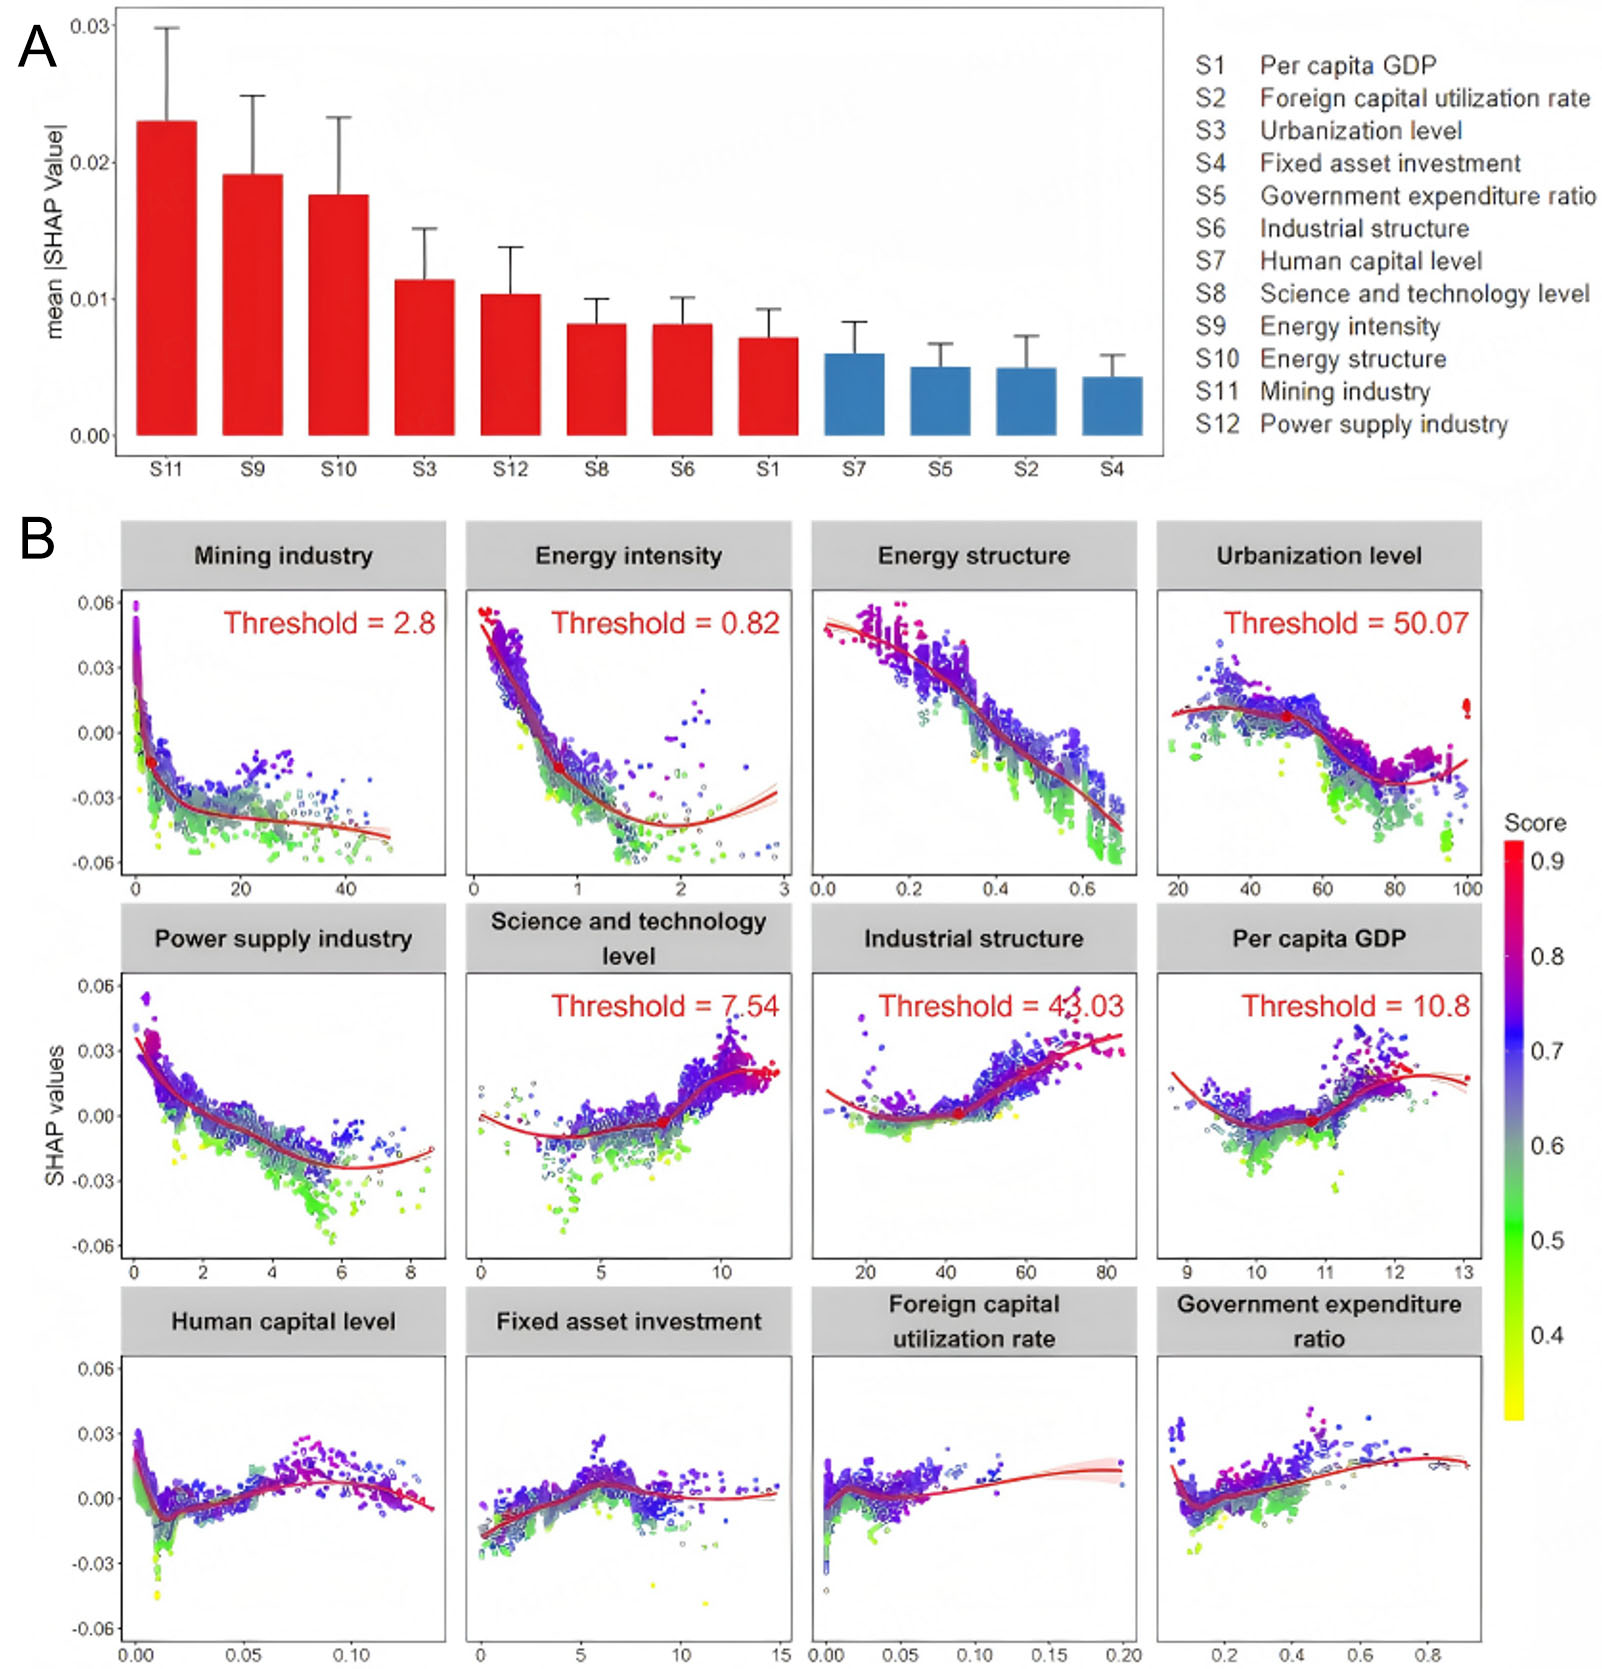
Figure 3. Contribution and nonlinear effects of socioeconomic variables on synergistic governance performance. (A) Mean SHAP value ranking of socioeconomic factors, where higher ranks indicate greater predictive importance. (B) Non-linear relationships between socioeconomic factors and synergistic governance, with point color indicating the level of synergistic governance. Curves are fitted using LOESS, and shaded areas denote the 95% confidence intervals.
Figure 3B illustrates the model-implied relationships between synergistic governance and key socioeconomic variables, revealing clear differences in both direction and functional form. Overall, energy intensity, energy structure, and employment shares in the mining and electricity-supply sectors are negatively associated with governance levels, whereas the tertiary-sector share and science and technology capacity show positive associations. Per-capita GDP is also positively associated, while urbanization is negatively associated. In contrast, human capital, foreign direct investment (FDI) share, fixed-asset investment, and government-expenditure share exhibit relatively weak or flat responses in the model.
Beyond these overall directions, the associations are strongly non-linear and vary across variables. Energy structure and employment in the electricity-supply sector display largely linear negative relationships across their ranges, with higher values consistently corresponding to lower predicted governance levels. Energy intensity and mining employment share, however, show a declining-flattening pattern: governance levels decrease sharply as these indicators rise from low to moderate levels; however, the slope weakens at higher values, indicating diminishing marginal associations once resource dependence becomes sufficiently high. Variables related to development and upgrading follow different trajectories. Science and technology level and urbanization show accelerating patterns, with relatively weak associations at low levels and stronger associations as values increase. Per-capita GDP exhibits a U-shaped pattern, with stronger positive associations emerging at higher income levels.
Threshold models help to summarize these non-linear patterns more explicitly [Supplementary Table 4]. For energy intensity (0.82 tce per 10,000 Chinese yuan (CNY)) and mining employment share (2.8%), the estimated thresholds fall within ranges typical of resource-dependent cities. Above these thresholds, further increases are associated with little additional variation in governance levels, whereas below them the negative association weakens and predicted performance improves more noticeably. In contrast, science and technology level (7.54), tertiary-sector share (43%), and per-capita GDP (49,200 CNY) show stronger positive associations only after crossing their respective thresholds. Urbanization also exhibits a breakpoint at 50%, beyond which its negative association with synergistic governance becomes more pronounced.
Robustness
Supplementary Figures 5-7 compare subsystem-specific absolute governance scores and the overall synergistic index under alternative indicator definitions, outlier treatments, and weighting schemes. Results based on different indicator definitions (per-capita vs. intensity measures) remain strongly correlated with the baseline (correlations > 0.6), while estimates obtained under alternative outlier trimming (top/bottom 1% and 5%) and weighting methods show even higher concordance (correlations > 0.8), indicating robust performance with respect to measurement choices. Although subsystem weights differ markedly across methods (including equal weights, entropy weights, and PCA as reported in Supplementary Table 5), the resulting city-group rankings and the ordering of socioeconomic correlates remain largely unchanged, further supporting robustness [Supplementary Figure 8].
Policy evaluations using DID [Supplementary Tables 6-8] show that the Air Pollution Prevention and Control Action Plan significantly improves air-pollution governance and the multi-factor synergy index, while the carbon emissions trading scheme has significant positive effects on CM, air-pollution control, and water-resource management. By contrast, the estimated effects of the “zero-waste city” initiative are not statistically significant, likely reflecting its shorter implementation period. Overall, policy impacts during the study period are strongest for air pollution and more modest for water management, with limited - and in some cases negative (though insignificant) - effects on solid-waste governance. This asymmetry provides external validation for the obstacle diagnosis: as air and water outcomes improve under policy pressure, solid waste and carbon emissions increasingly emerge as the binding constraints on further gains in synergistic governance.
Controlling for city and year fixed effects and accounting for spatial dependence, regression results show that energy intensity, energy structure, and the share of pollution-intensive industries are significantly negatively associated with synergistic governance, while the service-sector share is significantly positive; urbanization is negative but insignificant, suggesting possible nonlinearity [Supplementary Table 9]. Spatial Durbin estimates confirm strong spatial dependence: energy structure and the power sector exert negative local effects and negative spillovers to neighboring cities, whereas the service-sector share remains positive locally but exhibits negative spillovers, consistent with interregional competition [Supplementary Table 10]. These signs and significance patterns closely match the machine-learning results, reinforcing the stability of the identified associations.
Taken together, the findings are consistent with China’s energy-transition and industrial-upgrading objectives emphasized in the 13th and 14th Five-Year Plans and align with established co-control mechanisms: cleaner energy structures reduce both carbon emissions and air pollutants; industrial upgrading shifts activity away from energy-intensive production and alleviates solid-waste pressures; and stronger technological capacity improves end-of-pipe efficiency, recycling, and coordination between water-use efficiency and pollution control.
DISCUSSION
Policy implications
China’s environmental synergistic governance remains policy-fragmented, with performance assessments still organized in single-domain silos (carbon, air, waste, water). This limits the diagnosis of cross-subsystem bottlenecks at the city and urban-agglomeration levels. A national multi-objective assessment framework that explicitly accounts for cross-subsystem synergy should be embedded into ecological civilization evaluations and regional performance reviews, and translated into tiered local targets aligned with industrial structure, resource endowment, and environmental constraints.
Mean SHAP profiles reveal strong regional heterogeneity. The Pearl River Delta and Yangtze River Delta are consistently associated with configurations predicting stronger synergistic governance, whereas Central-Southern Liaoning, the Guanzhong Plain, and non-megalopolis areas more often align with weaker predicted performance [Figure 4]. These contrasts indicate that uniform policy prescriptions are unlikely to work and that region-specific pathways are necessary.
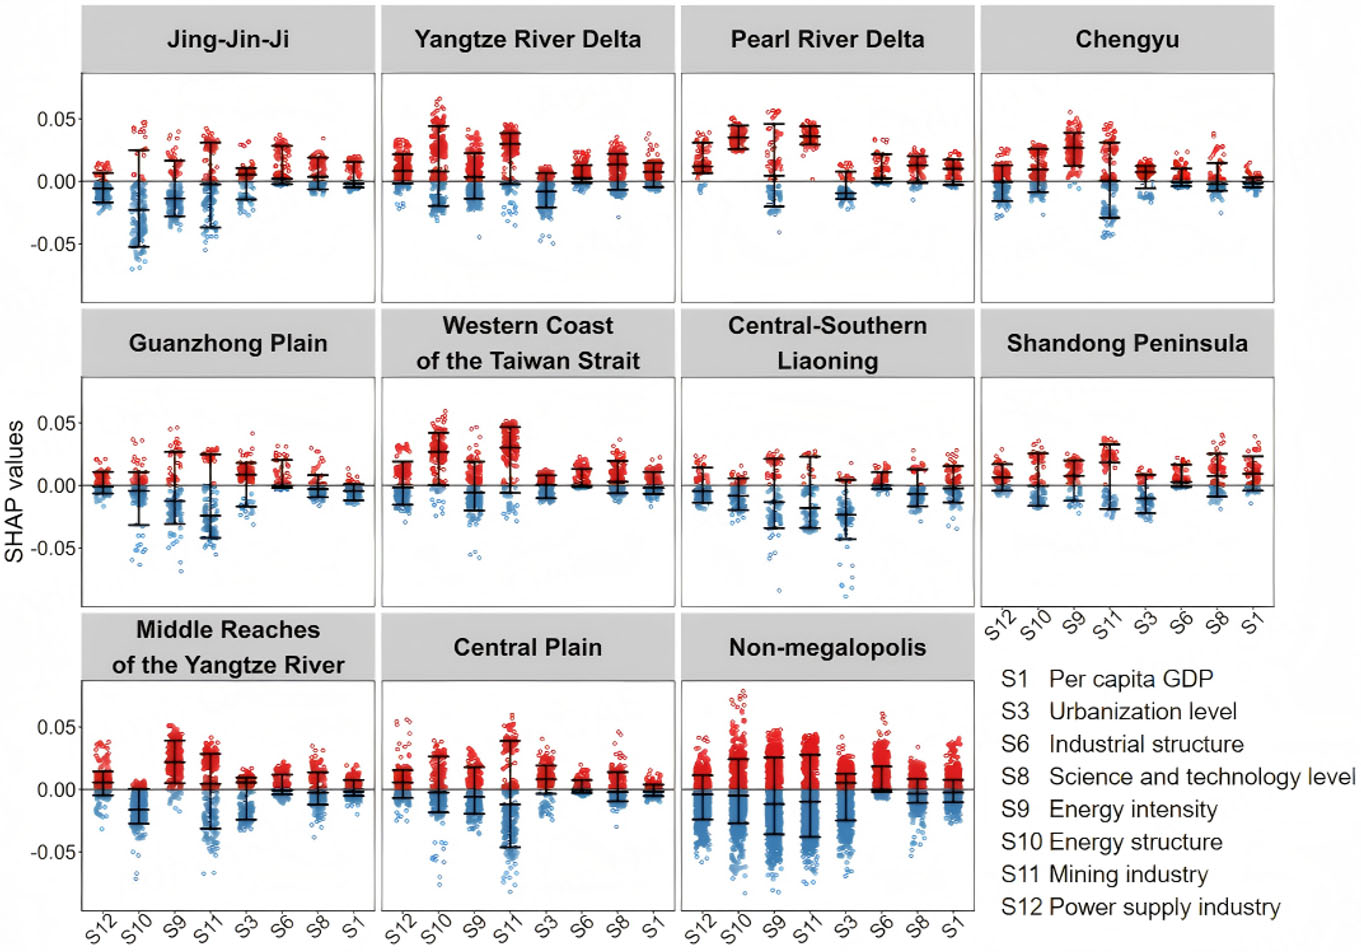
Figure 4. Analysis of synergistic governance advantages and constraints in urban agglomerations. The top and bottom lines represent the 10th and 90th percentiles, respectively, with the middle line indicating the median. Red dots denote positive SHAP values, reflecting a positive impact of the variable on urban synergistic governance, while blue dots indicate negative SHAP values and thus a negative impact.
For advanced industrial agglomerations (e.g., the Yangtze River Delta, Pearl River Delta, and Shandong Peninsula), priorities should shift from expansion to quality-oriented regulation. This entails embedding energy-use and emission constraints into spatial planning and project approval, tightening entry thresholds for new high-energy/high-emission projects, and prioritizing the upgrading of existing capacity through equipment renewal, process optimization, efficiency improvements, and waste-heat recovery. Industrial-park circular retrofitting can further enable integrated gains across carbon, air, waste, and water while maintaining competitiveness.
For transition-ready regions (e.g., Chengyu, the Middle Reaches of the Yangtze River, and the Western Coast of the Taiwan Strait), a gradual structural-adjustment pathway is more appropriate than disruptive restructuring. Policy should raise energy-efficiency and emission standards in mining and power generation, use differentiated electricity pricing and performance-based assessments to accelerate the exit of inefficient processes, and channel public investment toward clean production, end-of-pipe upgrading, and key process retrofits. Targeted support for grid flexibility and low-carbon substitution (e.g., cleaner fuels and electrification where feasible) can further help translate efficiency advantages into coordinated gains across CM, air-pollution control, and SWM.
For internally uneven agglomerations (most notably Jing-Jin-Ji), governance should focus on cross-boundary coordination to narrow persistent intra-region gaps and manage spillovers. Key priorities include harmonizing monitoring and accounting standards, building shared data platforms, and strengthening joint enforcement mechanisms, alongside joint planning for major pollution sources and cross-city infrastructure. Cooperation funds linked to ecological compensation can be used to finance shared wastewater integration, regional solid-waste treatment capacity, and coordinated emergency-response mechanisms in areas where transboundary impacts are strong.
For heavy-industry lock-in regions (e.g., Central-Southern Liaoning, the Central Plain, and the Guanzhong Plain), policy should avoid blanket contraction of high-carbon sectors and instead pursue benchmark-based upgrading with credible transition support. Stricter energy-efficiency and emission benchmarks can serve as conditions for capacity retention and permitting, while targeted subsidies and financial instruments - such as retrofit grants, interest subsidies or credit guarantees for equipment renewal, and incentives for fuel substitution - can lower the upfront cost of compliance. Complementary measures, including dedicated re-employment and skills-upgrading programs for affected workers and “green procurement” or demonstration projects that create stable demand for cleaner industrial outputs, can help sustain gradual upgrading while limiting unnecessary economic disruption.
Contributions and limitations
This study expands the synergistic governance framework to four subsystems - CM, APA, SWM, and WC - allowing a more comprehensive assessment of co-control performance and overlooked constraints. We observe improving carbon-pollution synergies over the past decade, consistent with evidence on China’s co-control progress[69]. However, progress is uneven across domains. Many cities achieved concurrent gains in APA and WC, whereas the solid-waste subsystem lagged and even showed trade-offs in some regions, such as Central and Southern Liaoning where solid-waste emissions rose despite air-quality improvement. This underscores the need for integrated governance to avoid burden shifting across environmental domains.
We further develop a measurement-diagnosis framework integrating the CCD and the obstacle degree model (ODM), which helps identify subsystem-specific bottlenecks beyond aggregate indices. The diagnosis is consistent with our DID results. The Air Pollution Prevention and Control Action Plan is associated with significant improvements in the APA subsystem, while effects on WC are not significant. The carbon emissions trading scheme shows a smaller estimated effect on CM, plausibly reflecting rising energy demand and heavy-industry lock-in. Meanwhile, these policies are associated with adverse changes in solid-waste governance, indicating cross-domain trade-offs that may shift binding obstacles over time.
Finally, we use RF with SHAP to characterize nonlinear and interactive associations between socioeconomic conditions and synergistic governance, interpreting the results as predictive rather than causal. Unlike prior studies that often report largely linear links between environmental performance and factors such as pollution-intensive activity or technological capacity, we find pronounced nonlinearity[70]. In particular, energy use and pollution-intensive industrial activity exhibit diminishing returns, and threshold patterns indicate that energy intensity and industrial structure become more strongly associated with performance only beyond certain levels. This suggests shifting constraints, with early gains tied more to basic governance capacity and end-of-pipe efficiency, while later improvements increasingly require deeper changes in energy and industrial structures.
However, this study has several limitations. First, indicator coverage is constrained by data availability. Consistent city-level panel data on desertification control and long-term soil erosion are lacking, and land-use/land-cover datasets are often reported only at five- or ten-year intervals, limiting their use in annual city analyses. In addition, the solid-waste dimension does not include hazardous waste, and the water-resource subsystem omits water-quality indicators. These omissions may lead to an incomplete assessment of urban environmental risks and understate the complexity of synergistic governance.
Second, the measurement and interpretation of synergistic governance remain imperfect. The concept of “synergy” is not uniformly defined, and the CCD framework assigns equal weights to development level and coupling degree, which may not fit all governance contexts. While we test alternative weighting schemes (entropy vs. equal weights) and obtain highly consistent results [Supplementary Figure 6], future work could explore more flexible indicator designs and weighting structures. Moreover, we do not disentangle causal links across governance domains, so it remains unclear whether improvements in one domain reflect targeted interventions or spillovers from progress in others.
Third, sectoral heterogeneity and causal inference warrant further attention. Although we consider energy, mining, and power sectors, limited industry-level granularity restricts city-specific diagnosis, as key constraints in some cities may stem from non-energy sectors or unique industrial structures. Future research should incorporate higher-resolution industry data to better identify dominant emission sources and governance bottlenecks. In addition, the machine-learning analysis identifies associations rather than causal effects, underscoring the need for stronger causal identification strategies in future work.
CONCLUSION
This study aims to assess the level, constraints, and drivers of synergistic environmental governance across Chinese cities under the dual goals of pollution control and CM. By integrating a four-subsystem indicator framework with coordination diagnosis and machine-learning interpretation, we provide a systematic evaluation of how CM, air-pollution control, SWM, and WC interact across cities and urban agglomerations. The analysis highlights uneven progress across domains and regions, identifies persistent bottlenecks that limit coordinated improvement, and clarifies how socioeconomic conditions are associated with differences in synergistic performance. Looking forward, these findings underscore the importance of integrated, region-specific governance strategies to advance coordinated environmental and climate action in rapidly urbanizing economies.
DECLARATIONS
Authors’ contributions
Conceptualization, methodology, formal analysis, writing - original draft: Zhao, Z.; Yang, J.
Writing - review & editing: Ma, Z.; Fang, W.; Liu, M.
Funding acquisition, project administration: Bi, J.
Availability of data and materials
All study data are included in the article and the Supplementary Materials.
Financial support and sponsorship
This study was financially supported by the Jing-Jin-Ji Regional Integrated Environmental Improvement-National Science and Technology Major Project (2025ZD1207803) and the National Natural Science Foundation of China (Grant Nos. 72304136, 72488101, and 72234003).
Conflicts of interest
Not applicable.
Ethical approval and consent to participate
Not applicable.
Consent for publication
Not applicable.
Copyright
© The Author(s) 2026.
Supplementary Materials
REFERENCES
1. Yang, J.; Zhao, Z.; Fang, W.; Ma, Z.; Liu, M.; Bi, J. China's progress in synergetic governance of climate change and multiple environmental issues. PNAS. Nexus. 2024, 3, pgae351.
2. Zhu, J.; Wu, S.; Xu, J. Synergy between pollution control and carbon reduction: China's evidence. Energy. Econ. 2023, 119, 106541.
3. Jiang, T.; Zhang, R.; Zhang, F.; Shi, G.; Wang, C. Assessing provincial coal reliance for just low-carbon transition in China. Environ. Impact. Assess. Rev. 2023, 102, 107198.
4. Chen, X. H.; Tee, K.; Elnahass, M.; Ahmed, R. Assessing the environmental impacts of renewable energy sources: a case study on air pollution and carbon emissions in China. J. Environ. Manag. 2023, 345, 118525.
5. Kumar, P.; Druckman, A.; Gallagher, J.; et al. The nexus between air pollution, green infrastructure and human health. Environ. Int. 2019, 133, 105181.
6. Luo, X.; Wang, S.; Liu, C.; et al. Concentration distribution and group disparity of traffic-derived NO2 exposure in Baoshan District. Carbon. Footprints. 2025, 4, 14.
7. Zhang, Z.; Chen, Z.; Zhang, J.; et al. Municipal solid waste management challenges in developing regions: a comprehensive review and future perspectives for Asia and Africa. Sci. Total. Environ. 2024, 930, 172794.
8. Kibria, M. G.; Masuk, N. I.; Safayet, R.; Nguyen, H. Q.; Mourshed, M. Plastic waste: challenges and opportunities to mitigate pollution and effective management. Int. J. Environ. Res. 2023, 17, 20.
9. Dong, Z.; Wang, B.; Shao, C. The historical evolution and modernization path of China’s ecological and environmental governance. Energy. Environ. Sustain. 2025, 1, 100014.
10. Pang, G.; Li, L.; Guo, D. Does the integration of the digital economy and the real economy enhance urban green emission reduction efficiency? Evidence from China. Sustain. Cities. Soc. 2025, 122, 106269.
11. Mai, W.; Xiong, L.; Liu, B.; Liu, S. Spatial-temporal evolution, drivers, and pathways of the synergistic effects of digital transformation on pollution and carbon reduction in heavily polluting enterprises. Sci. Rep. 2025, 15, 11963.
12. Lin, B.; Teng, Y. Synergistic disparities of pollution reduction and carbon mitigation in the industrial chain: evidence from China's industrial sector. Environ. Res. 2024, 248, 118226.
13. Zhou, Y. Legal pathways for blue carbon protection and ship pollution in China: integrated ocean and climate governance. Mar. Dev. 2025, 3, 15.
14. Liu, H.; Niu, Y. Experiences and challenges in the development of carbon footprinting in megacities - taking Shanghai as an example. Carbon. Footprints. 2024, 3, 20.
15. Rissman, J.; Bataille, C.; Masanet, E.; et al. Technologies and policies to decarbonize global industry: review and assessment of mitigation drivers through 2070. Appl. Energy. 2020, 266, 114848.
16. Iacovidou, E.; Velis, C. A.; Purnell, P.; et al. Metrics for optimising the multi-dimensional value of resources recovered from waste in a circular economy: a critical review. J. Clean. Prod. 2017, 166, 910-38.
17. Li, C.; Liu, H. Exploratory analysis of grey behavior of multidimensional subjects of environmental governance under the carbon peak mechanism. Sustain. Futures. 2025, 9, 100701.
18. Li, H.; Meng, P.; Maraseni, T. N.; Wang, D.; Lu, C.; Qu, J. Synergistic effects and influencing factors of reducing atmospheric pollutants and carbon dioxide emissions in China. Res. Cold. Arid. Reg. 2025.
19. Long, Y.; Luo, Z.; Huang, B.; Wang, Y.; Wang, Q.; Zhang, M. Industry-specific synergistic assessment of pollution and carbon reduction: a case study on photovoltaic waste recycling. Resour. Conserv. Recycl. 2025, 222, 108483.
20. Feng, Y.; Wang, L.; Nie, C. Can place-based policy reduce carbon emissions? Evidence from industrial transformation and upgrading exemplary zone in China. Humanit. Soc. Sci. Commun. 2024, 11, 877.
21. Li, W.; Ma, D.; Fu, J.; Qi, Y.; Shi, H.; Tianhua, N. A quantitative exploration of the interactions and synergistic driving mechanisms between factors affecting regional air quality based on deep learning. Atmos. Environ. 2023, 314, 120077.
22. Jia, Z.; Wen, S. Interaction effects of market-based and incentive-driven low-carbon policies on carbon emissions. Energy. Econ. 2024, 137, 107776.
23. Dwivedi, Y. K.; Hughes, L.; Kar, A. K.; et al. Climate change and COP26: are digital technologies and information management part of the problem or the solution? An editorial reflection and call to action. Int. J. Inf. Manag. 2022, 63, 102456.
24. Wang, Y.; Ni, J.; Xu, K.; Zhang, H.; Gong, X.; He, C. Intricate synergistic effects between air pollution and carbon emission: an emerging evidence from China. Environ. Pollut. 2024, 349, 123851.
25. Guan, Y.; Xiao, Y.; Rong, B.; Lu, W.; Zhang, N.; Qin, C. Assessing the synergy between CO2 emission and ambient PM2.5 pollution in Chinese cities: an integrated study based on economic impact and synergy index. Environ. Impact. Assess. Rev. 2023, 99, 106989.
26. Zheng, S.; Li, Y.; Xie, H. What makes the synergy between pollution and carbon emission control effective? Based on an evaluation of the carbon emissions trading pilot policy. Environ. Res. Commun. 2024, 6, 125019.
27. Filimonova, N.; Birchall, S. J. Sustainable municipal solid waste management: a comparative analysis of enablers and barriers to advance governance in the Arctic. J. Environ. Manag. 2024, 371, 123111.
28. Möslinger, M.; Ulpiani, G.; Vetters, N. Circular economy and waste management to empower a climate-neutral urban future. J. Clean. Prod. 2023, 421, 138454.
29. Zhao, J.; Duan, J.; Han, Y.; Gao, F. Correlation between carbon emissions and water consumption in different industries in China: Spatial and temporal distribution characteristics and driving factors. J. Clean. Prod. 2023, 427, 139196.
30. You, C.; Qu, H.; Wang, C.; Feng, C. C.; Guo, L. Trade-off and synergistic of ecosystem services supply and demand based on socio-ecological system (SES) in typical hilly regions of south China. Ecol. Ind. 2024, 160, 111749.
31. Zhao, D.; Liu, J.; Sun, L.; et al. Quantifying economic-social-environmental trade-offs and synergies of water-supply constraints: an application to the capital region of China. Water. Res. 2021, 195, 116986.
32. Olabi, A. G.; Elsaid, K.; Obaideen, K.; et al. Renewable energy systems: comparisons, challenges and barriers, sustainability indicators, and the contribution to UN sustainable development goals. Int. J. Thermofluids. 2023, 20, 100498.
33. Qiao, R.; Liu, X.; Gao, S.; et al. Industrialization, urbanization, and innovation: nonlinear drivers of carbon emissions in Chinese cities. Appl. Energy. 2024, 358, 122598.
34. Fan, D.; Maliki, N. Z. B.; Yu, S.; Men, T. Assessment of resilience and key drivers of Tibetan villages in Western Sichuan. Sci. Rep. 2025, 15, 20594.
35. Zhou, Z.; Qiu, C.; Zhang, Y. A comparative analysis of linear regression, neural networks and random forest regression for predicting air ozone employing soft sensor models. Sci. Rep. 2023, 13, 22420.
36. Ma, X.; Zou, B.; Deng, J.; et al. A comprehensive review of the development of land use regression approaches for modeling spatiotemporal variations of ambient air pollution: a perspective from 2011 to 2023. Environ. Int. 2024, 183, 108430.
37. Nahar, S. Modeling the effects of artificial intelligence (AI)-based innovation on sustainable development goals (SDGs): applying a system dynamics perspective in a cross-country setting. Technol. Forecast. Soc. Chang. 2024, 201, 123203.
38. Hu, J. Synergistic effect of pollution reduction and carbon emission mitigation in the digital economy. J. Environ. Manag. 2023, 337, 117755.
39. Li, R.; Luo, Y.; Li, Y.; et al. Synergistic reduction in air pollutants and health benefits under China's dual-carbon policy. Environ. Sci. Technol. 2024, 58, 9467-70.
40. Wen, W.; Deng, Z.; Ma, X.; et al. Analysis of the synergistic benefits of typical technologies for pollution reduction and carbon reduction in the iron and steel industry in the Beijing-Tianjin-Hebei region. Sci. Rep. 2024, 14, 12413.
41. Xin, B.; Zhang, T.; Santibanez-Gonzalez, E. D. R. Synergistic effects of regional environmental governance on alleviating energy poverty and promoting household decarbonization. Energy. Policy. 2024, 185, 113970.
42. Zhao, X.; Shao, B.; Su, J.; Tian, N. Exploring synergistic evolution of carbon emissions and air pollutants and spatiotemporal heterogeneity of influencing factors in Chinese cities. Sci. Rep. 2025, 15, 2657.
43. Gu, B.; Zhao, H.; Li, X.; Zhang, Q. Moving towards synergistic reductions on PM2.5 and CO2 and its mechanism: a case study of Yangtze River Economic Belt, China. J. Geogr. Sci. 2024, 34, 1493-512.
44. Shang, W. L.; Lv, Z. Low carbon technology for carbon neutrality in sustainable cities: a survey. Sustain. Cities. Soc. 2023, 92, 104489.
45. Jia, B.; Xie, M.; Wu, J.; Zhao, J. Towards low carbon urban agglomerations: spatiotemporal characteristics and influencing factors of carbon emission intensity and network linkages in China’s urban agglomerations. Ecol. Ind. 2025, 177, 113728.
46. Wang, S.; Yang, C.; Hou, D.; Dai, L. How do urban agglomerations drive economic development? A policy implementation and spatial effects perspective. Econ. Anal. Policy. 2023, 80, 1224-38.
47. Chetty, R.; Friedman, J. N.; Stepner, M.; Opportunity insights team. The economic impacts of Covid-19: evidence from a new public database built using private sector data. Q. J. Econ. 2024, 139, 829-89.
48. Zhang, W.; Liu, G.; Ghisellini, P.; Yang, Z. Ecological risk and resilient regulation shifting from city to urban agglomeration: a review. Environ. Impact. Assess. Rev. 2024, 105, 107386.
49. Li, X.; Liu, X. Regional prioritization in vehicle electrification and renewable electricity expansion facilitates decarbonization of China’s road transport. Carbon. Footprints. 2025, 4, 32.
50. Wang, Z.; Sun, Y.; Kong, H.; Xia-Bauer, C. An in-depth review of key technologies and pathways to carbon neutrality: classification and assessment of decarbonization technologies. Carbon. Neutrality. 2025, 4, 15.
51. Kang, Y.; Yang, Q.; Wang, L.; et al. China's changing city-level greenhouse gas emissions from municipal solid waste treatment and driving factors. Resour. Conserv. Recycl. 2022, 180, 106168.
52. Zhan, H.; Shao, L.; Pan, Y.; Wu, Z. Life-cycle carbon emissions from pilot zero-waste technologies in China. Environ. Impact. Assess. Rev. 2023, 103, 107279.
53. Cracolici, M. F.; Cuffaro, M.; Nijkamp, P. The measurement of economic, social and environmental performance of countries: a novel approach. Soc. Indic. Res. 2010, 95, 339-56.
54. Zhong, S.; Li, J.; Zhao, R. Does environmental information disclosure promote sulfur dioxide (SO2) remove? New evidence from 113 cities in China. J. Clean. Prod. 2021, 299, 126906.
55. Jiang, L.; Lin, C.; Lin, P. The determinants of pollution levels: firm-level evidence from Chinese manufacturing. J. Comp. Econ. 2014, 42, 118-42.
56. Zhang, X.; Yao, G.; Vishwakarma, S.; et al. Quantitative assessment of agricultural sustainability reveals divergent priorities among nations. One. Earth. 2021, 4, 1262-77.
57. Zhe, W.; Xigang, X.; Feng, Y. An abnormal phenomenon in entropy weight method in the dynamic evaluation of water quality index. Ecol. Ind. 2021, 131, 108137.
58. Dong, L.; Longwu, L.; Zhenbo, W.; Liangkan, C.; Faming, Z. Exploration of coupling effects in the Economy-Society-Environment system in urban areas: case study of the Yangtze River Delta Urban Agglomeration. Ecol. Ind. 2021, 128, 107858.
59. Li, L.; Fan, Z.; Feng, W.; Yuxin, C.; Keyu, Q. Coupling coordination degree spatial analysis and driving factor between socio-economic and eco-environment in northern China. Ecol. Ind. 2022, 135, 108555.
60. Yang, L.; Lin, Y.; Zhu, J.; Yang, K. Dynamic coupling coordination and spatial-temporal analysis of digital economy and carbon environment governance from provinces in China. Ecol. Ind. 2023, 156, 111091.
61. Wei, D.; Yin, J.; Xia, R.; Jiang, H.; Ding, Y.; Luo, X. Study on the coordinated development of urban competitiveness and energy-carbon emission reduction in China. Environ. Res. 2024, 251, 118689.
62. Khan, I. K.; Daud, H. B.; Zainuddin, N. B.; et al. Determining the optimal number of clusters by Enhanced Gap Statistic in K-mean algorithm. Egypt. Inform. J. 2024, 27, 100504.
63. Avila-Marin, A. L.; Fernandez-Reche, J.; Martinez-Tarifa, A. Modelling strategies for porous structures as solar receivers in central receiver systems: a review. Renew. Sustain. Energy. Rev. 2019, 111, 15-33.
64. Zhou, W.; Yan, Z.; Zhang, L. A comparative study of 11 non-linear regression models highlighting autoencoder, DBN, and SVR, enhanced by SHAP importance analysis in soybean branching prediction. Sci. Rep. 2024, 14, 5905.
65. Liu, M.; Chen, H.; Wei, D.; Wu, Y.; Li, C. Nonlinear relationship between urban form and street-level PM2.5 and CO based on mobile measurements and gradient boosting decision tree models. Build. Environ. 2021, 205, 108265.
66. Ahmed Ouameur, M.; Caza-Szoka, M.; Massicotte, D. Machine learning enabled tools and methods for indoor localization using low power wireless network. Int. Things. 2020. , 12, 100300.
67. Sui, Q.; Li, G.; Peng, Y.; Zhang, J.; Zhang, Y.; Zhao, R. Scalable and robust machine learning framework for HIV classification using clinical and laboratory data. Sci. Rep. 2025, 15, 18727.
68. Lamane, H.; Mouhir, L.; Moussadek, R.; Baghdad, B.; Kisi, O.; El Bilali, A. Interpreting machine learning models based on SHAP values in predicting suspended sediment concentration. Int. J.. Sediment. Res. 2025, 40, 91-107.
69. Zhang, Q.; Yin, Z.; Lu, X.; et al. Synergetic roadmap of carbon neutrality and clean air for China. Environ. Sci. Ecotechnol. 2023, 16, 100280.
Cite This Article
How to Cite
Download Citation
Export Citation File:
Type of Import
Tips on Downloading Citation
Citation Manager File Format
Type of Import
Direct Import: When the Direct Import option is selected (the default state), a dialogue box will give you the option to Save or Open the downloaded citation data. Choosing Open will either launch your citation manager or give you a choice of applications with which to use the metadata. The Save option saves the file locally for later use.
Indirect Import: When the Indirect Import option is selected, the metadata is displayed and may be copied and pasted as needed.
About This Article
Copyright

Data & Comments
Data
0


Comments
Comments must be written in English. Spam, offensive content, impersonation, and private information will not be permitted. If any comment is reported and identified as inappropriate content by OAE staff, the comment will be removed without notice. If you have any queries or need any help, please contact us at support@oaepublish.com.