


Global sea level rise affects house prices in coastal cities
 0
0 Abstract
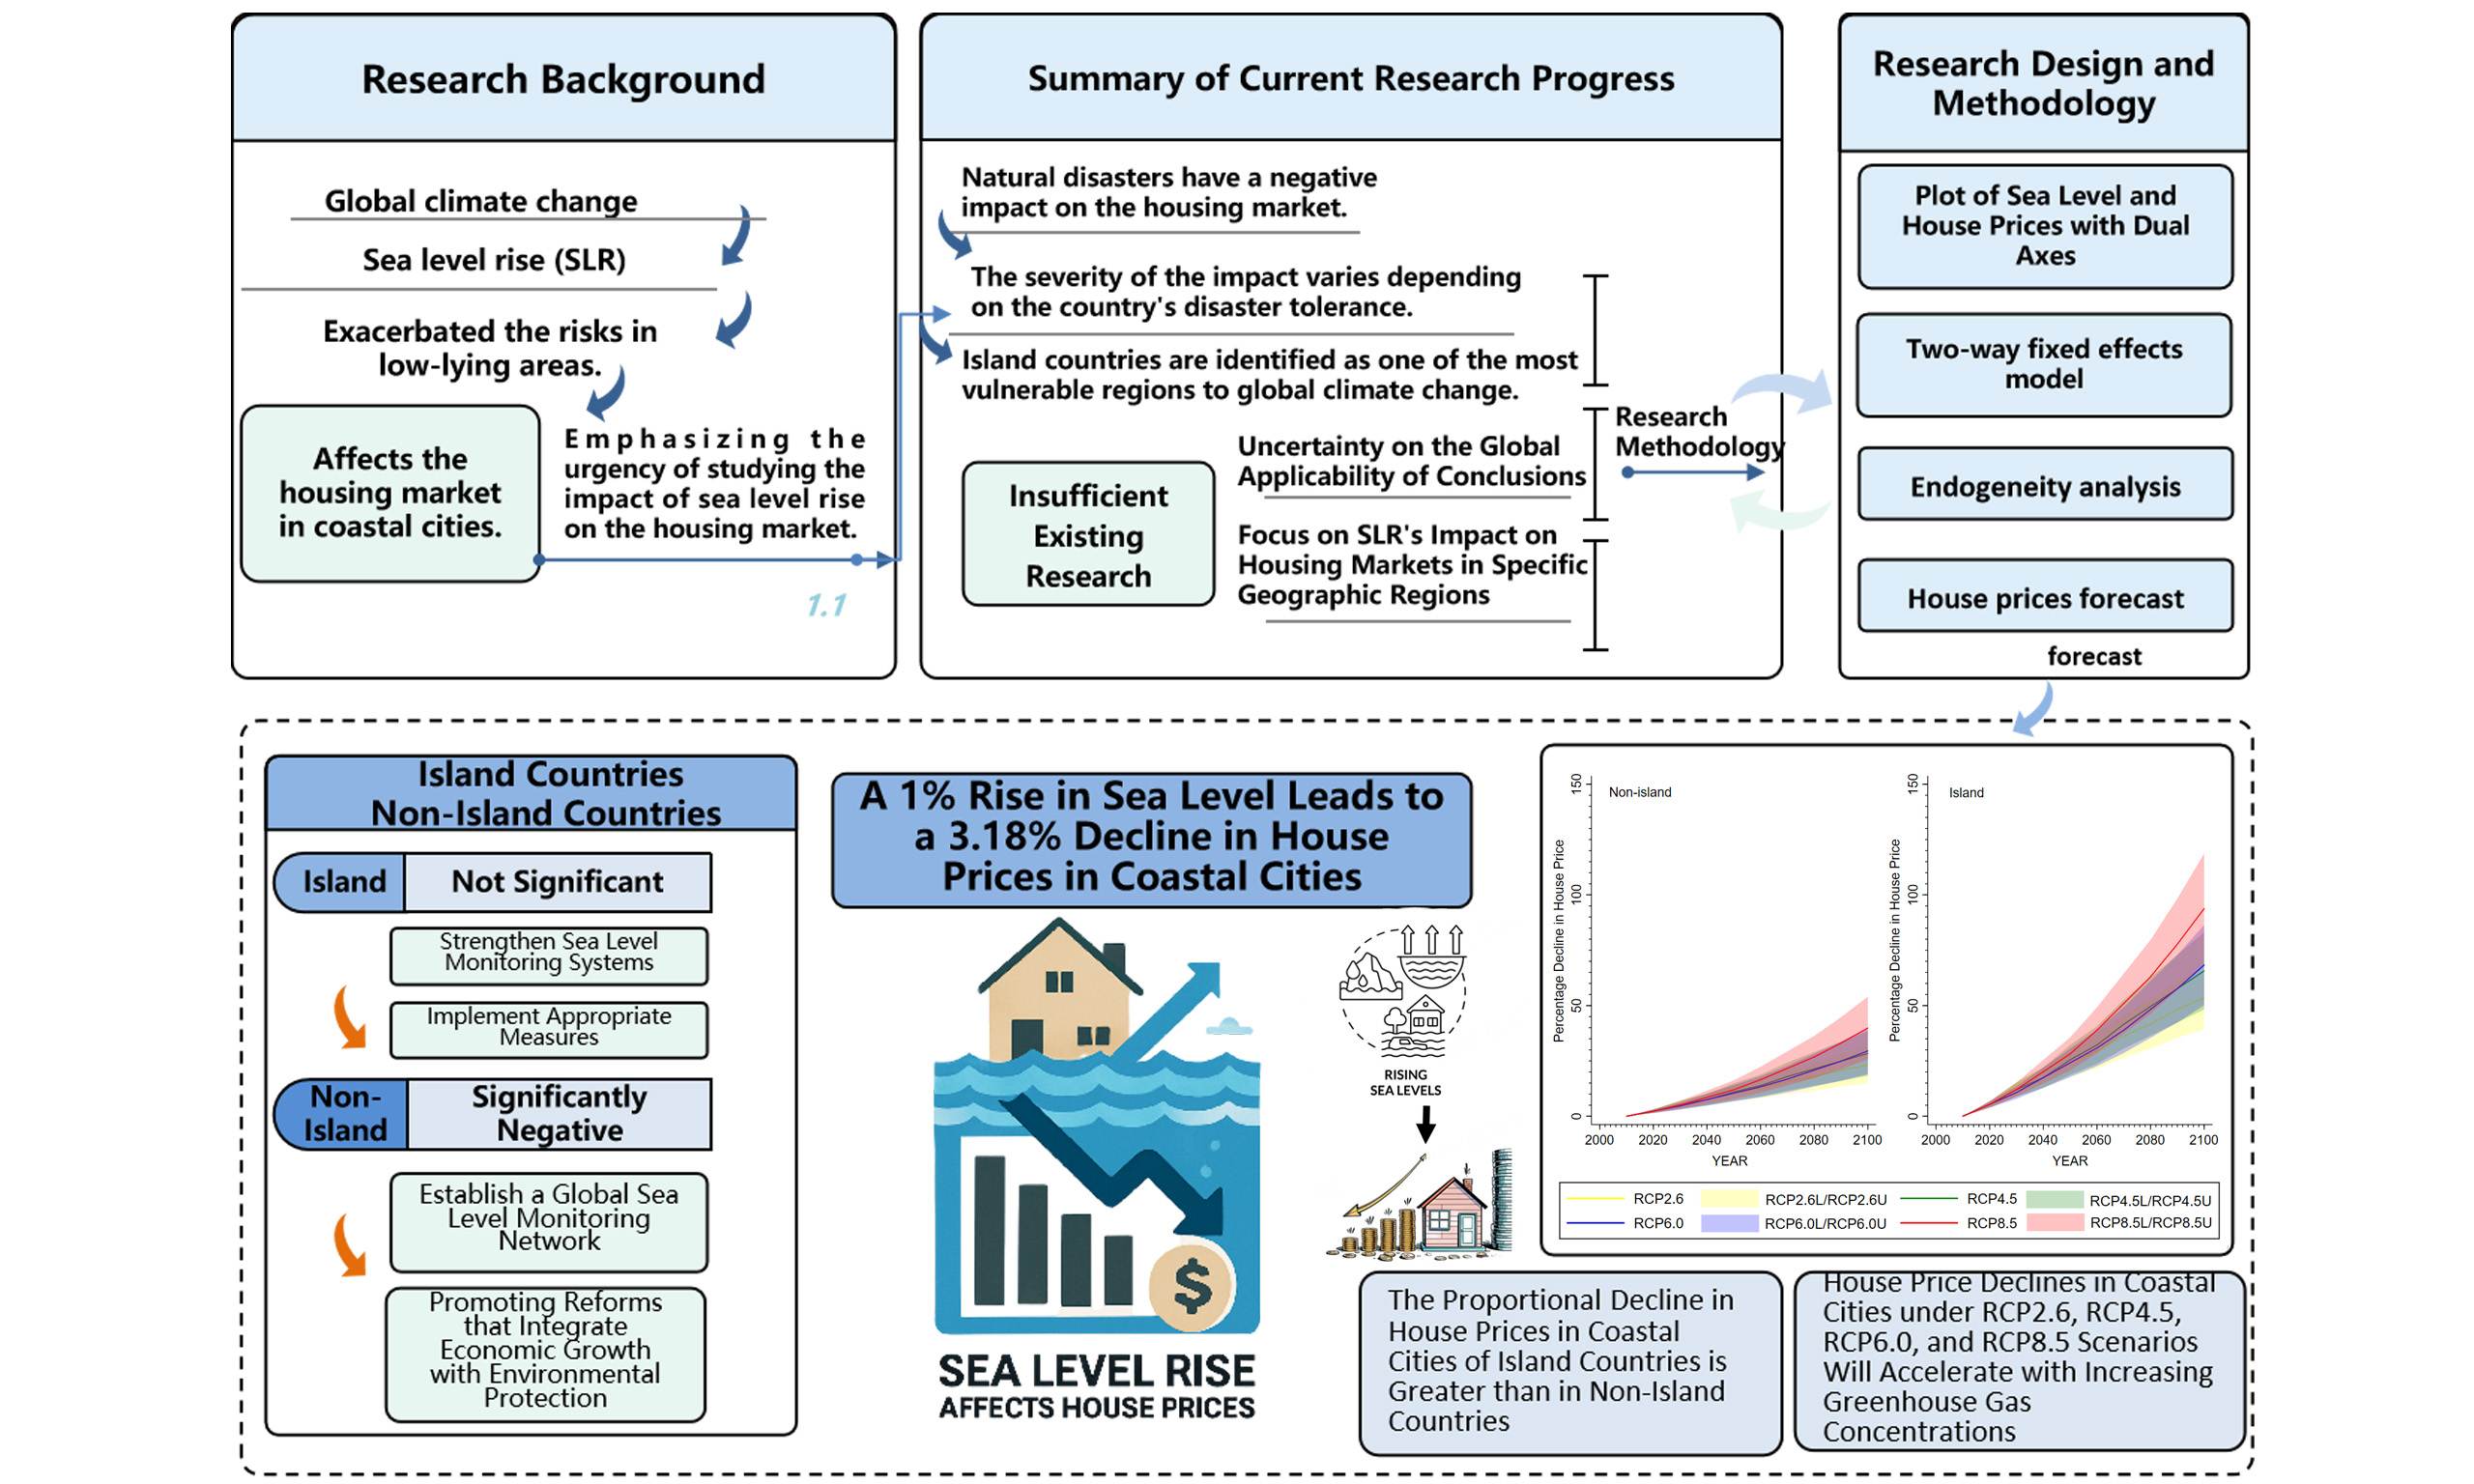
The Sea level rise (SLR) is undermining the stability of housing markets in coastal areas and exacerbating the disparities between coastal and inland regions. However, the magnitude of SLR’s impact on housing prices remains unclear. Moreover, previous studies have focused on the impact of SLR on the housing market within a specific geographic region, and we still do not know whether these conclusions are applicable on a global scale. Therefore, in the context of global climate change, we investigate the impact of SLR on house prices in coastal cities using data from the 50 most economically developed coastal cities in the world during the period 2009-2018, and predict the future house price movements under the effects of SLR. The results show that for every 1% increase in SLR, house prices in coastal cities drop by 3.18%, and house prices in island countries are more affected by SLR. Further prediction results show that the projected house price declines in island countries are more severe than in non-island countries, and that this trend intensifies as greenhouse gas concentrations continue to rise in the next few decades. In the context of global rising sea levels, our study quantifies potential economic costs of climate change and provides recommendations for effective SLR and climate change mitigation policies.
Keywords
INTRODUCTION
Sea level rise (SLR) has become an increasingly prominent global concern in recent decades[1]. Relative to 1993, global mean sea level had risen by 91.3 mm (3.6 inches) by 2020, marking a historical peak[2]. A growing body of research indicates that SLR intensifies multiple environmental hazards, including storm surges[3-6], coastal vegetation loss[7], saline intrusion, and shoreline erosion[8]. These effects collectively increase flooding risks, particularly in low-lying island regions.
Coastal cities, despite their geographical advantages and strong resource endowments that support economic activity, are especially vulnerable to these risks. Compared with inland areas, they face greater exposure to SLR, which threatens both economic development and daily living conditions[9-11]. In severe cases, SLR may displace large coastal populations, potentially leading to climate-induced migration and broader humanitarian challenges[12,13].
Giglio et al. show that housing prices are shaped not only by economic conditions but also by environmental factors[14]. As sea levels continue to rise, the baseline water level at the onset of storm surges increases. Consequently, under comparable storm conditions, surge events become more severe. Even modest increases in sea level can therefore amplify both the frequency and intensity of hazards such as storm surges and coastal flooding[15,16]. This, in turn, elevates the likelihood of property inundation in coastal areas and undermines the stability of local housing markets[17].
In addition to these physical risks, behavioural responses also play an important role. Individuals adjust their risk perceptions in response to environmental change[18], and increasing exposure to SLR may reduce the perceived desirability of coastal living. Looking ahead, the cumulative effects of SLR - together with more frequent and severe flooding associated with storms and tidal surges - are likely to exert persistent pressure on housing markets worldwide[19,20].
From a theoretical perspective, the ocean can be viewed as a global public good, characterised by non-excludability and non-rivalry[21]. Public goods theory suggests that environmental quality significantly influences individual well-being. Building on Charles Tiebout’s sorting framework, households are expected to relocate toward areas offering more favourable environmental conditions, while avoiding regions exposed to higher SLR risks[22]. Such migration patterns may reduce demand for coastal housing, leading to declines in property values and further destabilising local housing markets[12,23-25].
A growing body of literature documents the adverse effects of natural hazards, including SLR, on housing markets. For instance, Ortega et al. show that properties located in flood-prone areas tend to sell at lower prices than comparable properties in unaffected locations[19]. Consistent with this evidence, homes with lower exposure to flood risk typically command price premiums, all else equal[26,27].
However, the magnitude and persistence of these effects appear to vary across regions. Palm et al. find that, in South Florida, despite substantial flood risk, both homeowners and real estate agents remain relatively optimistic and do not perceive a significant impact on housing demand[28]. Other studies further indicate that price discounts differ across property types and vary in duration following flooding events[29,30].
Building on this literature, more recent research has begun to examine the direct effects of SLR at the micro level. Using transaction-level data from the United States, Bernstein et al. show that buyers incorporate SLR risk into their purchasing decisions, with properties exposed to higher risk typically trading at a discount[31].
Although SLR poses risks worldwide, its impact differs across countries due to variations in geographic conditions and economic capacity to absorb environmental shocks[32]. The Intergovernmental Panel on Climate Change (IPCC) identifies island nations as among the most vulnerable regions to climate change[33,34]. In these settings, SLR-driven inundation presents significant threats to coastal housing and infrastructure[35]. Moreover, as economic activity, particularly tourism, is heavily concentrated along coastlines in many island countries, climate-related hazards such as SLR can impose substantial pressures on local economies[36].
By contrast, non-island countries are typically larger, possess more diversified economic structures, and exhibit greater resilience to natural hazards[37] Taken together, these differences suggest that, holding other factors constant, the impact of SLR on housing prices is likely to be more pronounced in coastal cities located in island countries than in those in non-island countries[38].
The existing literature suggests that SLR undermines the stability of housing markets in coastal areas and contributes to widening disparities between coastal and inland regions. However, the magnitude of its impact on housing prices remains insufficiently understood. Most prior studies focus on specific geographic contexts[26,27], leaving open the question of whether SLR exerts a systematic influence on housing markets at the global level. This gap is particularly important given that, in the context of climate change, SLR has already generated non-negligible economic costs across countries[39].
Motivated by these limitations, this study examines the relationship between SLR and housing prices using a global sample. We compile panel data on sea levels and housing prices for the 50 most economically developed coastal cities worldwide over the period 2009-2018. The analysis addresses three research questions: (i) how SLR affects housing prices in coastal cities; (ii) whether this effect differs between island and non-island countries; and (iii) how future housing price dynamics may evolve under alternative Representative Concentration Pathway (RCP) scenarios.
The empirical results show that SLR exerts a statistically significant negative effect on housing prices in coastal cities, with stronger impacts observed in island countries. Scenario-based projections further indicate that housing price declines are likely to intensify as greenhouse gas concentrations increase, with more pronounced effects in island economies. By quantifying these impacts, this study highlights the economic consequences of SLR and aims to draw greater attention to the heightened vulnerability of island countries. The findings also provide policy-relevant insights for climate adaptation and mitigation strategies.
This study contributes to the literature in several important ways. First, we construct a global dataset covering the 50 most economically developed coastal cities, extending beyond prior studies that typically focus on a single country or region. This broader scope enhances the external validity and generalisability of the findings.
Second, unlike existing research that predominantly relies on micro-level household data, we adopt a city-level perspective using macro indicators. Given the public and systemic nature of SLR, government responses play a central role in shaping its economic consequences. Our approach therefore provides policy-relevant insights by capturing how SLR risks may translate into housing market outcomes at the aggregate level. The findings highlight the importance of incorporating SLR-related risks into macroeconomic policy design and real estate regulation.
Third, we explicitly account for cross-country heterogeneity by distinguishing between island and non-island economies. This comparison reveals important differences in the extent to which SLR affects housing markets across geographic contexts. Beyond advancing the academic literature, our results underscore the broader implications of climate change, particularly by drawing attention to the heightened vulnerability of island countries and the need for coordinated international responses.
METHODS AND DATA
Data
We compile a panel dataset covering the period 2009-2018 for the 50 most economically developed coastal cities worldwide. The dataset includes sea level, housing prices, gross domestic product (GDP), consumer price index (CPI), population, temperature, rainfall, and the economic freedom index. The selection of these cities is guided by two considerations. First, these cities are among the most economically advanced, and thus are likely to exhibit higher valuations of coastal real estate assets[40]. Given their economic importance, coastal erosion and seawater flooding induced by SLR may generate substantial economic losses. Concurrently, their economic capacity enables substantial investment in the construction and maintenance of critical flood control infrastructure, including embankments, seawalls, and drainage systems, thereby enhancing the resilience of coastal cities and key assets to SLR[41]. Second, these cities possess high global visibility and influence, positioning them as focal points for international investment and collaboration in addressing SLR and strengthening coastal protection[42]. Examining the relationship between SLR and housing prices in this context therefore offers broader international relevance and a potential demonstration effect, providing informative benchmarks for policy and practice in developing coastal regions.
Specifically, data on sea level, temperature, and rainfall were obtained from the National Oceanic and Atmospheric Administration[2], wheatA, statista, relevant statistical yearbooks, and the website of each city’s meteorological office. Sea level data, measured in millimetres, were obtained from the Revised Local Reference (RLR) dataset of the Permanent Service for Mean Sea Level (PSMSL), with city-level values derived from the nearest available observation stations. Housing price data were compiled from the Numbeo database, supplemented by national statistical offices and property management and service department websites. Data on GDP, CPI, and population were collected from publicly available government and statistical office sources. Finally, economic freedom data were sourced from the The Heritage Foundation (https://www.heritage.org/). Given cross-country differences in currency units and temperature scales, all variables were standardised to ensure comparability. In addition, continuous variables were transformed using natural logarithms to mitigate the influence of extreme values and improve distributional properties. All statistical analyses were conducted using Stata version 17.0. The empirical models employ a two-way fixed effects specification, and statistical significance is assessed using two-tailed t-tests. Table 1 presents the descriptive statistics for the variables used in this study.
Descriptive statistics
| Variables | N | Mean | Median | SD | Min | Max |
| Hprice | 310 | 4,771.22 | 3,828.28 | 4,091.08 | 204.65 | 25,100.55 |
| Sealevel | 310 | 7,052.35 | 7,062.5 | 219.27 | 5,959 | 7,563 |
| GDP | 310 | 342.21 | 224.63 | 374.19 | 0.12 | 1,897.01 |
| Population | 291 | 626.43 | 385.9 | 733.43 | 25.93 | 3,732.7 |
| Temperature | 310 | 17.88 | 16.89 | 6.16 | 6.22 | 34.33 |
| Rainfall | 304 | 1,207.51 | 1,176.4 | 562.15 | 0 | 2,939.7 |
| CPI | 310 | 136.28 | 103.48 | 60.99 | 67.8 | 292.55 |
| Money freedom | 296 | 78.01 | 77.2 | 5.28 | 64.2 | 93.6 |
| Land relief | 310 | 708.59 | 552 | 689.587 | 24 | 3462 |
| Invest freedom | 296 | 60.39 | 70 | 21.76 | 20 | 90 |
| Fiscal freedom | 268 | 67.89 | 69.3 | 10.27 | 35 | 99.9 |
To illustrate the relationship between sea level and housing prices across cities, we compute city-level averages of both variables over the 2009-2018 period and present them in a biaxial plot [Figure 1]. Overall, Figure 1 indicates a negative association between sea levels and housing prices.
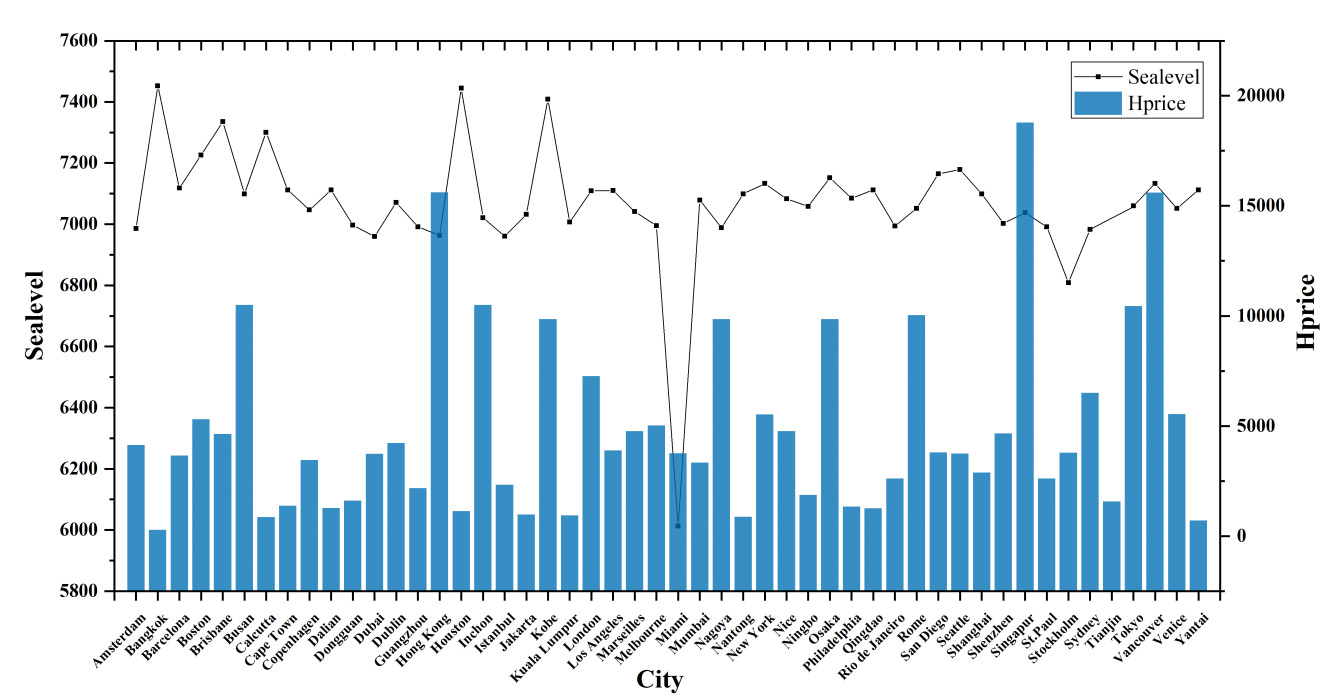
Figure 1. Average sea level and house price of the 50 sample cities.
Model setting
To examine the impact of SLR on house prices, we estimate the following regression:
where Hpriceit represents the average house price of city i in year t, which is the dependent variable; and Sealevelit is the sea level height of city i in year t, which is the key explanatory variable. The control variables include GDPit, Popuit, Temit, Rainit, CPIit, MFit, LandReliefit, representing GDP, population size, average temperature, rainfall, CPI, monetary freedom, land relief of city i in year t, respectively. Besides, ∑Year FE denotes the time fixed effects and ∑Country FE denotes the country fixed effects; α0 is the constant, and εit is the random error. The key parameter of interest is α1, which indicates the percentage change in house price caused by 1% increase in sea level because both Hpriceit and Sealevelit are continuous variables and are log transformed.
RESULTS
Baseline regression
Table 2 reports the estimated effects of SLR on housing prices in coastal cities. Column (1) presents the baseline specification without control variables. Column (2) incorporates a set of control variables, while Column (3) further includes time and country fixed effects. Across Columns (1-3), the coefficient on SeaLevel remains consistently negative and statistically significant, indicating that SLR exerts a detrimental effect on housing prices in coastal cities. In particular, the estimates from the preferred specification in Column (3) suggest that a 1% increase in sea level is associated with a 3.18% decline in housing prices.
The impact of SLR on house prices in coastal cities
| Variables | Hprice | ||
| (1) | (2) | (3) | |
| Sealevel | -2.8058* | -4.5630*** | -3.1815*** |
| (1.5259) | (1.3021) | (0.9137) | |
| GDP | 0.1958*** | 0.5250*** | |
| (0.0339) | (0.0783) | ||
| Popu | -0.0316 | -0.0524 | |
| (0.0458) | (0.0525) | ||
| Temp | -0.0623 | 0.2992** | |
| (0.1295) | (0.1353) | ||
| Rain | 0.0389 | 0.1134** | |
| (0.0569) | (0.0479) | ||
| CPI | -0.2042 | 2.6796*** | |
| (0.1329) | (0.4473) | ||
| MF | 0.0785*** | 0.0088 | |
| (0.0083) | (0.0140) | ||
| LandRelief | 0.1220*** | 0.0576 | |
| (0.0444) | (0.0413) | ||
| Constant | 32.9809** | 41.7415*** | 18.4455** |
| (13.5204) | (11.5552) | (8.7709) | |
| Year FE | No | No | Yes |
| Country FE | No | No | Yes |
| Observations | 310 | 277 | 277 |
| Adj R-squared | 0.0076 | 0.4221 | 0.7829 |
Several mechanisms may explain the above findings. First, SLR is typically associated with an increased frequency and intensity of climate-related hazards, such as flooding, storm surges, and coastal erosion, which directly threaten the structural integrity and safety of housing in low-lying coastal areas. These risks elevate uncertainty and volatility in local housing markets, thereby exerting downward pressure on property values. Second, exposure to SLR-related risks undermines residents’ perceived physical, psychological, and financial security, amplifying risk perceptions associated with coastal living. As a result, households may relocate to less vulnerable areas, reducing demand for coastal properties. This out-migration can lead to distressed sales and declining transaction prices, further contributing to the observed decrease in housing values.
In addition, to account for potential spatial dependence in housing markets, we further employ a Spatial Durbin Model (SDM) to assess the robustness of the baseline estimates[43,44]. As reported in Table 3, the coefficient on SeaLevel remains negative and statistically significant, consistent with the baseline estimates. In contrast, the coefficients on the spatial lag terms are statistically insignificant. This pattern suggests that the housing market prices physical risks such as SLR in a predominantly localised manner, with limited evidence of spatial spillover or contagion effects from neighbouring cities.
Spatial econometric model
| Variables | Hprice |
| Sealevel | -2.3271** |
| (0.9166) | |
| WY | 0.0063 |
| (0.0928) | |
| WX | -0.0010 |
| (0.0837) | |
| GDP | 0.5927*** |
| (0.0807) | |
| Popu | -0.0512 |
| (0.0535) | |
| Temp | 0.3686*** |
| (0.1354) | |
| Rain | 0.1068** |
| (0.0441) | |
| CPI | 3.7300*** |
| (0.4805) | |
| MF | 0.0041 |
| (0.0143) | |
| LandRelief | 0.0241 |
| (0.0245) | |
| Constant | 6.1228 |
| (8.8852) | |
| Year FE | Yes |
| Country FE | Yes |
| Observations | 264 |
Results for island and non-island countries
The impact of SLR on housing prices in coastal cities is likely to vary across countries, reflecting differences in geographical characteristics, socio-economic conditions, and environmental contexts. Compared with non-island countries, island nations typically have lower average elevations and are therefore more exposed to sea-level-related risks[45]. This increased exposure renders coastal cities in island nations more vulnerable to SLR-related hazards. Consequently, housing prices in these cities are likely to be more volatile and more sensitive to changes in sea level. To examine this heterogeneity, we partition the sample into island and non-island countries and estimate Model (1) separately for each subgroup. Table 4 presents the results of these group-specific regressions. Column (1) reports the estimates for coastal cities in non-island countries, while Column (2) presents the corresponding results for coastal cities in island countries.
Heterogeneous impact for non-island countries versus island countries
| Variables | Hprice | |
| Non-island | Island | |
| (1) | (2) | |
| Sealevel | 0.3427 | -8.4136** |
| (1.0882) | (3.9857) | |
| GDP | 1.1925*** | 0.0310 |
| (0.1180) | (0.1039) | |
| Popu | -0.5271*** | -0.1225 |
| (0.0856) | (0.0763) | |
| Temp | 0.6607*** | 0.3739 |
| (0.1464) | (0.9178) | |
| Rain | 0.1682*** | 0.1146 |
| (0.0476) | (0.1286) | |
| CPI | 3.3028*** | 1.8124* |
| (0.4554) | (1.0260) | |
| MF | 0.0065 | 0.0110 |
| (0.0158) | (0.0165) | |
| LandRelief | 0.1157** | 0.0635 |
| (0.0453) | (0.0612) | |
| Constant | -17.3808 | 70.3037** |
| (10.6520) | (34.0592) | |
| Year FE | Yes | Yes |
| Country FE | Yes | Yes |
| Observations | 213 | 64 |
| Adj R-squared | 0.7829 | 0.9410 |
The results indicate that SLR does not exert a statistically significant effect on housing prices in coastal cities of non-island countries, whereas it has a pronounced negative impact in island nations. Specifically, a 1% increase in sea level is associated with an 8.41% decline in housing prices in coastal cities of island countries. This disparity likely reflects the lower elevation, more fragile infrastructure, and heightened sensitivity of housing markets to environmental risks in island contexts. These findings underscore the acute vulnerability of housing markets in island countries to climate change. By quantifying the economic consequences of SLR, this study highlights the severity of these vulnerabilities and reinforces the urgency of implementing effective adaptation and risk mitigation strategies to address the ongoing challenges posed by SLR and climate change.
Robustness tests
To assess the robustness of the main findings, we conduct several additional tests. First, we augment the baseline specification by including fiscal freedom (FF) and investment freedom (IF) to account for their potential influence on housing prices. Second, given that the global financial crisis (GFC) in 2008 may have induced abnormal fluctuations in 2009, particularly in housing markets, we exclude observations for 2009 and re-estimate the baseline model. The results are reported in Table 5. Columns (1-3) present estimates with the additional control variables, while Columns (4-6) report results after excluding 2009.
Results for the robustness tests
| Variables | Hprice | |||||
| Total | Non-island | Island | Total | Non-island | Island | |
| (1) | (2) | (3) | (4) | (5) | (6) | |
| Sealevel | -3.1125*** | 0.5139 | -7.3216* | -3.0790*** | 0.7290 | -7.3786* |
| (0.9346) | (1.0847) | (4.2174) | (0.9218) | (1.0958) | (4.0833) | |
| GDP | 0.4867*** | 1.1580*** | 0.0273 | 0.4953*** | 1.2005*** | 0.0439 |
| (0.0791) | (0.1160) | (0.1079) | (0.0800) | (0.1209) | (0.1054) | |
| Popu | -0.0261 | -0.5002*** | -0.1170 | -0.0440 | -0.5448*** | -0.0884 |
| (0.0529) | (0.0840) | (0.0786) | (0.0548) | (0.0872) | (0.0797) | |
| Temp | 0.3473** | 0.7176*** | 0.2013 | 0.3080** | 0.7428*** | 0.1824 |
| (0.1358) | (0.1439) | (0.9630) | (0.1411) | (0.1527) | (0.9497) | |
| Rain | 0.1136** | 0.1591*** | 0.1159 | 0.0914* | 0.1428*** | 0.1218 |
| (0.0469) | (0.0457) | (0.1339) | (0.0483) | (0.0474) | (0.1323) | |
| CPI | 3.6052*** | 4.2683*** | 1.5354 | 3.1225*** | 3.8633*** | 1.3477 |
| (0.4971) | (0.4989) | (1.0779) | (0.4738) | (0.4769) | (1.1662) | |
| MF | 0.0092 | 0.0105 | 0.0004 | 0.0188 | 0.0140 | 0.0173 |
| (0.0144) | (0.0161) | (0.0192) | (0.0153) | (0.0166) | (0.0171) | |
| LandRelief | 0.0483 | 0.0982** | 0.0585 | 0.0521 | 0.1082** | 0.0437 |
| (0.0411) | (0.0446) | (0.0632) | (0.0420) | (0.0458) | (0.0632) | |
| FF | 0.0070 | 0.0101 | -0.0107 | |||
| (0.0202) | (0.0238) | (0.0214) | ||||
| IF | -0.0209** | -0.0247*** | -0.0202 | |||
| (0.0082) | (0.0084) | (0.0146) | ||||
| Constant | 13.5517 | -23.6534** | 64.9110* | 15.1043* | -23.8481** | 63.4658* |
| (9.0943) | (10.7432) | (35.6673) | (9.0066) | (10.8800) | (34.9374) | |
| Year FE | Yes | Yes | Yes | Yes | Yes | Yes |
| Country FE | Yes | Yes | Yes | Yes | Yes | Yes |
| Observations | 257 | 197 | 60 | 256 | 197 | 59 |
| Adj R-squared | 0.7978 | 0.7956 | 0.9398 | 0.7853 | 0.7780 | 0.9451 |
Across all specifications, the coefficient on SeaLevel remains negative, consistent with the baseline and heterogeneity analyses. Notably, the estimated effects are statistically significant for the island subsample but remain insignificant for the non-island group.
Furthermore, we re-estimate the baseline models using a bootstrap procedure to mitigate potential small-sample bias. The results, reported in Supplementary Table 1, are highly consistent with the main findings. Overall, these robustness checks provide strong support for the conclusion that SLR significantly reduces housing prices in coastal cities, with particularly pronounced effects in island countries.
Endogeneity
To address potential endogeneity concerns, we adopt an instrumental variable (IV) approach. Fluctuations in sea surface conditions provide a comprehensive proxy for variations in oceanic processes, including changes in sea water volume, hydrospheric dynamics, crustal activity, and broader shifts in Earth’s morphology. Given that the ocean is in constant motion, sea levels exhibit continuous fluctuations over time[46]. These fluctuations occur over multiple temporal scales - including daily, seasonal, and annual cycles, as well as episodic events - and are primarily driven by factors such as waves, tides, atmospheric pressure, sea temperature, salinity, storms, and tsunamis. The magnitude of these variations is typically small and spatially localised[47]. In addition, long-term sea level variations occur over geological timescales, characterised by substantial changes that can extend across regional and even global scales[48].
Prior studies document a link between sea surface temperature (SST) anomalies and sea level, although the direction and magnitude of this relationship may vary across local contexts. First, SST anomalies influence seawater evaporation and ocean circulation, thereby affecting sea level dynamics. For example, warm currents are typically associated with enhanced evaporation and higher sea levels, whereas cold currents tend to reduce evaporation and are linked to lower sea levels[49]. Second, SST anomalies may affect marine ecosystems, potentially altering seawater density and related physical properties through changes in biological activity. These processes can, in turn, contribute to variations in sea level, although such effects are likely to be indirect and context-dependent[50]. Finally, SST anomalies influence ocean circulation and current dynamics, which can in turn affect regional sea level patterns. For example, warm currents are generally associated with higher sea levels, whereas cold currents tend to be linked to lower sea levels, although these effects are context-specific and may vary across regions[51].
Importantly, SST anomalies - treated as an exogenous variable in this study - are unlikely to be directly correlated with housing prices. SST anomalies are primarily driven by large-scale ocean-atmosphere interactions and natural climate variability, and are thus largely independent of city-level economic activity or housing market dynamics. This provides a strong basis for the exogeneity assumption underlying the instrumental variable[52]. Accordingly, we employ the annual average of SST anomalies in proximity to the 50 selected coastal cities as an instrumental variable in the two-stage least squares (2SLS) regression.
Data on sea surface temperature anomalies are sourced from Earth: A Global Map of Wind, Weather, and Ocean Conditions and AVHRR Pathfinder SST, a long-term Climate Data Record (1981 - present) based on the historic aspect of Pathfinder SST[53]. The data encompass global, twice-daily (Day and Night) 4km SST derived from measurements captured by Advanced Very High Resolution Radiometer (AVHRR) instruments aboard NOAA polar-orbiting satellites.
The results of the 2SLS regression displayed in Table 6 confirm that the instrumental variable passes both the relevancy test (P < 0.001) and the weak instrument test (Wald F statistic: 13.82, P < 0.001)[54]. The results of the second stage regression indicate that SLR exerts a significant impact on the housing prices of coastal cities. Full results are detailed in Supplementary Table 2.
Results for endogeneity analysis
| Hprice | |
| Variables | (1) |
| -9.6906** | |
| (4.0769) | |
| GDP | 0.5050*** |
| (0.1016) | |
| Popu | -0.0289 |
| (0.0635) | |
| Temp | -0.0464 |
| (0.2621) | |
| Rain | 0.1240*** |
| (0.0476) | |
| CPI | 2.2039*** |
| (0.8352) | |
| MF | 0.0089 |
| (0.0129) | |
| LandRelief | 0.1282** |
| (0.0549) | |
| Constant | 78.6594** |
| (35.8391) | |
| Year FE | Yes |
| Country FE | Yes |
| Observations | 275 |
| Adj R-squared | 0.2915 |
| Cragg-Donald Wald F statistic | 13.82*** |
House prices forecast
Simon Kofe, the Foreign Minister of Tuvalu, delivered a powerful and widely noted address on the climate crisis while standing knee-deep in seawater at the COP26 under the United Nations Framework Convention on Climate Change (UNFCCC). This striking visual intervention vividly illustrates the existential threat posed by rising sea levels: low-lying island nations face a heightened risk of inundation as sea levels continue to rise at an accelerating pace[55]. Leaders from other island nations have likewise issued strong appeals at the summit, urging the international community to recognise and address the disproportionate impacts of SLR on vulnerable island states.
Accordingly, we employ global sea level projections from the IPCC to forecast SLR-induced trends in housing prices for island and non-island countries, respectively[56]. This approach enables us to quantify the long-term socio-economic impacts of SLR, reinforce the importance of sustained global commitments to climate change mitigation, and derive policy-relevant insights for climate adaptation and economic planning in the face of rising sea levels and associated housing market adjustments.
Given that the extent of SLR differs across greenhouse gas concentration pathways, we adopt the mean sea level of the sample cities in 2010 as the baseline and project the corresponding proportional changes in housing prices through 2100 under alternative RCP scenarios - namely RCP2.6, RCP4.5, RCP6.0, and RCP8.5 - for island and non-island coastal cities, respectively [Figure 2].
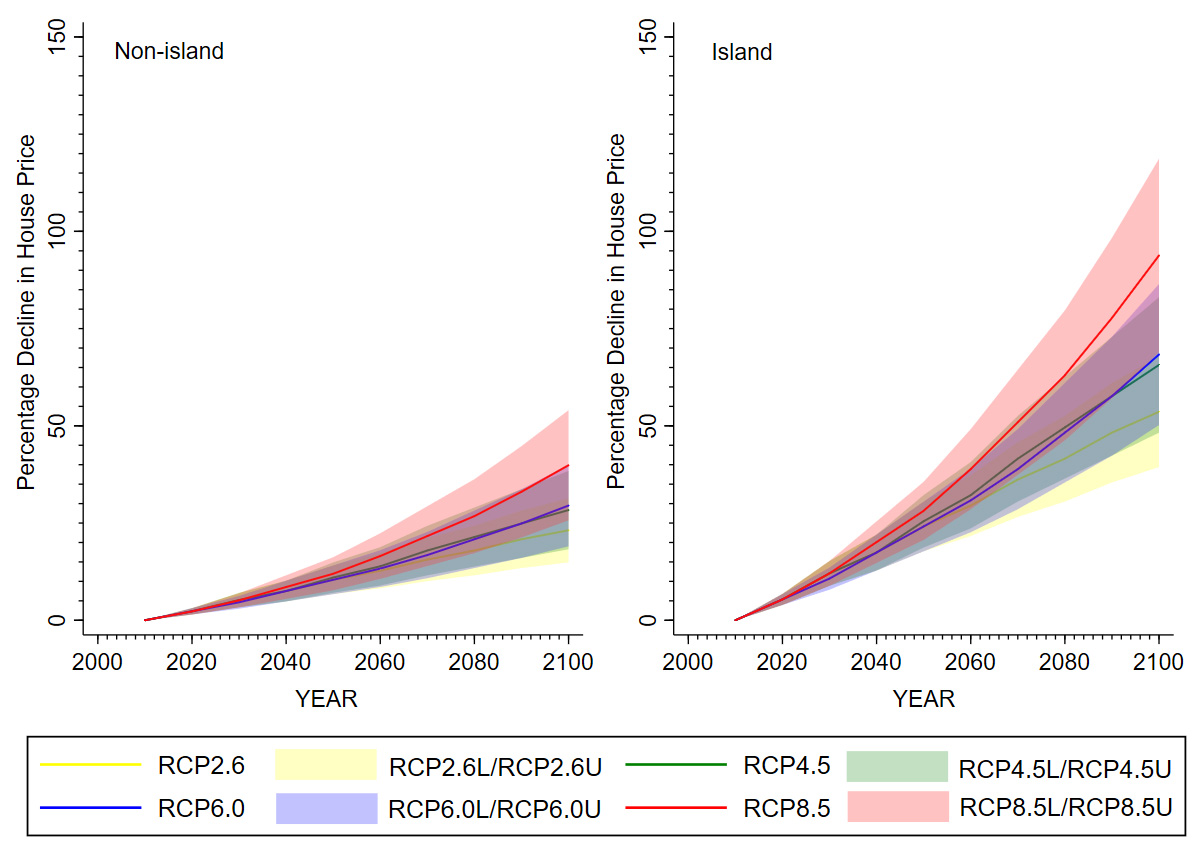
Figure 2. SLR-induced house price decline predictions for non-island versus island countries. RCP: Representative concentration pathway; SLR: sea level rise.
The results reveal two key patterns. First, housing prices in coastal cities exhibit nonlinear declines under all four RCP scenarios, with the magnitude of decline intensifying as greenhouse gas concentrations increase. Second, under a given scenario, the proportional reduction in housing prices is substantially larger in island countries than in non-island countries. For instance, under the RCP2.6 scenario, housing prices in coastal cities of island countries are projected to decline by 24.12% by 2050, compared with a 10.41% decline in non-island countries.
CONCLUSIONS AND OUTLOOK
Conclusions
SLR have profound environmental, social, and economic implications. Against this backdrop, we examine the impact of SLR on housing prices in the world’s 50 most economically developed coastal cities, and further explore how this effect differs between island and non-island countries. In addition, we project future SLR-induced housing price declines under alternative RCP scenarios for both groups. The findings yield four main conclusions. First, SLR exerts a statistically significant negative effect on housing prices in coastal cities. Second, this effect is more pronounced in island countries than in non-island countries. Third, as greenhouse gas concentrations increase, the adverse impact of SLR on housing prices is projected to intensify over the coming decades. Fourth, under a given emissions scenario, the proportional decline in housing prices is substantially larger for coastal cities in island countries relative to their non-island counterparts.
Building on our findings, we propose the following policy recommendations. First, there is an urgent need to strengthen sea-level monitoring systems and enhance adaptation capacity. Establishing a coordinated global monitoring network would enable real-time observation and comprehensive data collection. Governments, particularly in island nations, should undertake systematic risk assessments of SLR and associated climate hazards, while continuously updating and strengthening response strategies. In parallel, the development of harmonised monitoring standards and technical protocols is essential to ensure the accuracy, consistency, and comparability of sea-level data across countries, thereby facilitating effective international collaboration. These measures would enable coastal cities to respond more proactively to sea-level dynamics and better protect socio-economic assets.
Second, improving the climate resilience of housing markets is critical. Our results show that SLR and related climate risks generate substantial physical and economic disruptions, undermining the stability of local housing markets. Policymakers should therefore integrate both short- and long-term climate risks into urban planning and real estate development strategies. This includes strengthening risk monitoring, enhancing market stabilisation mechanisms, and advancing institutional reforms that align economic development with environmental sustainability.
Finally, housing market risk management policies should be tailored to local conditions, reflecting differences in vulnerability and resource endowments between island and non-island coastal cities. For island countries - characterised by low elevation, constrained land availability, and high exposure - targeted measures are required. These include zoning restrictions in high-risk areas, flood-resilient retrofitting of existing buildings, and financial support (e.g., subsidies or concessional loans) to facilitate relocation to safer locations. Fiscal, land-use, and infrastructure investment policies should also guide capital towards lower-risk areas to enhance adaptive capacity. In contrast, for non-island coastal cities, priority should be given to strengthening monitoring systems, upgrading flood-control infrastructure, and improving land-use efficiency. Complementary measures, such as community-level disaster preparedness, public awareness initiatives, and infrastructure investment, can further enhance resilience and mitigate the broader socio-economic impacts of SLR.
Outlook
Our research has important implications for both current literature and management. First, we extend the literature on environmental determinants of housing markets. While prior studies predominantly focus on single-country or regional settings, our cross-country evidence demonstrates that SLR significantly depresses housing prices in coastal cities. Furthermore, the pricing of climate risks exhibits strong localisation, with substantially larger effects observed in island countries than in non-island countries.
Second, we provide forward-looking evidence by projecting housing price dynamics under future SLR scenarios. The results suggest that, as greenhouse gas concentrations continue to increase, SLR-induced declines in housing prices are likely to accelerate over the coming decades.
Third, our findings carry important policy implications. They inform the design of macroeconomic and urban policy frameworks by highlighting the need to incorporate climate-related risks into housing market regulation and planning. At the same time, the results draw international attention to the heightened vulnerability of island nations. Policymakers should prioritise strengthening sea-level monitoring systems and enhancing the climate resilience of housing markets through the implementation of comprehensive mitigation and adaptation strategies.
Despite the above contributions, this study also encounters several limitations. First, data availability, particularly for sea level measurements, constrains the sample size. The analysis focuses primarily on the most economically developed coastal cities, with limited coverage of less developed or data-scarce regions, which may restrict the external validity and generalisability of the findings. Future research could expand the scope by incorporating coastal cities across different stages of economic development to improve representativeness and policy relevance. In addition, advances in sea-level measurement technologies, such as satellite, radar, and laser altimetry, will be critical in improving data coverage and quality. The integration of alternative data sources (e.g., reconstructions based on Earth’s gravity field, atmospheric pressure, and tidal dynamics) may further enrich datasets through simulation or inversion techniques. Future work should also pay greater attention to economically underdeveloped regions and examine how coastline changes affect broader economic systems. Promising research directions include the evaluation of adaptation strategies, such as improvements in transport and energy infrastructure, strengthened urban planning and governance, and enhanced building resilience.
Second, although the analysis establishes a significant relationship between SLR and housing prices, it does not fully identify the underlying mechanisms. SLR represents only one of several factors influencing housing market dynamics, and future research should more systematically investigate the channels through which SLR affects property values. This includes examining behavioural responses to climate risk, as well as the broader implications for natural ecosystems and socio-economic development. In particular, the roles of socio-economic pathways, adaptation and mitigation policies, and institutional governance merit further exploration. Overall, the relationship between SLR, market outcomes, and adaptive responses constitutes a complex and interdependent system. Advancing understanding in this area requires an integrated analytical framework that accounts for these interactions and supports informed decision-making in the context of increasing climate risk.
Third, the cross-national macro perspective adopted in this study does not imply the existence of a homogeneous “global housing market”. Housing prices are fundamentally determined by local supply-demand dynamics, and substantial heterogeneity exists across coastal housing markets worldwide. In particular, variations in residents’ risk perceptions, location preferences, and levels of economic development play a critical role in shaping the pricing of climate risks. As emphasised by Palm et al., responses to climate risk can differ markedly across markets[28]. Accordingly, focusing on a sample of major economically developed coastal cities worldwide is both appropriate and informative. By emphasising global patterns and overarching trends, this study provides a valuable macro-level perspective. Such an approach yields important insights for cross-country climate policy design, informs risk assessment by international institutional investors, and facilitates comparative analyses across regions.
DECLARATIONS
Authors’ contribution
Conceptualized and wrote the main manuscript text: Tian, J.; Wang, X.; Xue, R.
Data curation; supervised the work: Wang, Y.
Reviewed, edited, and supervised the work: Xue, R.; Shan, Y.
Availability of data and materials
Some of the research data used in this research work will be available upon request from the corresponding author.
AI and AI-assisted tools statement
During the preparation of this manuscript, the AI tool ChatGPT (version GPT-5, released 2025-08-07) was used only for language polishing and visualization support of this manuscript and to generate certain visual materials (house illustrations). The tool did not influence the study design, data collection, analysis, interpretation, or the scientific content of the work. All authors take full responsibility for the accuracy, integrity, and final content of the manuscript.
Financial support and sponsorship
This research was funded by the Major Program of the National Social Science Fund of China (Grant Number: 21&ZD153) and the Research on the Construction and Development Path of Shandong Province’s Digital Innovation Culture and Independent Knowledge System (Grant Number: 2025RZB0709).
Conflicts of interest
Shan, Y. is the Associate Editor of the Carbon Footprints journal. He had no involvement in the review or editorial process of this manuscript, including but not limited to reviewer selection, evaluation, or the final decision, while the other authors have declared that they have no conflicts of interest.
Ethical approval and consent to participate
Not applicable.
Consent for publication
Not applicable.
Copyright
© The Author(s) 2026.
Supplementary Materials
REFERENCES
1. Sarkodie, S. A.; Ahmed, M. Y.; Owusu, P. A. Global adaptation readiness and income mitigate sectoral climate change vulnerabilities. Humanit. Soc. Sci. Commun. 2022, 9, 113.
2. NOAA, 2020. Climate change: global sea level. https://www.climate.gov/news-features/understanding-climate/climate-change-global-sea-level (accessed 2026-05-06).
3. Marsooli, R.; Lin, N.; Emanuel, K.; Feng, K. Climate change exacerbates hurricane flood hazards along US Atlantic and Gulf Coasts in spatially varying patterns. Nat. Commun. 2019, 10, 3785.
4. Taherkhani, M.; Vitousek, S.; Barnard, P. L.; Frazer, N.; Anderson, T. R.; Fletcher, C. H. Sea-level rise exponentially increases coastal flood frequency. Sci. Rep. 2020, 10, 6466.
5. Addoum, J. M.; Ng, D. T.; Ortiz-bobea, A. Temperature shocks and industry earnings news. J. Financ. Econ. 2023, 150, 1-45.
6. Fujimoto, K.; Furukawa, K.; Ono, K.; Watanabe, S.; Eperiam, E. Effects of sea-level rise on blue carbon stocks of mangrove ecosystems: insights from Pohnpei Island, Federated States of Micronesia. Carbon. Footprints. 2023, 2, 15.
7. Yeung, H. C. H.; Pavelsky, T. M.; Wang, C.; et al. Overlooked and extensive ghost forest formation across the US Atlantic coast. Nat. Sustain. 2025, 8, 1445-54.
8. Edmonds, D. A.; Caldwell, R. L.; Brondizio, E. S.; Siani, S. M. O. Coastal flooding will disproportionately impact people on river deltas. Nat. Commun. 2020, 11, 4741.
9. Balboni, C. In Harm’s Way? Infrastructure Investments and the Persistence of Coastal Cities. Am. Econ. Rev. 2025, 115, 77-116.
10. Neumann, B.; Vafeidis, A. T.; Zimmermann, J.; Nicholls, R. J. Future coastal population growth and exposure to sea-level rise and coastal flooding - a global assessment. PLoS. ONE. 2015, 10, e0118571.
11. Chauhan, C.; Akram, M. U. Jahnavi Patky, .; Chauhan, A. Mapping pathways for building resilient supply chains: a systematic literature review. J. Clean. Prod. 2023, 425, 138701.
12. Hauer, M. E.; Evans, J. M.; Mishra, D. R. Millions projected to be at risk from sea-level rise in the continental United States. Nature. Clim. Change. 2016, 6, 691-5.
13. Robinson, C.; Dilkina, B.; Moreno-cruz, J. Modeling migration patterns in the USA under sea level rise. PLoS. ONE. 2020, 15, e0227436.
14. Giglio, S.; Maggiori, M.; Stroebel, J. Very long-run discount rates. Q. J. Econ. 2015, 130, 1-53.
15. Tebaldi, C.; Strauss, B. H.; Zervas, C. E. Modelling sea level rise impacts on storm surges along US coasts. Environ. Res. Lett. 2012, 7, 014032.
16. Declerck, M.; Trifonova, N.; Hartley, J.; Scott, B. Cumulative effects of offshore renewables: from pragmatic policies to holistic marine spatial planning tools. Environ. Impact. Assess. Rev. 2023, 101, 107153.
17. Zhuang, Y.; Xu, K.; Bin, L.; Wang, C.; Shen, R. Assessment of the jacking effect of high tide on compound flooding in a coastal city under sea level rise based on water tracer modeling. J. Hydrol. 2023, 627, 130474.
18. Talwar, S.; Dhir, A.; Luqman, A.; Gupta, J.; Gugnani, R. Charting the path toward a greener world: a review of facilitating and inhibiting factors for carbon neutrality. J. Clean. Prod. 2023, 423, 138423.
19. Ortega, F.; Taṣpınar, S. Rising sea levels and sinking property values: Hurricane Sandy and New York’s housing market. J. Urban. Econ. 2018, 106, 81-100.
20. Berman, M.; Baztan, J.; Kofinas, G.; et al. Adaptation to climate change in coastal communities: findings from seven sites on four continents. Clim. Change. 2019, 159, 1-16.
21. Chang, Y.; Liu, S.; Zhang, X. The construction of global maritime capital-current development in China. Marine. Policy. 2023, 151, 105576.
23. Duijndam, S. J.; Botzen, W. J. W.; Hagedoorn, L. C.; Aerts, J. C. J. H. Anticipating sea‐level rise and human migration: a review of empirical evidence and avenues for future research. WIREs. Clim. Change. 2021, 13, e747.
24. Glaeser, E. L.; Gyourko, J. Urban decline and durable housing. J. Polit. Econ. 2005, 113, 345-75.
25. Sheng, D.; Meng, X.; Wen, X.; et al. Hydrochemical characteristics, quality and health risk assessment of nitrate enriched coastal groundwater in northern China. J. Clean. Prod. 2023, 403, 136872.
26. Haddad, E. A.; Teixeira, E. Economic impacts of natural disasters in megacities: the case of floods in São Paulo, Brazil. Habitat. Int. 2015, 45, 106-13.
27. Fang, X.; Zhang, Y.; Xiang, Y.; et al. A spatial model for coastal flood susceptibility assessment using the 2D-SPR method with complex network theory: A case study of a reclamation island in Zhoushan, China. Environ. Impact. Assess. Rev. 2023, 98, 106953.
28. Palm, R.; Bolsen, T. Housing market response to sea-level rise in Florida, 1th ed.; Cham, Switzerland: Springer, 2022.
29. Beltrán, A.; Maddison, D.; Elliott, R. The impact of flooding on property prices: a repeat-sales approach. J. Environ. Econ. Manage. 2019, 95, 62-86.
30. Liang, T.; Ma, W.; Shao, J.; Gao, X.; Luo, J.; Fan, K. Evolution of urban green space carbon sinks and their value in the arid region of Northwest China. Carbon. Footprints. 2025, 4, 20.
31. Bernstein, A.; Gustafson, M. T.; Lewis, R. Disaster on the horizon: the price effect of sea level rise. J. Financ. Econ. 2019, 134, 253-72.
32. Shan, Y.; Ou, J.; Wang, D.; et al. Impacts of COVID-19 and fiscal stimuli on global emissions and the Paris Agreement. Nat. Clim. Chang. 2020, 11, 200-6.
33. Pondorfer, A. The perception of climate change: Comparative evidence from the small-island societies of Bougainville and Palawan. Environ. Dev. 2019, 30, 21-34.
34. Cevik, S.; Jalles, J. T. This changes everything: climate shocks and sovereign bonds. Energy. Econ. 2022, 107, 105856.
35. Pathak, A.; Van Beynen, P. E.; Akiwumi, F. A.; Lindeman, K. C. Impacts of climate change on the tourism sector of a small island developing state: a case study for the Bahamas. Environ. Dev. 2021, 37, 100556.
36. Casals Miralles, C.; Barioni, D.; Mancini, M. S.; et al. The Footprint of tourism: a review of water, carbon, and ecological footprint applications to the tourism sector. J. Clean. Prod. 2023, 422, 138568.
37. Tian, J.; Yu, L.; Xue, R.; Zhuang, S.; Shan, Y. Global low-carbon energy transition in the post-COVID-19 era. Appl. Energy. 2022, 307, 118205.
38. Tóth, A.; Suta, A.; Pimentel, J.; Argoti, A. A comprehensive, semi-automated systematic literature review (SLR) design: application to P-graph research with a focus on sustainability. J. Clean. Prod. 2023, 415, 137741.
39. Prall, M.; Olazabal, M.; Lehmann, M. Socio-economic projections in urban climate change adaptation planning: practices and prospects for just adaptation. Habitat. Int. 2023, 142, 102946.
40. Menéndez, P.; Losada, I. J.; Torres-ortega, S.; Narayan, S.; Beck, M. W. The global flood protection benefits of mangroves. Sci. Rep. 2020, 10, 4404.
41. Chan, F.; Chuah, C. J.; Ziegler, A.; Dąbrowski, M.; Varis, O. Towards resilient flood risk management for Asian coastal cities: Lessons learned from Hong Kong and Singapore. J. Clean. Prod. 2018, 187, 576-89.
42. Busby, J. Warming world: why climate change matters more than anything else. Foreign. Aff. 2018, 97, 49-55. https://www.jstor.org/stable/44822212 (accessed 2026-05-06).
43. Egger, P.; Pfaffermayr, M.; Winner, H. An unbalanced spatial panel data approach to US state tax competition. Econ. Lett. 2005, 88, 329-35.
44. Zhou, Y. G.; Tang, C. W.; Xu, X. B. Spillover effects of price limits on China stock market-based on spatial Durbin model with time-varying weight matrices. Syst. Eng. Theory. Pract. 2025, 45, 463-80.
45. Shepard, C. C.; Agostini, V. N.; Gilmer, B.; et al. Assessing future risk: quantifying the effects of sea level rise on storm surge risk for the southern shores of Long Island, New York. Nat. Hazards. 2011, 60, 727-45.
46. Rojas, O.; Soto, E.; Rojas, C.; López, J. J. Assessment of the flood mitigation ecosystem service in a coastal wetland and potential impact of future urban development in Chile. Habitat. Int. 2022, 123, 102554.
47. Lahijani, H.; Leroy, S.; Arpe, K.; Crétaux, J. Caspian Sea level changes during instrumental period, its impact and forecast: a review. Earth. Sci. Rev. 2023, 241, 104428.
48. Sames, B.; Wagreich, M.; Wendler, J.; et al. Review: short-term sea-level changes in a greenhouse world - a view from the cretaceous. Palaeogeogr. Palaeoclimatol. Palaeoecol. 2016, 441, 393-411.
49. Bulgin, C. E.; Merchant, C. J.; Ferreira, D. Tendencies, variability and persistence of sea surface temperature anomalies. Sci. Rep. 2020, 10, 7986.
50. Sanchez-cabeza, J.; Herrera-becerril, C. A.; Carballo, J. L.; et al. Rapid surface water warming and impact of the recent (2013-2016) temperature anomaly in shallow coastal waters at the eastern entrance of the Gulf of California. Prog. Oceanogr. 2022, 202, 102746.
51. Hand, R.; Keenlyside, N. S.; Omrani, N.; Bader, J.; Greatbatch, R. J. The role of local sea surface temperature pattern changes in shaping climate change in the North Atlantic sector. Clim. Dyn. 2018, 52, 417-38.
52. Deser, C.; Alexander, M. A.; Xie, S.; Phillips, A. S. Sea surface temperature variability: patterns and mechanisms. Annu. Rev. Mar. Sci. 2010, 2, 115-43.
53. Saha, K.; Zhao, X.; Zhang, H. M.; et al. AVHRR Pathfinder version 5.3 level 3 collated (L3C) global 4km sea surface temperature for 1981-2023. NOAA National Centers for Environmental Information. Dataset. https://doi.org/10.7289/v52j68xx (accessed 2026-05-08).
54. Kleibergen, F.; Paap, R. Generalized reduced rank tests using the singular value decomposition. J. Econom. 2006, 133, 97-126.
55. CNBC, 2021. Pacific island minister films climate speech knee-deep in the ocean. https://www.cnbc.com/2021/11/08/tuvalu-minister-gives-cop26-speech-knee-deep-in-the-ocean-to-highlight-rising-sea-levels.html (accessed 2026-05-06).
56. IPCC, 2013. Climate change 2013: the physical science basis. Contribution of Working Group I to the Fifth Assessment Report of the Intergovernmental Panel on Climate Change. Cambridge University Press, Cambridge, United Kingdom and New York, NY, USA, pp 1535. https://www.ipcc.ch/report/ar5/wg1/ (accessed 2026-05-06).
Cite This Article
How to Cite
Download Citation
Export Citation File:
Type of Import
Tips on Downloading Citation
Citation Manager File Format
Type of Import
Direct Import: When the Direct Import option is selected (the default state), a dialogue box will give you the option to Save or Open the downloaded citation data. Choosing Open will either launch your citation manager or give you a choice of applications with which to use the metadata. The Save option saves the file locally for later use.
Indirect Import: When the Indirect Import option is selected, the metadata is displayed and may be copied and pasted as needed.
About This Article
Copyright

Data & Comments
Data
0


Comments
Comments must be written in English. Spam, offensive content, impersonation, and private information will not be permitted. If any comment is reported and identified as inappropriate content by OAE staff, the comment will be removed without notice. If you have any queries or need any help, please contact us at support@oaepublish.com.