



Coordinated reduction of pollutant and carbon emissions through smart city construction: TOE-based mechanisms and spatial spillovers in China
 0
0  ,
, Abstract
The coordinated reduction of pollutant and carbon emissions (CRPC) has become a central objective of urban environmental governance. Although smart city construction is primarily intended to advance digital urban transformation, its role in CRPC remains insufficiently understood. Using panel data for 259 prefecture-level cities in China from 2006 to 2022, this study examines whether smart city construction promotes CRPC. Exploiting the staggered rollout of the national smart city pilot policy, we estimate a multi-period difference-in-differences (DID) model to identify the policy effect. The results show that smart city construction significantly reduces both sulfur dioxide emission intensity and carbon emission intensity, indicating a clear CRPC effect. The findings remain robust to parallel-trend tests, placebo tests, propensity score matching, alternative variable specifications, and the inclusion of additional policy controls. Mechanism analyses based on the technology-organization-environment (TOE) framework show that smart city construction promotes CRPC by stimulating green innovation and digital infrastructure development, advancing industrial upgrading and human capital accumulation, and strengthening ecological investment and pollution control capacity. Further analyses indicate that the effect is stronger in cities with more stringent environmental regulation, in growing cities, and in non-resource-based cities. Smart city construction also generates positive spillover effects across geographically proximate and economically connected cities. Overall, the findings show that smart city construction can serve as an important pathway toward integrated pollution and carbon governance.
Keywords
INTRODUCTION
Climate change and air pollution have become increasingly intertwined challenges in urban governance[1]. Although cities occupy less than 0.34% of the world’s land area, they concentrate 56% of the global population and generate over 70% of carbon emissions and 80% of air pollutants as of 2020. With UN-Habitat projecting that the urban population will reach 68% by 2050, cities have emerged as the primary nodes determining the success of international mitigation efforts. As a leading emitter of both carbon and sulfur dioxide, China has responded with decisive policy measures, most notably the 2022 “Implementation Plan for Coordinated Reduction of Pollution and Carbon Emissions” co-issued by the Ministry of Ecology and Environment and six other agencies. Furthermore, the policy agenda has gradually shifted from separate pollution control and carbon mitigation toward more integrated governance[1,2]. Identifying policy instruments capable of generating coordinated environmental gains has thus become an important research and policy issue.
Among the emerging policy instruments, smart city construction has attracted growing attention. Smart city programs seek to improve urban operation and public service delivery through digital infrastructure, data integration, and intelligent management systems. These changes may contribute to coordinated reduction of pollutant and carbon emissions (CRPC) by improving environmental monitoring, enhancing energy efficiency, supporting cleaner production, and strengthening the responsiveness of local governance[3-5]. CRPC refers to the synergistic governance process in which a single policy, technology, or management measure simultaneously achieves reductions in both conventional air pollutants and greenhouse gas emissions through common emission sources, shared governance pathways, and integrated policy objectives. Unlike traditional pollution control or carbon mitigation strategies that target environmental quality or climate change separately, CRPC emphasizes the coordinated realization of both objectives under a unified governance framework, thereby generating a synergistic effect in which the overall environmental benefits exceed those achieved by addressing pollution control and carbon reduction independently. However, whether smart city construction generates a measurable co-reduction effect remains insufficiently established.
Existing studies provide important insights, but several limitations remain. First, much of the literature examines carbon reduction and pollution abatement separately[6-8], making it difficult to determine whether a policy can produce coordinated environmental benefits. Second, empirical evidence on co-reduction has focused mainly on policies explicitly designed for environmental regulation, such as low-carbon pilots, emissions trading, and air pollution control[9-13], while the environmental consequences of broader digital governance reforms are less well understood. Third, studies on smart cities have largely emphasized economic performance, innovation outcomes, or single environmental indicators[14-17], with limited attention to the mechanisms through which digital governance affects integrated environmental performance and insufficient consideration of spillover effects across cities.
To address these gaps, this study examines the impact of China’s smart city pilot policy on CRPC using panel data for 259 prefecture-level cities from 2006 to 2022. Exploiting the staggered rollout of the policy, we employ a multi-period difference-in-differences (DID) model to identify the causal effect of smart city construction. We further draw on the technology-organization-environment (TOE) framework to examine the channels through which smart city construction affects co-reduction. Specifically, we test whether the policy operates through green innovation and digital infrastructure development in the technology dimension, through industrial upgrading and human capital accumulation in the organization dimension, and through ecological investment and pollution control capacity in the environment dimension. In addition, we examine whether the effects of smart city construction extend beyond pilot cities through spatial spillovers.
This study contributes to the literature in three respects. First, it links the smart city literature with the CRPC and provides city-level evidence on whether digital governance can generate coordinated environmental benefits. Second, it develops a unified analytical framework connecting technological progress, organizational adjustment, and environmental governance to the CRPC, thereby offering a more systematic explanation of how smart city construction shapes environmental performance. Third, by examining heterogeneity and spatial spillovers, the study clarifies the conditions under which smart city construction is most effective and highlights its implications for regional coordination in urban environmental governance.
The remainder of this paper is organized as follows. Section 2 reviews the related literature. Section 3 develops the theoretical framework and research hypotheses. Section 4 presents the empirical design, variable definitions, and data sources. Section 5 reports the baseline results, robustness checks, heterogeneity analysis, mechanism tests, and discussion. Section 6 examines the spatial spillover effects of smart city construction. Section 7 concludes.
LITERATURE REVIEW
Coordinated reduction of pollutant and carbon emissions
The conceptual framework of “co-benefits” was pioneered by the Intergovernmental Panel on Climate Change (IPCC) in its Third Assessment Report, initially defined as the non-climate advantages - such as enhanced air quality - accruing from greenhouse gas mitigation policies. This definition has since evolved into a more dynamic understanding of the bidirectional synergy between climate mitigation and local pollutant control[18]. CRPC has become an important theme in environmental economics and urban sustainability research. The core idea is that, because conventional air pollutants and greenhouse gas emissions often share common sources, especially fossil fuel combustion, policies that alter energy use, industrial production, and transport systems may generate simultaneous environmental benefits[2]. In the context of China, this issue is particularly important because the country has long faced the dual challenge of carbon mitigation and local air pollution control, while its industrial structure and energy system create substantial overlap in the sources of both types of emissions[19,20].
Existing studies show that the effectiveness of CRPC depends on a range of economic, technological, and institutional factors. Economically, the achievement of co-reduction is contingent upon robust financial investment and the fundamental configuration of the urban economy[18]; specifically, industrial gross domestic product (GDP) scale and the sophistication of the industrial structure are decisive factors in determining emission intensity[10,21,22]. Furthermore, the interaction between financing constraints and pollutant emission levies has been found to trigger a clean energy substitution effect, which further amplifies these environmental synergies[20,23]. Within the energy dimension, there is a broad consensus that clean energy deployment, enhanced energy efficiency, and structural optimization of the energy mix constitute the core technical drivers for elevating synergistic performance[22,24-27]. From a policy perspective, including low-carbon pilot programs, emissions trading systems, and air pollution prevention policies, have been shown to improve co-reduction performance by promoting cleaner production, optimizing energy allocation, and encouraging green innovation[9-12].
Although this literature has generated important insights, two limitations remain. First, many studies focus on environmental policies explicitly designed for pollution control or carbon mitigation, while less attention has been paid to broader urban governance reforms that may generate indirect environmental benefits. Second, the mechanisms underlying co-reduction are often examined from a single perspective, such as energy structure or innovation, without integrating technological, organizational, and institutional dimensions into a unified analytical framework. These limitations suggest the need to examine whether urban digital governance, particularly smart city construction, can contribute to coordinated environmental improvement and through what channels.
Smart city construction and environmental performance
The smart city concept generally refers to the use of digital infrastructure, information networks, and intelligent management systems to improve urban operation, public services, and governance capacity[28]. Recent studies suggest that smart city construction may also have environmental consequences. By strengthening information sharing, increasing monitoring capacity, improving resource allocation, and facilitating data-driven decision-making, smart city programs may reduce energy waste, improve pollution control efficiency, and support low-carbon urban development[28-31].
Empirical research has provided preliminary evidence that smart city construction can improve environmental quality, promote green innovation, support industrial upgrading, and enhance energy efficiency[32,33]. However, the existing evidence remains fragmented in three respects. First, many studies examine single outcomes, such as carbon emissions, air quality, or green total factor productivity, rather than CRPC. Second, the literature tends to emphasize average treatment effects while paying less attention to heterogeneity across cities with different regulatory conditions, growth stages, or resource endowments. Third, spatial interdependence has not been sufficiently explored, even though digital governance, industrial relocation, and technology diffusion may generate environmental spillovers across connected cities.
TOE framework and its relevance to this study
The TOE framework provides a useful perspective for understanding how policy interventions translate into measurable outcomes. The framework argues that the adoption and effectiveness of innovation are jointly shaped by technological conditions, organizational capacity, and the external environment[34]. Because smart city construction is not merely a technological project but also a governance reform embedded in institutional and socioeconomic contexts, the TOE framework is well suited to analyze its environmental implications.
Unlike prescriptive models that dictate specific outcomes, the TOE framework serves as a versatile taxonomy, offering clear structural boundaries and highly extensible variables[35]. In the environmental field, previous studies have applied the TOE framework to examine green innovation, low-carbon transition, energy efficiency improvement, and sustainable supply-chain management[36-39]. These studies suggest that environmental outcomes are rarely driven by technology alone. Instead, they depend on the interactions among technological upgrading, organizational adaptation, and external environmental conditions[40]. This insight is particularly relevant to the present study. Smart city construction may improve co-reduction not only by expanding digital infrastructure and innovation capacity, but also by reshaping industrial organization, enhancing human capital, and strengthening ecological governance and pollution control.
In summary, the existing literature indicates that smart city construction may influence environmental performance, but it does not yet provide sufficient evidence on whether such policies promote CRPC, through which mechanisms this occurs, and whether the effects extend beyond pilot cities. This study addresses these questions by combining a city-level quasi-natural experiment with a TOE-based analytical framework. Compared with conventional mechanism analyses that typically focus on a single transmission channel, such as technological innovation, industrial upgrading, or environmental regulation, the TOE framework provides a more comprehensive perspective by integrating technological conditions, organizational capacity, and external environmental support into a unified analytical system. Smart city construction is essentially a complex governance reform involving digital technologies, institutional coordination, industrial transformation, and environmental governance simultaneously. Therefore, relying on a single mechanism may overlook the interactions among different dimensions. The TOE framework enables this study to systematically examine multiple transmission channels and better explain how smart city construction promotes the coordinated reduction of pollutant and carbon emissions.
THEORETICAL ANALYSIS AND RESEARCH HYPOTHESES
Smart city construction is expected to influence CRPC by changing how cities collect information, allocate resources, organize production, and implement environmental governance. Unlike conventional environmental policies that directly target emissions, smart city policy operates through digital transformation and institutional modernization. Its environmental effects therefore need to be understood through a broader analytical framework. Following the TOE perspective, this study argues that smart city construction can promote co-reduction through direct policy effects and through a set of interrelated technological, organizational, and environmental channels.
Direct effect of smart city construction on co-reduction
As a transformative strategic trajectory for modern urban evolution, smart city construction leverages cutting-edge information technologies to fundamentally reconfigure urban governance paradigms. This shift significantly enhances the efficiency of resource allocation and utilization, fostering agglomeration effects that provide tech-enabled solutions to deep-seated urban challenges[3,41]. Consequently, this systemic optimization offers a potent catalyst for environmental governance, facilitating a transition toward the coordinated management of pollution and carbon emissions.
The impact of smart city construction on CRPC is manifested through four interconnected pillars: smart economy, smart ecology, smart governance, and smart living. Within the smart economy, the digitalization of urban financial systems and the growth of the digital economy have been empirically shown to bolster environmental sustainability[42-44]. This economic vitality enhances a city’s capacity to invest in advanced transportation and telecommunication infrastructures, which underpin long-term green development[45]. Parallel to this, smart ecology integrates intelligent energy systems and sophisticated regulatory strategies to accelerate renewable energy adoption and optimize energy efficiency. By curbing the environmental externalities of excessive energy consumption, these systems establish a rigorous technical foundation for urban CRPC[28,46,47]. Furthermore, core ecological components such as expanded green coverage and intelligent waste management protocols provide natural pathways for simultaneous pollution and carbon mitigation[48].
In the realm of smart governance, the effectiveness of CRPC is highly contingent upon governmental priorities and institutional motivation. Increased administrative emphasis on environmental protection, coupled with enhanced public service motivation among officials, has been shown to yield superior governance outcomes[49,50]. The deployment of specialized technologies, such as remote sensing for aquatic ecosystem monitoring, further provides the precision required for sustainable environmental management[50]. Finally, smart living initiatives drive a cultural shift toward ecological civilization. By integrating big data analytics into intelligent transportation systems, smart cities alleviate urban congestion and optimize public transit networks[51]. These advancements, combined with digital platforms that promote sustainable household consumption and green travel preferences, effectively reduce indirect emissions and cultivate low-carbon lifestyles among residents[4,52,53].
Nevertheless, the co-reduction effect of smart city construction is not unconditional. Improvements in digital infrastructure and energy efficiency may lower production costs and stimulate additional economic activities, thereby increasing energy demand and partially offsetting the expected environmental benefits through the energy rebound effect[54]. Consequently, the net environmental effect of smart city construction depends on whether technological progress and governance improvements outweigh the potential rebound effect. In the Chinese context, where smart city policies emphasize green digital transformation, environmental regulation, and industrial restructuring simultaneously, the overall effect is expected to remain positive.
Taken together, these changes suggest that smart city construction may promote CRPC rather than improving only one environmental dimension. On this basis, we propose the following hypothesis:
Hypothesis 1: Smart city construction significantly promotes CRPC.
Indirect effects under the TOE framework
Technology dimension
The first set of mechanisms operates through technological change, smart city construction may create favorable conditions for green innovation[55]. The integration of digital technologies, improved data accessibility, and increased knowledge exchange can foster collaboration among governments, firms, and research institutions, creating an innovation environment conducive to the development and diffusion of cleaner production technologies, energy-saving processes, and low-carbon solutions[12,47]. Green innovation has the potential to reduce emissions at the source by improving production efficiency, lowering dependence on pollution-intensive production modes, and promoting technological substitution toward cleaner and more sustainable development pathways[45,56].
As a key component of urban digital transformation, smart city construction also emphasizes the deployment of digital infrastructure and the application of information technologies in urban governance[4,57]. Through investments in communication networks, data platforms, sensing technologies, and intelligent management systems, smart city initiatives may strengthen the digital foundation for environmental governance. These technologies improve the collection, transmission, and processing of environmental information, thereby providing technical support for pollution monitoring, energy management, and urban regulation[45,48]. At the operational level, technological upgrading enables real-time energy monitoring, intelligent scheduling, and data-driven process optimization, thereby reducing energy waste and improving energy-use efficiency[55]. Moreover, enhanced digital infrastructure can facilitate information sharing across government departments and reduce coordination costs, thereby improving the efficiency of environmental governance and the deployment of environmental technologies.
Taken together, by fostering green innovation and strengthen digital infrastructure, smart city construction may enhance cities’ technological capacity for integrated environmental governance. These technological improvements are expected to serve as potential transmission channels through which smart city construction facilitates CRPC.
Accordingly, we propose:
Hypothesis 2: Smart city construction may promote CRPC through the potential transmission channels of green innovation and digital infrastructure construction.
Organization dimension
The second set of mechanisms operates through organizational adjustment within the urban economy. Smart city construction promotes the deep integration of digital technologies into urban economic activities and governance systems, creating favorable conditions for organizational transformation. By facilitating the development of digital industries, improving resource allocation, and supporting the growth of high-value-added and knowledge-intensive sectors, smart city construction may accelerate industrial upgrading while reducing the relative importance of pollution-intensive activities[15,55,59]. As digital technologies become increasingly embedded in production and management, firms may be encouraged to improve operational efficiency, modernize production processes, and adopt cleaner and more innovative industrial practices. Such structural transformation has the potential to improve resource utilization efficiency while reducing both conventional pollutant emissions and carbon intensity[31,60].
Smart city construction may also contribute to the optimization of human capital by creating more attractive environments for skilled workers and innovation-oriented activities[61]. The expansion of digital governance systems, smart industries, and innovation platforms increases demand for highly skilled labor and may facilitate the attraction and retention of educated workers, technical professionals, and innovative talent in pilot cities[45]. An improved human capital base can facilitate the adoption of advanced technologies, strengthen environmental awareness, and enhance cities’ capacity to design and implement complex governance tasks[60,62,63]. By promoting both industrial upgrading and human capital accumulation, smart city construction may strengthen cities’ organizational capacity for sustainable development. These organizational improvements are therefore expected to serve as potential transmission channels through which smart city construction facilitates CRPC.
Therefore, we propose:
Hypothesis 3: Smart city construction may facilitate CRPC through the potential transmission channels of industrial structure upgrading and human capital optimization.
Environmental dimension
The third set of mechanisms operates through improvements in urban environmental governance. By integrating digital technologies into environmental management and public decision-making, smart city construction may create more favorable conditions for ecological governance and pollution control[64]. Through enhanced planning capacity, improved information transparency, and more efficient allocation of public resources, smart city initiatives may strengthen ecological investment and support the implementation of urban greening programs[65]. The application of digital governance tools further enables local governments to identify ecological weaknesses, monitor the implementation of environmental projects, and incorporate ecological objectives into urban development strategies in a more timely and coordinated manner. Increased investment in urban greening and ecological construction has the potential to improve environmental quality, enhance carbon sequestration capacity, and create conditions conducive to long-term low-carbon transformation[46,66].
Smart city construction may also enhance pollution control capacity by supporting intelligent environmental governance[31]. The deployment of real-time monitoring systems, intelligent sensing technologies, cross-departmental information sharing, and data-driven enforcement can improve the precision and responsiveness of environmental regulation while reducing the cost of environmental supervision[67-69]. These improvements may encourage greater compliance among firms, strengthen the treatment of environmental externalities, and facilitate the more effective implementation of pollution control policies. As environmental governance becomes more timely, targeted, and transparent, cities may be better positioned to simultaneously reduce conventional air pollutants and carbon emissions. Taken together, by promoting ecological construction and strengthening pollution control capacity, smart city construction may enhance cities’ environmental governance capability[70]. These environmental improvements are therefore expected to serve as potential transmission channels through which smart city construction facilitates CRPC.
Accordingly, we propose:
Hypothesis 4: Smart city construction may promote CRPC through the potential transmission channels of ecological construction and pollution control capacity.
The mechanism flowchart of this study is presented in Figure 1.
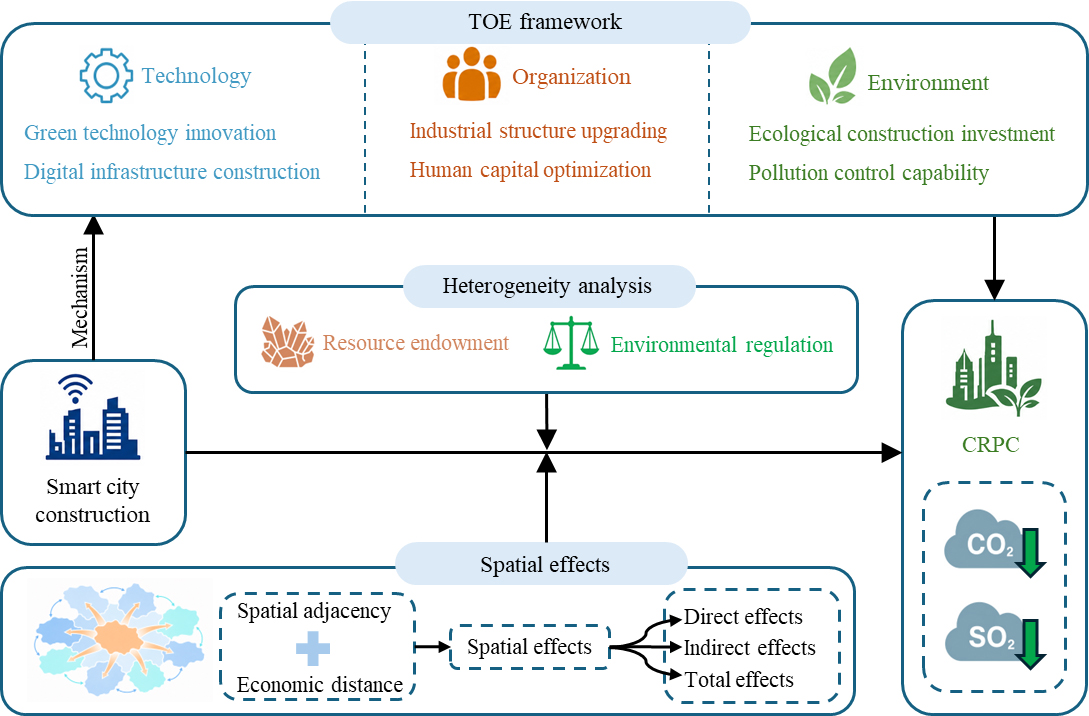
Figure 1. Research framework. TOE: Technology-organization-environment; CRPC: coordinated reduction of pollutant and carbon emissions.
EMPIRICAL DESIGN
Models
China’s smart city pilot program was organized into three annual pilot cohorts, officially designated as the 2012, 2013, and 2014 batches. This study treats these three batches of smart city pilots as quasi-natural experiments and adopts a multi-period DID model, following the approach of[71], to empirically examine the impact of smart city construction on the coordinated reduction of pollutant and carbon emissions. The baseline econometric model is specified as follows:
We estimate the following baseline models:
where SO2,it represents the SO2 emission intensity of city i in year t; CO2,it denotes the carbon emission intensity of city i in year t; DIDit is a dummy variable that equals 1 if city i started the smart city pilot in year t, and 0 otherwise; Controlit refers to a set of control variables; λi represents city fixed effects, μt denotes time fixed effects, εit is the stochastic error term. The core coefficients of interest are β1 and β2. During the empirical testing process, four possible scenarios may arise:
Scenario I: β1 > 0, β2 > 0;
Scenario II: β1 > 0, β2 < 0;
Scenario III: β1 < 0, β2 > 0;
Scenario IV: β1 < 0, β2 < 0.
A significant synergistic effect of pollution and carbon reduction is considered to exist only when Scenario IV is observed and the coefficients are statistically significant.
To further investigate the mechanism through which smart city construction affects the coordinated reduction of pollutant and carbon emissions, this study draws on the research of[72] and establishes the following mediating effect model based on TOE framework:
where yit represents the dependent variable, which includes SO2,it sulfur dioxide emission intensity and CO2,it carbon dioxide emission intensity; Mit denotes the mediating variable. All other variables remain consistent with those defined in the baseline regression.
Variables
Dependent variable
Building on the methodology of[73], this study employs both CO2 and SO2 emissions to assess the synergy between pollution and carbon reduction. This study selects CO2 and SO2 as representative indicators of carbon emissions and conventional air pollution, respectively. The selection is supported by both theoretical and practical considerations. First, CO2 is the principal greenhouse gas responsible for climate change and serves as the core indicator for evaluating carbon mitigation performance. SO2, as one of the most important conventional air pollutants in China, has long been a key target of environmental regulation due to its significant contribution to acid rain and atmospheric pollution.
More importantly, CO2 and SO2 exhibit a high degree of source homology. Both are primarily generated through fossil fuel combustion, especially coal consumption in power generation, industrial production, and energy-intensive manufacturing[2]. Consequently, measures such as energy efficiency improvement, industrial upgrading, clean energy substitution, and digital environmental governance can simultaneously reduce the emissions of both pollutants. This common emission source provides the physical and economic basis for CRPC.
The simultaneous reduction of SO2 and CO2 reflects the coordinated governance of conventional air pollutants and greenhouse gas emissions rather than the independent reduction of two environmental indicators. Under the TOE framework, smart city construction enhances technological capability through digital infrastructure and green innovation, improves organizational efficiency through industrial upgrading and human capital accumulation, and strengthens environmental governance through ecological construction and pollution control. These technological, organizational, and environmental improvements jointly optimize resource allocation, improve production efficiency, strengthen environmental regulation, and promote green transformation, thereby simultaneously reducing emissions of both conventional air pollutants and greenhouse gases. Therefore, the concurrent decline in SO2 and CO2 represents the observable outcome of coordinated governance achieved through multiple integrated pathways, which is consistent with the theoretical connotation of CRPC.
To better capture the dynamic relationship between economic activity and environmental impact, and to overcome the limitations of absolute emission metrics, this paper utilizes two relative indicators-SO2 emission intensity and carbon emission intensity-to characterize CRPC performance.
(1) Pollutant Emission Level (SO2). SO2 emission intensity serves as the proxy variable, representing one of the key industrial pollutants-particularly from coal combustion-with significant consequences for acid rain and air quality. Given China’s coal-dominated energy structure, SO2 is selected as a representative pollutant, accounting for major sources including industrial coal use, metal smelting, and transportation. SO2 emission intensity is calculated using inflation-adjusted real GDP to reflect pollution levels in relation to economic output, as follows:
SO2 emission intensity directly reflects the effectiveness of industrial pollution control and is one of the key targets of pollution reduction policies. To improve comparability across cities and over time, sulfur dioxide emissions are scaled by real gross domestic product, multiplied by 1,000, and then logarithmically transformed.
(2) Carbon Emission Level (CO2). Carbon emission intensity serves as the proxy variable. Urban carbon emissions include both direct emissions, such as those from natural gas and liquefied petroleum gas consumption, and indirect emissions associated with electricity, transportation, and heating. Total carbon emissions are estimated using a disaggregated accounting approach and then scaled by real gross domestic product. The resulting carbon emission intensity variable is logarithmically transformed. The formula is as follows:
A co-reduction effect is considered to exist when smart city construction significantly lowers both sulfur dioxide emission intensity and carbon emission intensity.
Independent variable
The independent variable is Smart City Construction (DID), a policy dummy capturing the implementation of the smart city pilot program. Since 2012, China has integrated smart city construction into its national urbanization strategy, utilizing digital technologies to advance urban governance. The Ministry of Housing and Urban-Rural Development designated three batches of smart city pilots in 2012, 2013, and 2014, covering 290 cities, counties, and towns. Although the list of the third cohort was formally released in April 2015, it was officially titled the “2014 Annual National Smart City Pilot List”. Therefore, this study identifies the third cohort according to its official batch year, namely 2014. This study focuses on prefecture-level cities, excluding subordinate districts, county-level cities, and towns. After removing cities with incomplete or low-quality data, 92 prefecture-level cities are retained as the treatment group. The control group comprises 167 prefecture-level cities never selected as pilots and meeting the same data standards. A DID approach is adopted: the treatment group is assigned a value of 1 (others 0), and the policy period is coded as 1 starting from the approval year (0 before). The interaction term “ treatment group × policy time” captures the dynamic marginal effect of the policy shock.
This variable captures the average treatment effect of smart city construction on urban environmental performance under the multi-period DID framework.
Figure 2 is a geographical distribution map of smart city pilot policy.
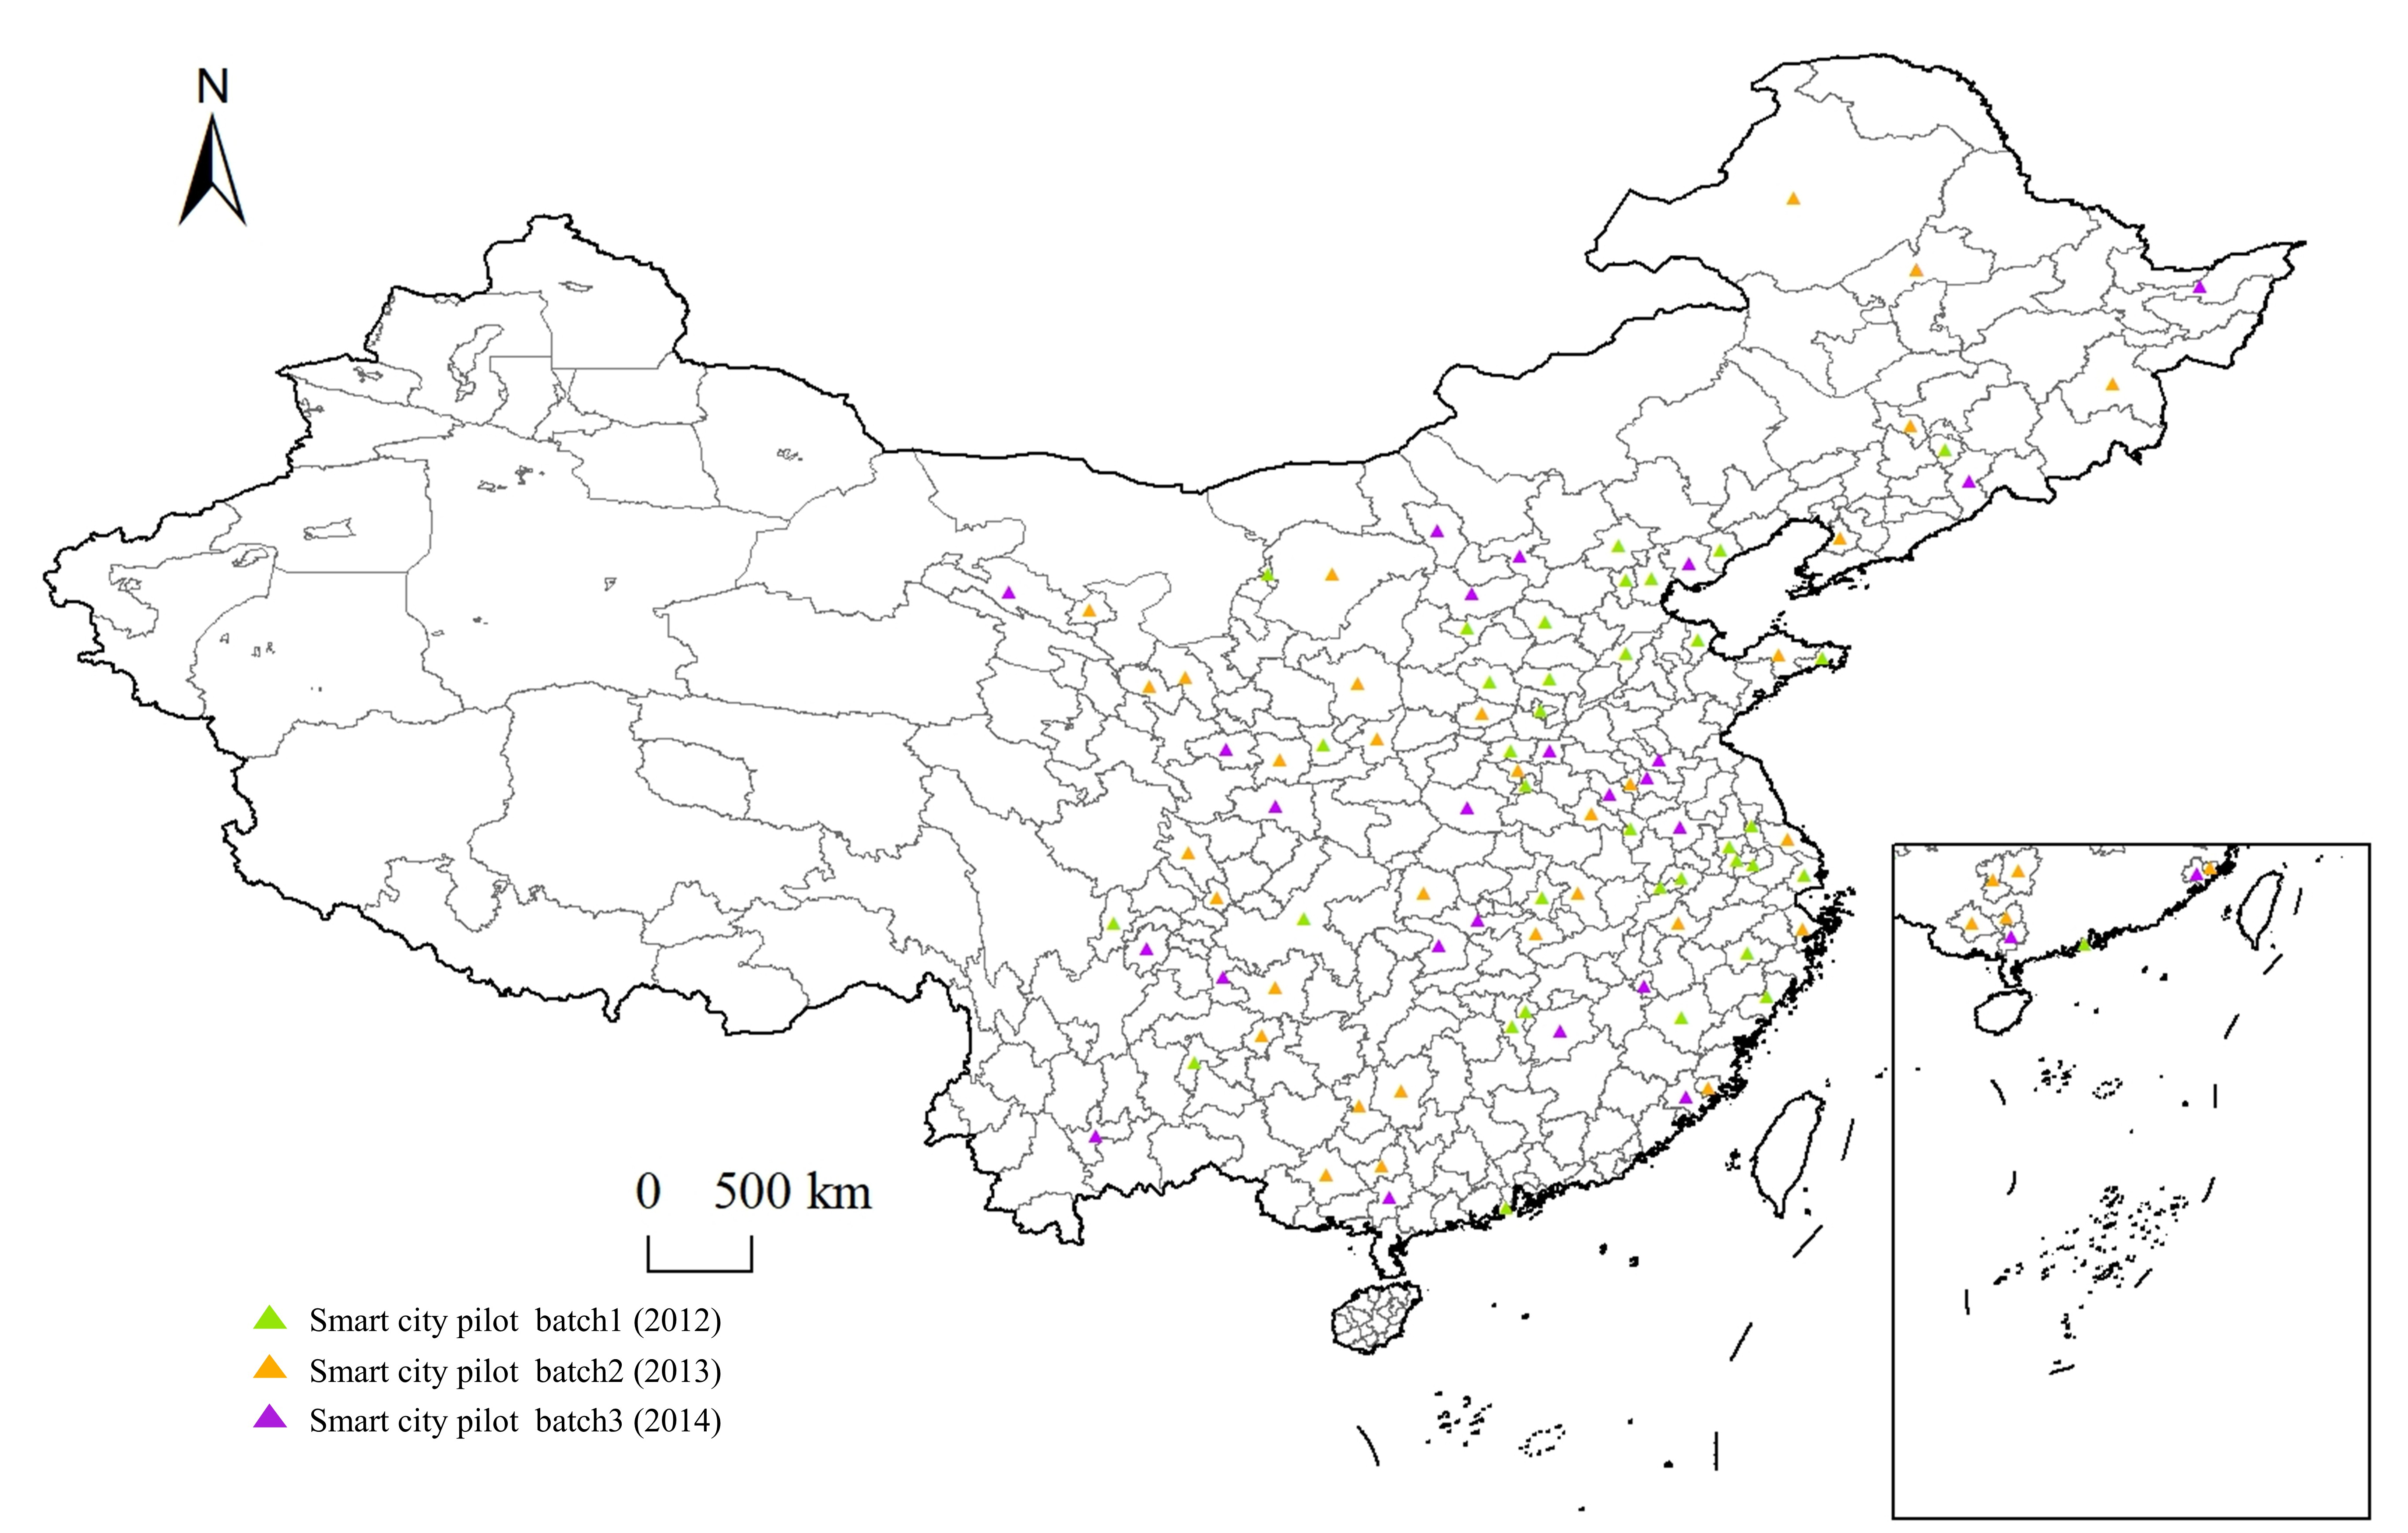
Figure 2. The geographical distribution of smart city pilot policy. Base map source: Standard Map Service, Ministry of Natural Resources, China (http://bzdt.ch.mnr.gov.cn/), approval number GS(2024)0650. The base map has not been modified.
Mediating variables
Guided by the TOE framework, this study systematically categorizes the mediating variables into three analytical dimensions: technology, organization, and environment. The technology dimension reflects the technological capabilities required for digital transformation and green development, represented by green innovation and digital infrastructure. The organization dimension captures structural adjustment and resource allocation within cities, represented by industrial upgrading and human capital. The environment dimension reflects the institutional and ecological conditions supporting environmental governance, represented by ecological construction investment and pollution control capacity.
Within the technological dimension, we focus on green technology innovation (GTI) and digital infrastructure construction (DIC). GTI serves as a proxy for the intensity of regional green R&D activities and is measured by the natural logarithm of green patent applications (plus one). DIC, representing the foundational level of urban digital development, is proxied by the development level of new digital infrastructure, which reflects the accessibility and integration of information technologies within the city. This study measures digital infrastructure construction using a text analysis approach based on government work reports of provinces. Specifically, government work reports were first collected from the official government websites. Python was then employed to preprocess the text, including word segmentation and word-frequency statistics. Following previous studies, the keyword dictionary for digital infrastructure was directly adopted from the existing literature without any additions or deletions, thereby ensuring the consistency and comparability of the measurement[74]. The frequency of digital infrastructure-related keywords was calculated and divided by the total number of words in each government work report to obtain the relative frequency of digital infrastructure expressions. Considering that prefecture-level cities differ substantially in their digital economy foundation and that the number of employees in the information transmission, software, and information technology service sectors is highly correlated with the level of digital infrastructure development, the provincial keyword frequency was further weighted by the proportion of employees engaged in these sectors relative to the total population of each prefecture-level city. This weighting procedure enables the provincial keyword frequencies to better reflect the heterogeneity in digital infrastructure development across prefecture-level cities. The resulting weighted indicator is used to measure the level of DIC.
The organizational dimension captures the structural and qualitative shifts in urban governance through industrial structure upgrading (IS) and human capital optimization (HC). IS is operationalized as the ratio of the added value of the tertiary industry to that of the secondary industry, serving as a metric for the transition toward a service-oriented and high-value-added economy. HC is measured by the proportion of employees in six knowledge-intensive sectors-comprising scientific research, education, public administration, healthcare, finance, and culture/sports - relative to the registered population. This indicator reflects the city’s capacity to optimize its labor structure for sustainable growth.
The environmental dimension evaluates the institutional and physical conditions supporting CRPC through ecological construction investment and pollution control capability (PCC). Because direct data on ecological construction investment are unavailable for prefecture-level cities, this study uses the green coverage rate (GC) of built-up areas as its proxy. This indicator reflects the cumulative outcomes of sustained investment in urban greening, ecological restoration, and public green infrastructure, as well as urban carbon sequestration capacity. Higher green coverage generally indicates greater long-term commitment to ecological construction and therefore serves as a reasonable proxy for ecological investment. PCC is represented by the wastewater treatment capacity (WTC), calculated as the log-transformed capacity of municipal wastewater treatment plants (with a 0.001 constant added). This measure provides a tangible proxy for the city’s overall efficacy in managing conventional environmental externalities.
Control variables
Recognizing that factors such as education, economic development, industrial structure, energy consumption, and population characteristics exert certain influences on the coordinated reduction of pollutant and carbon emissions[4,11,44], this study introduces the following control variables: Education expenditure (edu) is included to capture the level of public investment in education. Population density (PD) is used to control for differences in urban agglomeration and land-use pressure. Foreign direct investment (FDI) is included to account for the influence of external capital on industrial activity and environmental outcomes. Energy-intensive industry share ratio (EISR) is measured by the share of secondary industry in GDP, capturing the dependence on energy-intensive manufacturing sectors. Energy consumption intensity (ECI) is measured as energy consumption per unit of GDP (10,000 tons of standard coal equivalent per 100 million yuan), reflecting the efficiency of energy use and the potential for emission reduction. Environmental regulation intensity (Eri) is measured using a text analysis approach based on prefecture-level government work reports. Government work reports were collected from the official websites of prefecture-level governments and preprocessed using Python for word segmentation and word-frequency statistics. Following previous studies, the keyword dictionary for environmental regulation was directly adopted from the existing literature without any modification to ensure the consistency and comparability of the measurement[49]. The frequencies of all environmental regulation-related keywords were summed and divided by the total number of words in each government work report, and the natural logarithm of the resulting ratio was then taken to construct the environmental regulation intensity indicator.
Sample and data
The sample covers 259 prefecture-level cities in China over the period 2006-2022. Following data availability and consistency, this study retains 92 pilot cities in the treatment group and 167 non-pilot cities in the control group. County-level cities, districts, and observations with severe data deficiencies are excluded to ensure comparability across cities. Specifically, CO2 emission data are obtained from the China Emission Accounts and Datasets (CEADs), SO2 emission data are sourced from the China City Statistical Yearbook, and macroeconomic variables are deflated using price indices from the National Bureau of Statistics to ensure temporal comparability.
The list of smart city pilots is compiled from official policy documents. Socioeconomic, environmental, and urban construction variables are collected from relevant official statistical yearbooks, city-level statistical sources, and other publicly available government publications. To ensure temporal comparability, monetary variables are deflated to constant prices. For a limited number of missing observations, the panel was completed using linear interpolation. Since the missing values do not exceed 2% of the sample, they will not have a significant impact on the empirical test results. All statistical analyses were conducted using Stata 18. Supplementary data processing and visualization were performed using Python 3.13, and spatial mapping was performed using ArcGIS.
Table 1 and Table 2 are the variable definitions and descriptive statistics of the variables, respectively.
Definitions of variables
| Symbol | Variable | Definition |
| CRPC | Coordinated reduction of pollutant and carbon emissions | Coordinated pollution and carbon reduction, measured using CO2 emissions and SO2 emissions |
| DID | Difference-in-differences | Dummy variable indicating whether a city is included in the smart city pilot program |
| GTI | Green technology innovation | Green invention patent applications |
| DIC | Digital infrastructure construction | Digital infrastructure index constructed from government work reports using text analysis |
| IS | Industrial structure upgrading | The ratio of value added of the tertiary industry to value added of the secondary industry |
| HC | Human capital optimization | Ratio of the number of employees in high human capital industries to the number of registered residents |
| GC | Green coverage rate | Green coverage rate in built-up areas |
| WTC | Wastewater treatment capacity | Add 0.001 to the sewage treatment capacity and take the natural logarithm |
| edu | Education expenditure | Education expenditure of prefecture-level cities |
| EISR | Energy-intensive industry share ratio | Share of the value added of the secondary industry in GDP, used as a proxy for cities’ exposure to energy-intensive industrial production |
| ECI | Energy consumption intensity | Energy consumption per unit of GDP, measured in 10,000 tons of standard coal equivalent per RMB 100 million |
| PD | Population density | Administrative region area and population of the unit |
| FDI | Foreign direct investment | Foreign direct investment amount |
| Eri | Environmental regulation intensity | Sum of word frequencies related to environmental regulation |
Descriptive statistics of variables
| Variables | N | Mean | sd | Min | Max |
| SO2 | 4,403 | 0.7914 | 1.5757 | -7.2645 | 4.5559 |
| CO2 | 4,403 | 1.0195 | 0.8857 | -1.6526 | 3.4373 |
| DID | 4,403 | 0.2114 | 0.4084 | 0.0000 | 1.0000 |
| GTI | 4,403 | 4.5650 | 1.8472 | 0.0000 | 10.3008 |
| DIC | 4,403 | 2.1290 | 2.3118 | 0.0000 | 88.7407 |
| IS | 4,403 | 0.9944 | 0.5605 | 0.1310 | 5.3500 |
| HC | 4,403 | 0.0404 | 0.0322 | 0.0055 | 1.5913 |
| GC | 4,403 | 39.5403 | 7.0952 | 0.0000 | 87.8920 |
| WTC | 4,403 | 3.0495 | 1.1256 | 0.0000 | 6.7999 |
| edu | 4,403 | 12.8937 | 0.9990 | -0.9943 | 16.2516 |
| EISR | 4,403 | 0.4647 | 0.1105 | 0.0000 | 0.9923 |
| ECI | 4,403 | 0.0975 | 0.1066 | 0.0059 | 2.7690 |
| PD | 4,403 | 0.0481 | 0.0629 | 0.0065 | 2.0966 |
| FDI | 4,403 | 0.0227 | 0.0242 | -0.0287 | 0.3639 |
| Eri | 4,403 | 0.0073 | 0.0035 | -0.0107 | 0.0314 |
RESULTS AND DISCUSSION
Baseline results
The baseline estimates in Table 3 show that smart city construction significantly reduces both sulfur dioxide emission intensity and carbon emission intensity, indicating that the policy generates a clear co-reduction effect. This finding supports Hypothesis 1 and suggests that smart city construction has environmental consequences beyond its original role in digital urban governance.
Baseline results
| Variables | (1) | (2) | (3) | (4) |
| SO2 | SO2 | CO2 | CO2 | |
| DID | -0.0716** | -0.0674** | -0.0470*** | -0.0496*** |
| (-2.1967) | (-2.0858) | (-3.2548) | (-3.4291) | |
| edu | -0.0445 | 0.0137 | ||
| (-1.4609) | (0.8593) | |||
| PD | -0.8491** | -0.5061** | ||
| (-2.2360) | (-2.2630) | |||
| FDI | -0.6877 | 0.7484* | ||
| (-1.0680) | (1.7486) | |||
| Eri | 0.0032 | 0.5801 | ||
| (0.0009) | (0.1985) | |||
| EISR | -0.2774 | -0.0256 | ||
| (-1.3310) | (-0.1463) | |||
| ECI | 0.8974*** | 0.1842** | ||
| (3.5358) | (2.0786) | |||
| Year | YES | YES | YES | YES |
| City | YES | YES | YES | YES |
| Observations | 4,403 | 4,403 | 4,403 | 4,403 |
| R-squared | 0.882 | 0.884 | 0.931 | 0.932 |
The negative coefficients on the smart city policy variable imply that digital governance can contribute to the integrated control of conventional air pollutants and carbon emissions at the city level. A plausible explanation is that smart city construction improves environmental monitoring, strengthens interdepartmental coordination, and enhances the efficiency of resource allocation in areas such as energy use, transportation, and public management[31].
Overall, the baseline results indicate that smart city policy should not be understood solely as a technological modernization strategy. It also functions as a governance instrument with measurable environmental benefits in the context of CRPC.
Parallel trend test
The parallel trends assumption test is a key prerequisite in policy evaluation methods such as the DID approach. Its core concept is that, prior to policy implementation, the dependent variable in the treatment and control groups should exhibit similar trends. To test this, this paper specifies the following model:
Since the smart city pilot policy was implemented in staggered batches, event time is defined relative to each city’s pilot year. In Equations (8) and (9),
Figures 3 and 4 present the estimated event-time coefficients over the window from -5 to +7. Except for an isolated SO2 estimate at event time -2, the pre-policy coefficients are statistically insignificant and exhibit no systematic trend. For both outcomes, the policy effects are insignificant during the first two post-policy years, become significantly negative from the third year onward, and subsequently increase in absolute magnitude, indicating a delayed and gradually strengthening environmental effect.
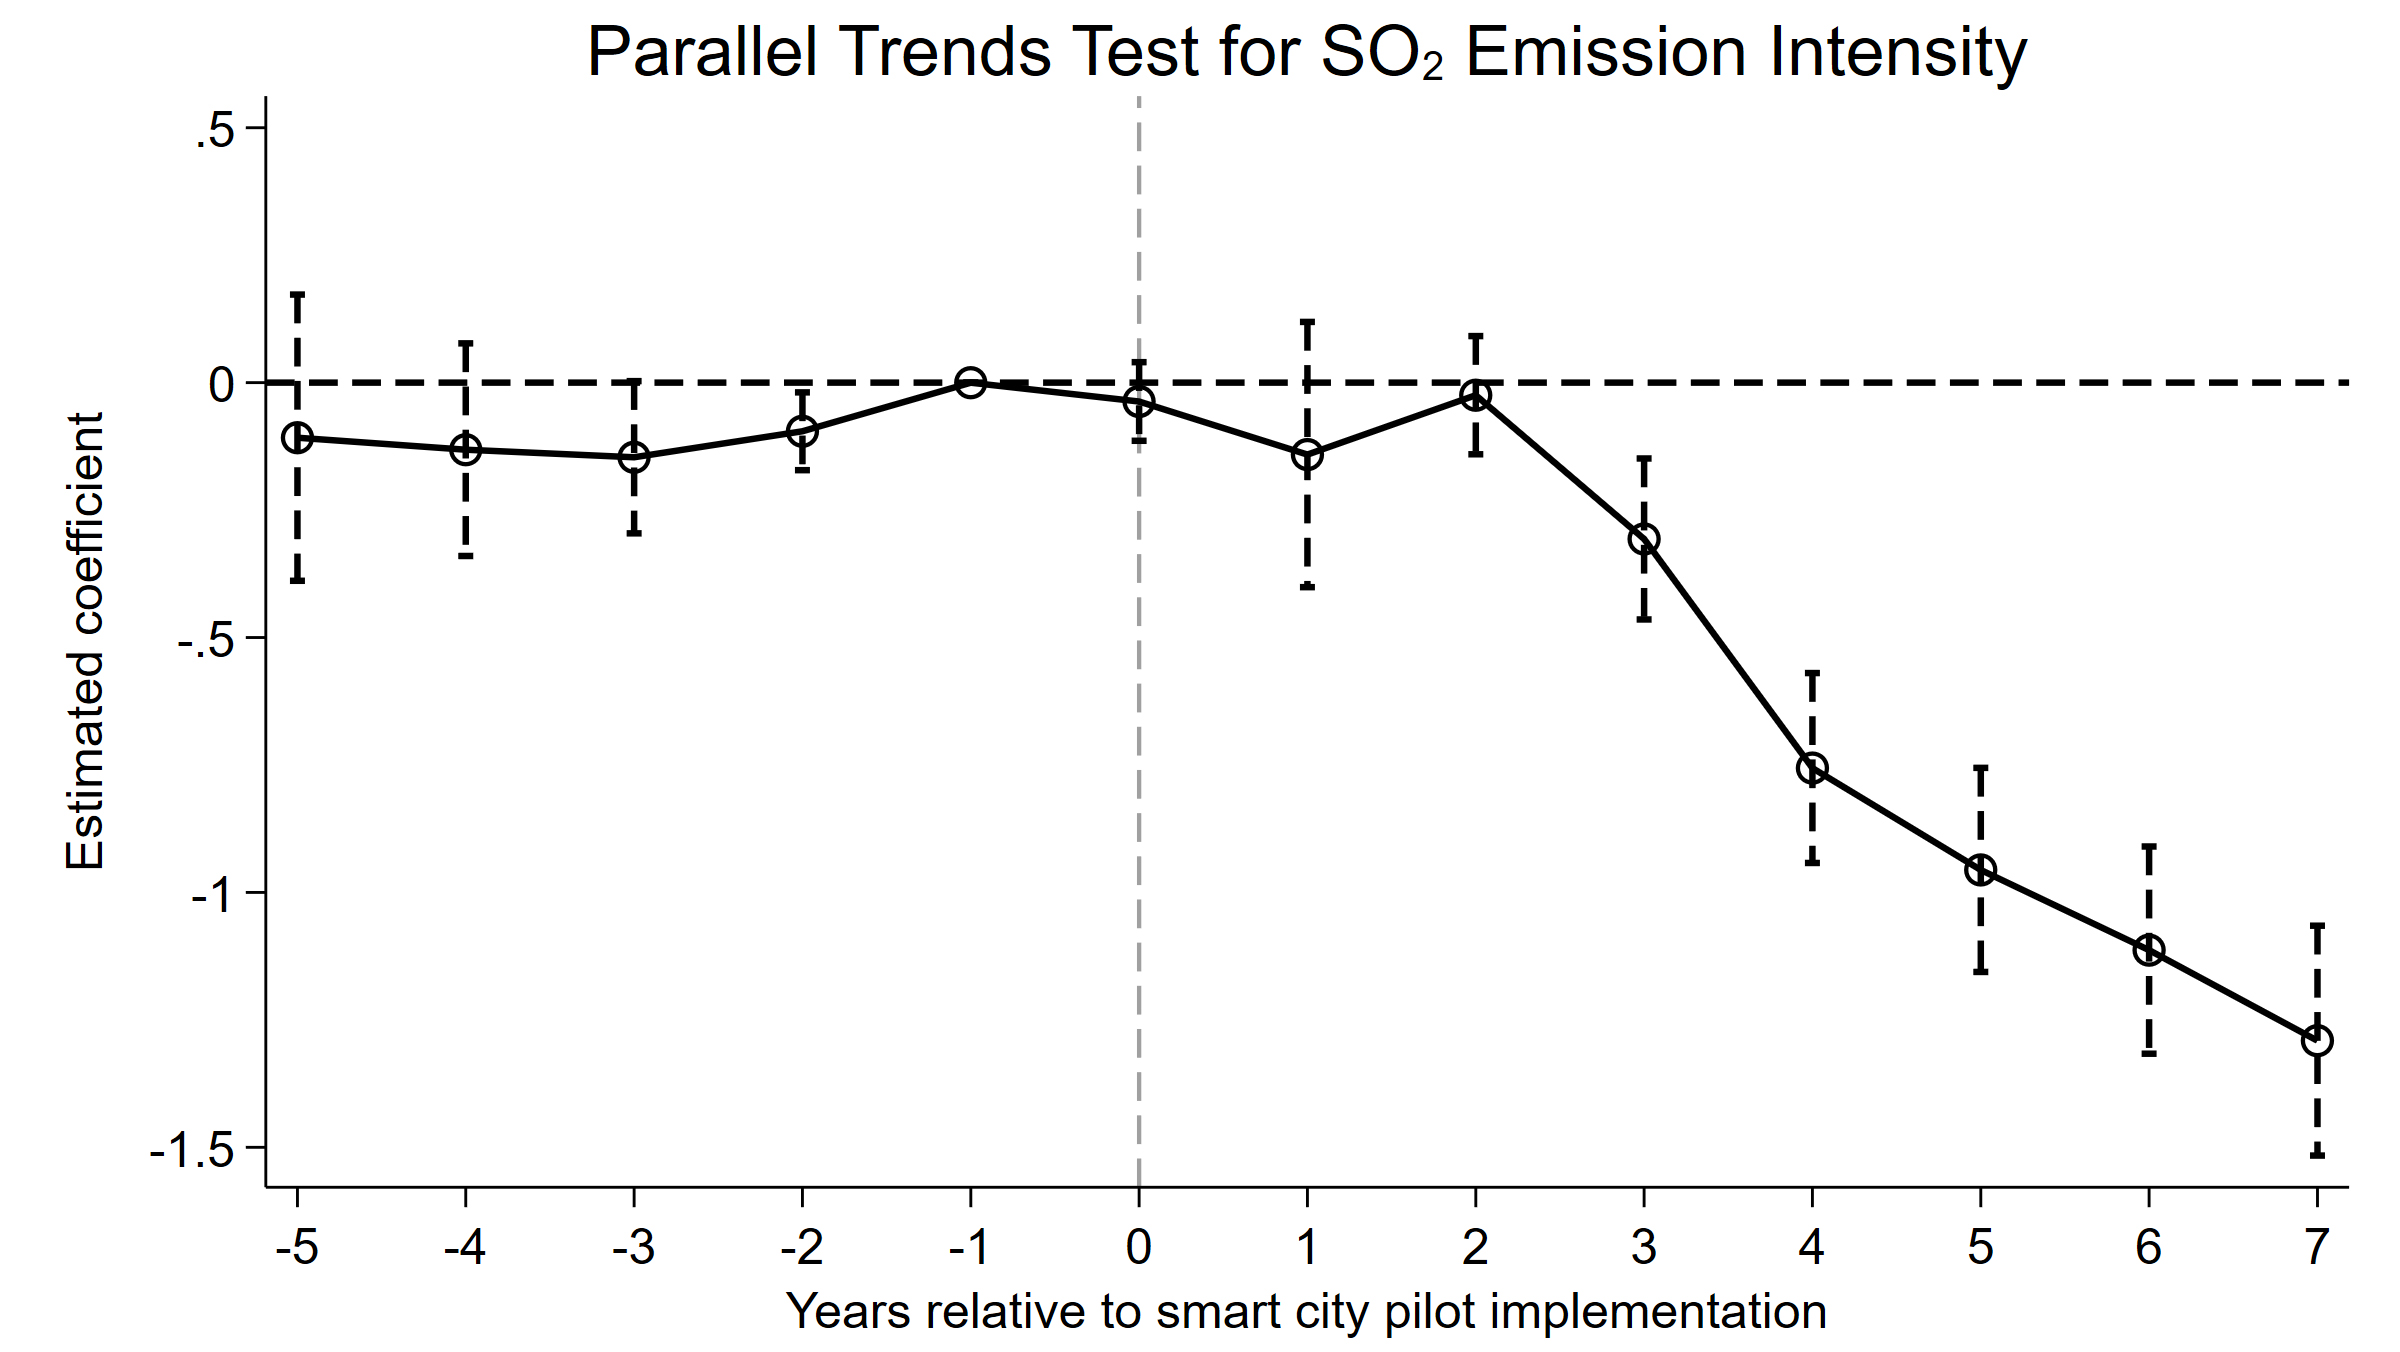
Figure 3. Parallel trend test of SO2 emission intensity. The horizontal dashed line denotes the zero-effect benchmark, the vertical dashed line marks the year of policy implementation (event time = 0), and the capped vertical bars represent 95% confidence intervals.
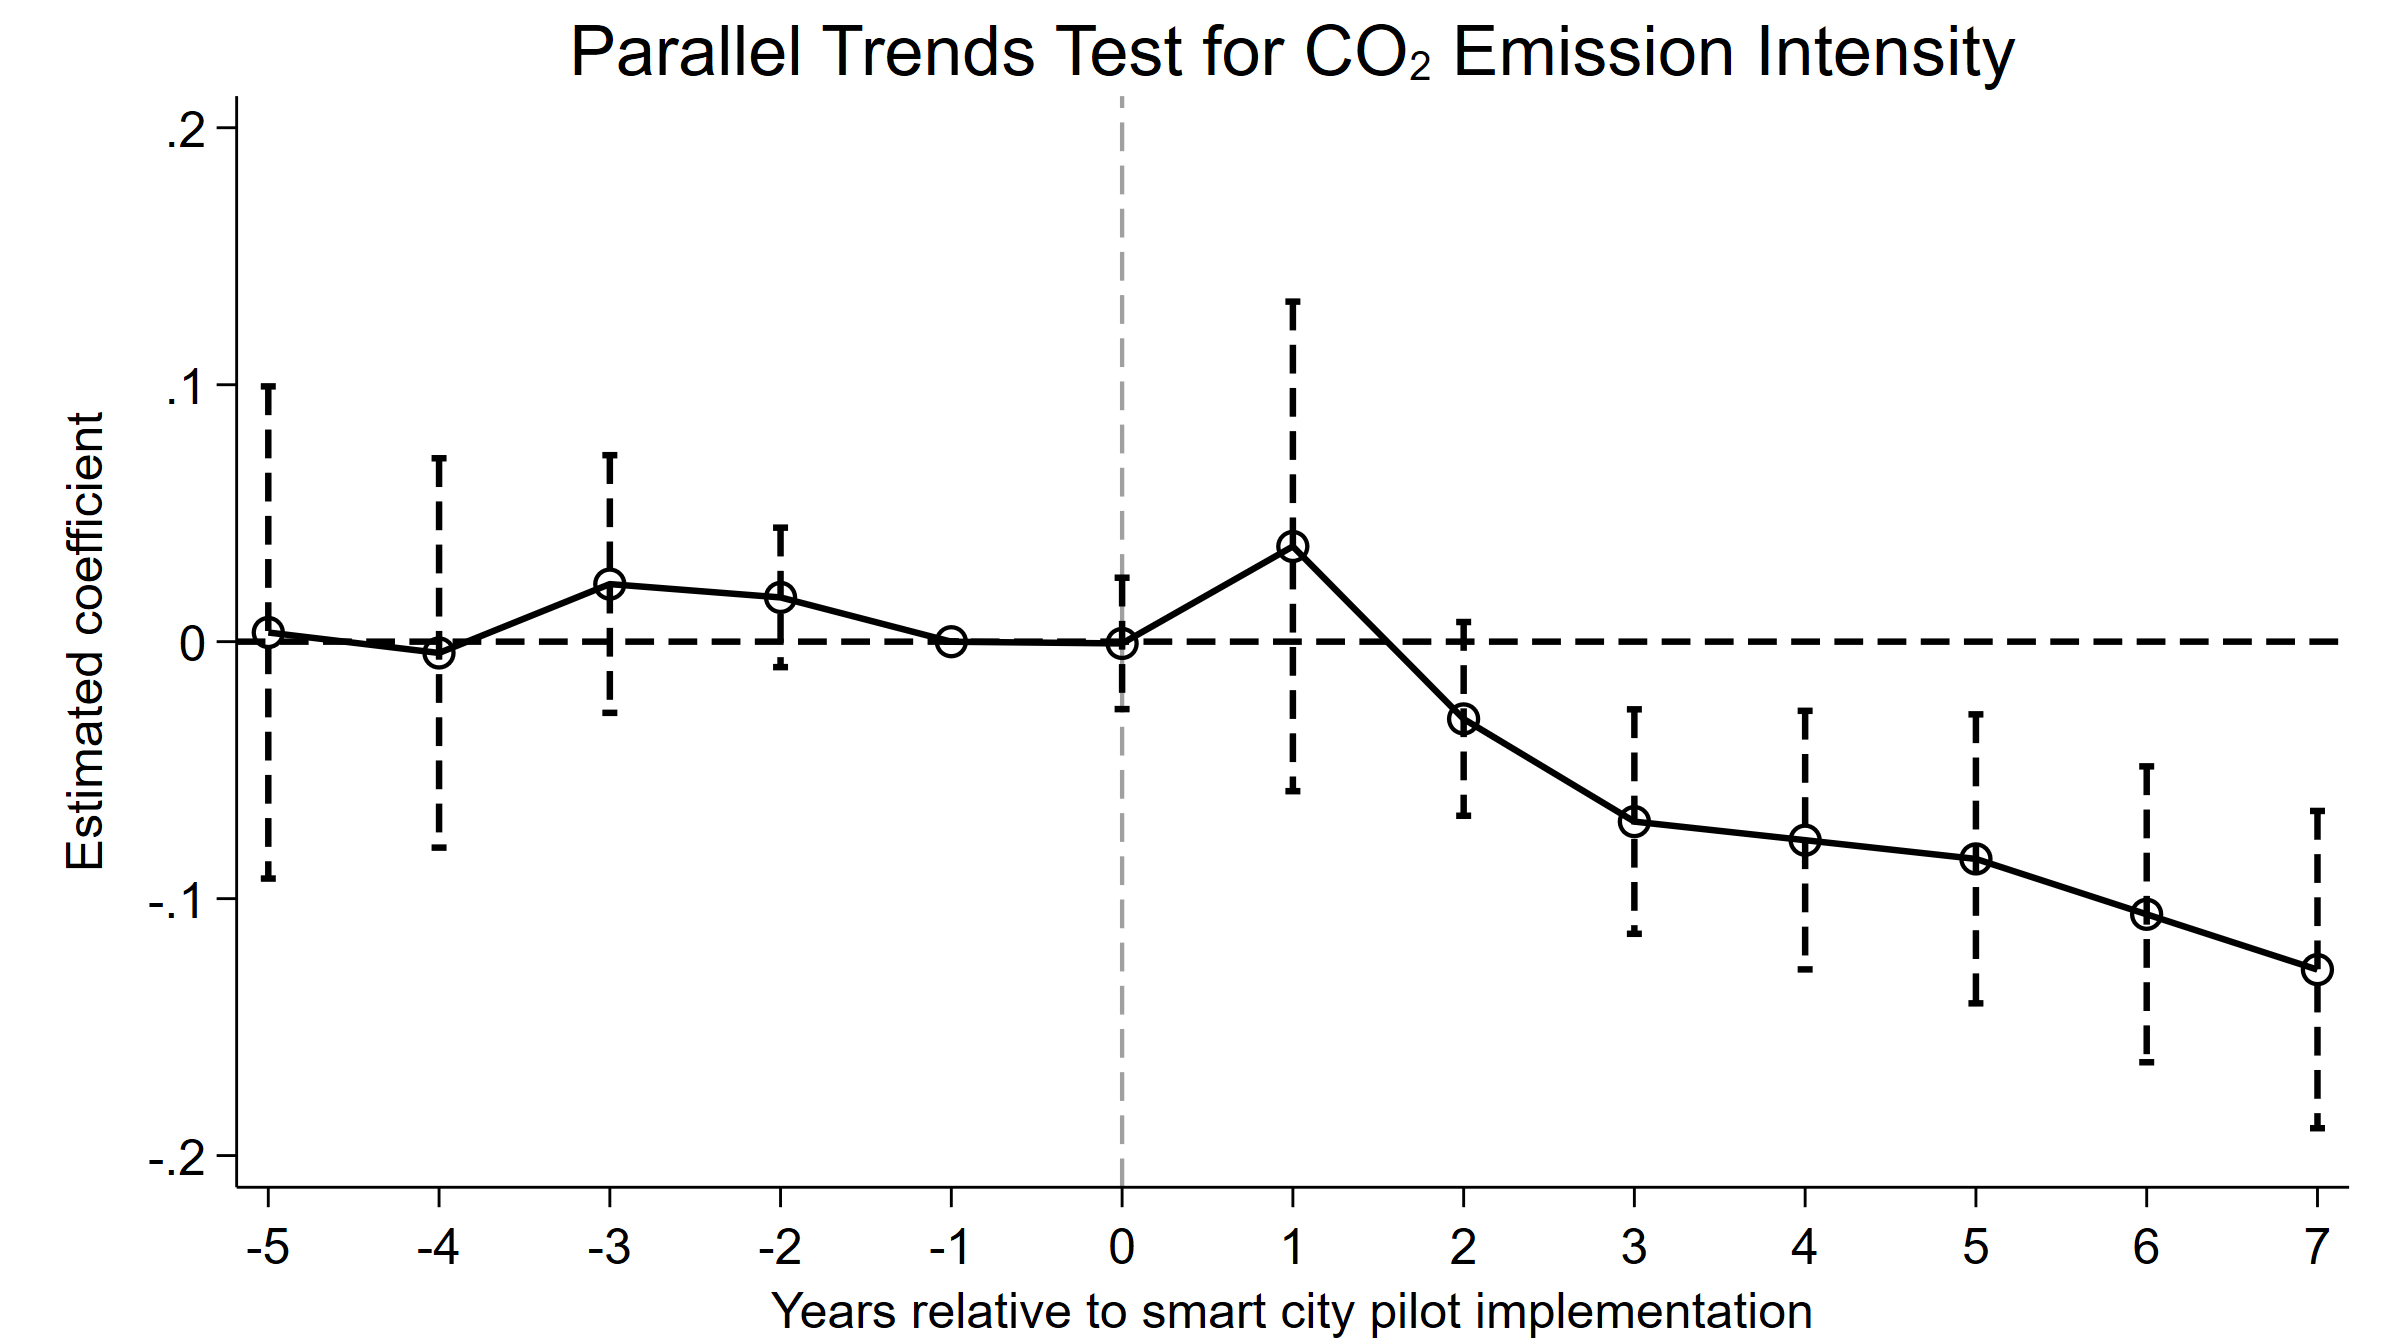
Figure 4. Parallel trend test of CO2 emission intensity. The horizontal dashed line denotes the zero-effect benchmark, the vertical dashed line marks the year of policy implementation (event time = 0), and the capped vertical bars represent 95% confidence intervals.
To address potential heterogeneous treatment effects, we further conduct a Goodman-Bacon decomposition and apply the Callaway-Sant’Anna group-time average treatment effect on the treated (ATT) estimator. Table 4 shows that the two-way fixed-effects (TWFE) estimates are primarily driven by comparisons between pilot and never-treated cities, while potentially problematic comparisons receive limited weight. The Callaway-Sant’Anna estimates remain significantly negative for both outcomes, indicating that accounting for treatment-effect heterogeneity does not alter the main findings.
Diagnostics for heterogeneous treatment effects
| Comparison/estimate | SO2 estimate | Weight (%) | CO2 estimate | Weight (%) |
| Panel A: goodman-bacon decomposition | ||||
| Different treatment-timing groups | 0.0693 | 5.0193 | 0.0228 | 5.0193 |
| Treated versus never-treated | -0.0808 | 94.5970 | -0.0516 | 94.5970 |
| Within component | 1.4411 | 0.3838 | -0.5062 | 0.3838 |
| Overall estimate | -0.0674** | 100.0000 | -0.0496*** | 100.0000 |
| Panel B: callaway-sant’anna estimates | ||||
| ATT | -0.0945** | -0.0267* | ||
| (-2.3707) | (-1.9358) | |||
Robustness tests
Multi-period DID combined with placebo test
To avoid the potential impact of unobservable factors at the city and year levels on the regression results, this study randomly assigns smart city pilot cities and pilot years to create a pseudo-core explanatory variable for multi-period DID placebo tests. The model is structured as follows:
This study conducts 500 rounds of random sampling estimations based on Equations (10) and (11) respectively. As shown in Figure 5 and Table 5, the placebo coefficients are generally centered around zero, whereas the actual baseline estimates are located in the left tails of the corresponding distributions. The empirical p-values are 0.002 for SO2 emission intensity and 0.0659 for CO2 emission intensity. These findings provide strong placebo-test support for the SO2 result and supportive evidence for the CO2 result at the 10% level, suggesting that the baseline estimates are unlikely to be driven by random treatment assignment.
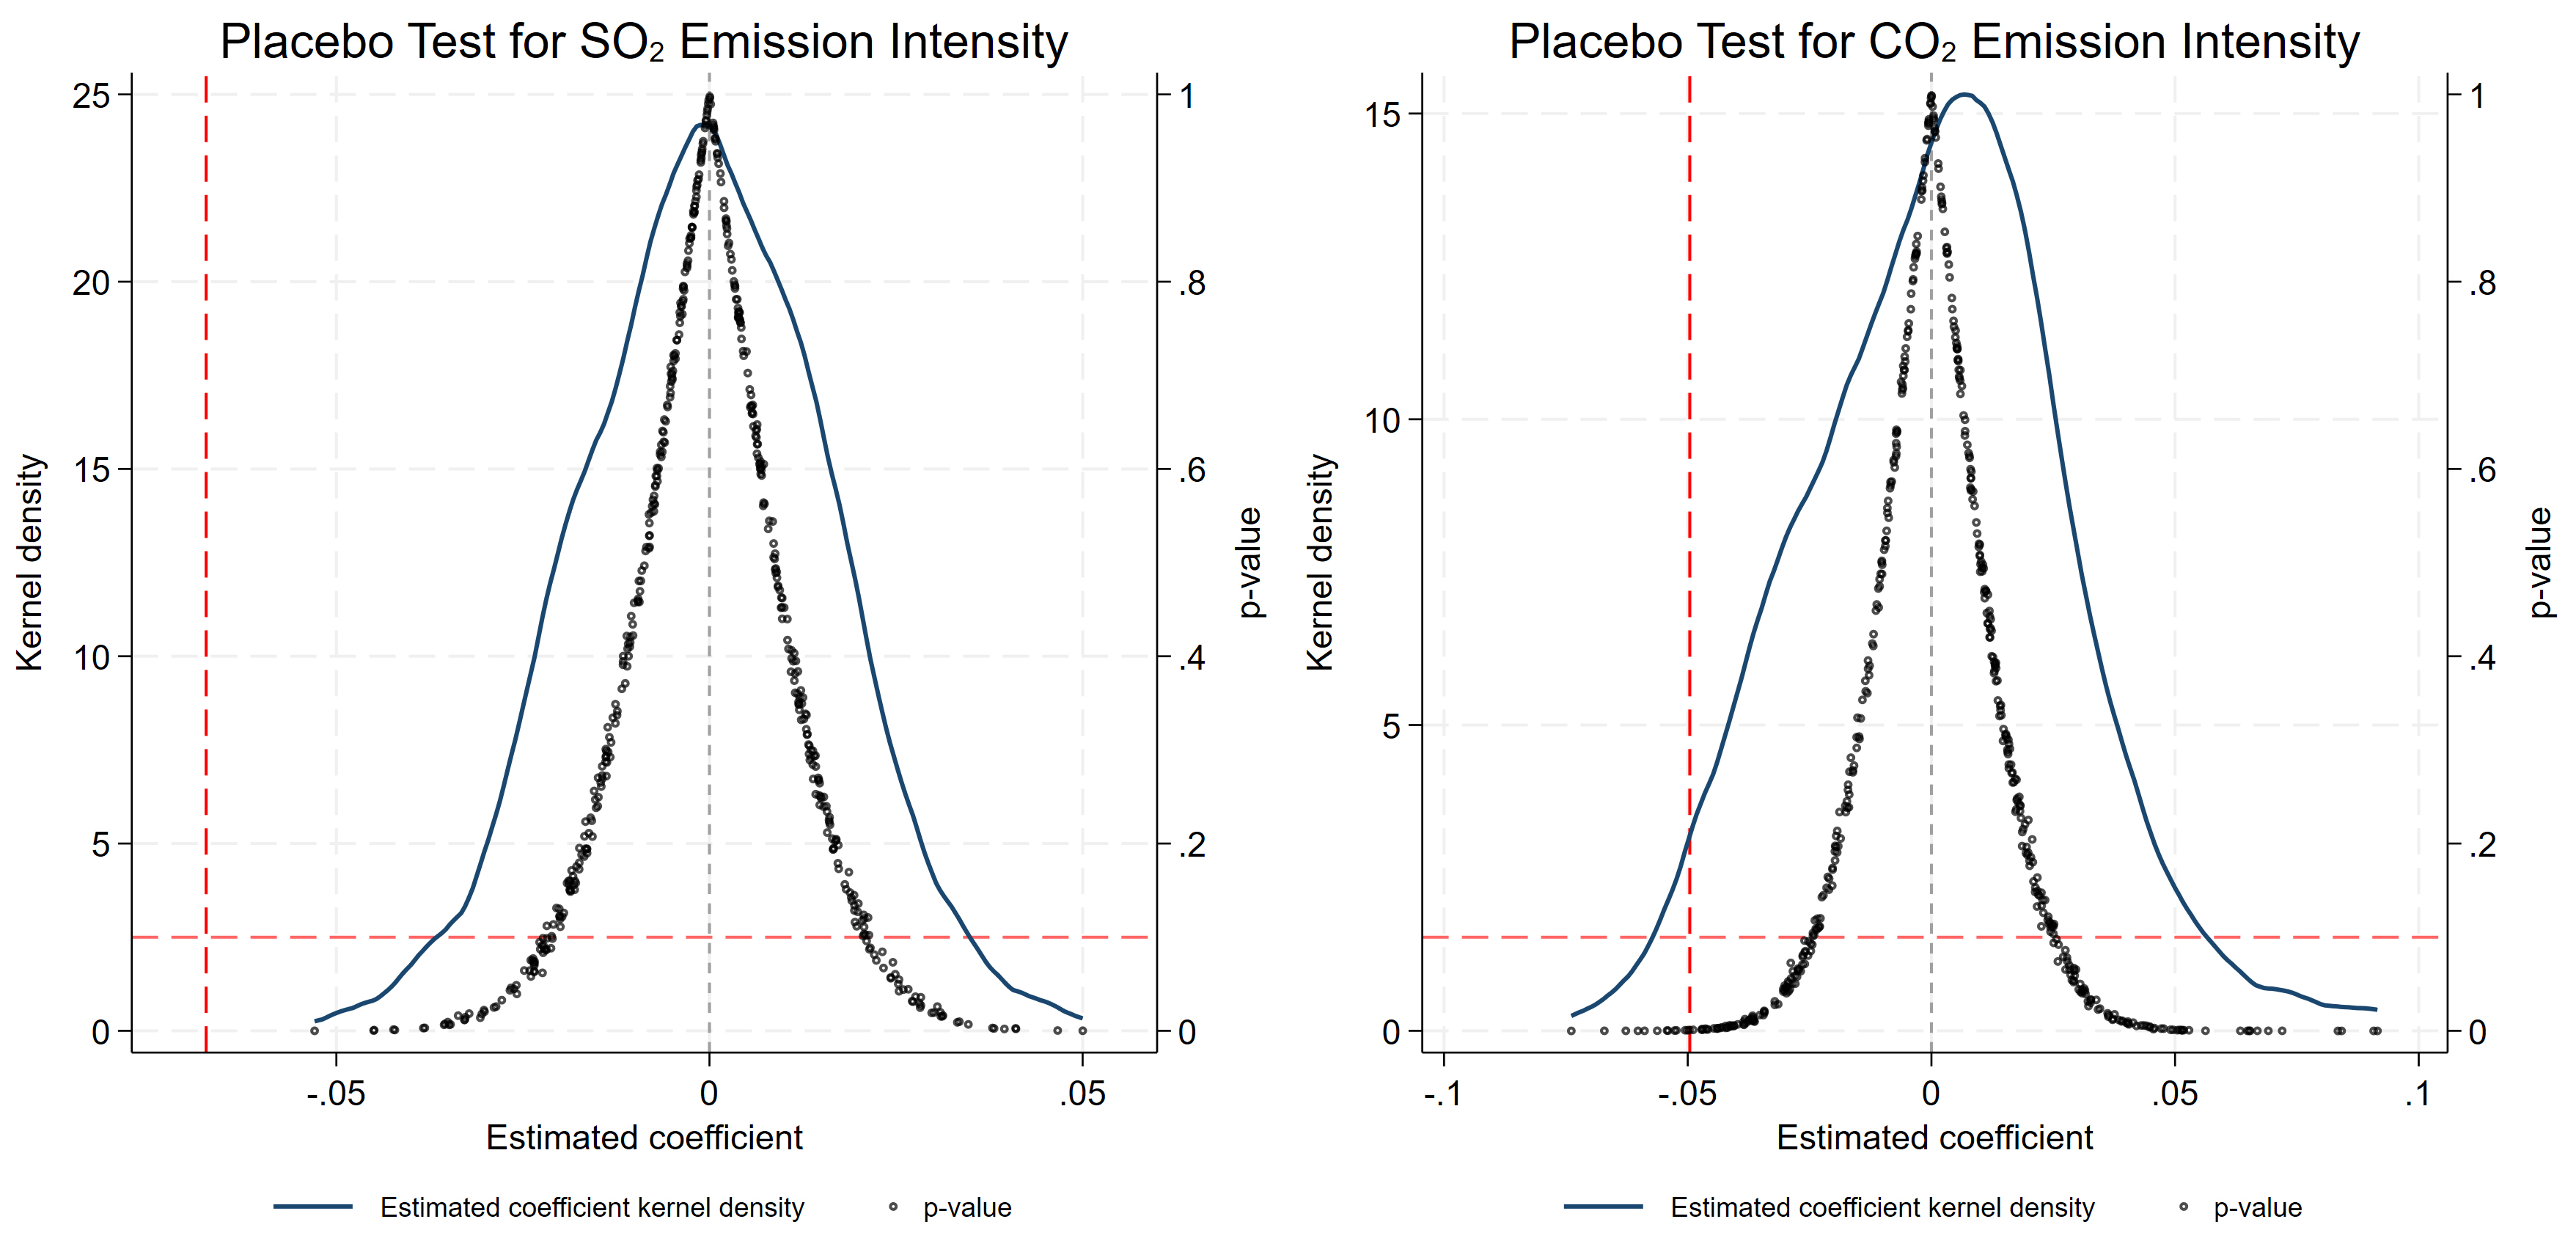
Figure 5. SO2 and CO2 emission intensity placebo test. The gray vertical dashed lines mark zero, the red vertical dashed lines indicate the actual baseline estimates, and the red horizontal dashed lines denote the P = 0.10 threshold.
Placebo test results (500 iterations)
| Statistic | SO2 | CO2 |
| Replications | 500 | 500 |
| Mean coefficient | -0.0006 | 0.0011 |
| Standard deviation | 0.0164 | 0.0269 |
| 5th percentile | -0.0267 | -0.0431 |
| 95th percentile | 0.0263 | 0.0448 |
| Share of P-values < 0.10 | 0.1880 | 0.3460 |
| Empirical P-value | 0.0020 | 0.0659 |
Propensity score matching combined with difference-in-differences robustness test
To address potential selection bias in pilot city designation, this study employs propensity score matching combined with difference-in-differences (PSM-DID) with 1:1 nearest-neighbor matching. The balance test in Table 6 shows that the standardized biases of all covariates fall below 10% after matching, indicating satisfactory matching quality. As shown in Table 7, the DID coefficients for both SO2 and CO2 emission intensity remain negative and statistically significant after matching. Although the estimated effect on SO2 emission intensity becomes smaller in magnitude, its direction and statistical significance remain unchanged, while the CO2 estimate remains comparable to the corresponding baseline result. These findings provide further support for the robustness of the baseline conclusions.
Balance test results
| Variables | Sample | Mean | sd (%) | Bias reduction (%) | T test | ||
| Treatment group | Control group | T value | P value | ||||
| edu | Unmatch | 12.906 | 12.819 | 8.5 | 99.6 | 2.690 | 0.007 |
| Match | 12.916 | 12.916 | 0 | 0.010 | 0.993 | ||
| PD | Unmatch | 0.049 | 0.046 | 5.2 | 76.8 | 1.570 | 0.116 |
| Match | 0.049 | 0.049 | -1.2 | -0.300 | 0.767 | ||
| FDI | Unmatch | 0.023 | 0.022 | 2.8 | -166.9 | 0.860 | 0.388 |
| Match | 0.023 | 0.025 | -7.6 | -1.990 | 0.046 | ||
| Eri | Unmatch | 0.008 | 0.007 | 7.8 | 88.1 | 2.430 | 0.015 |
| Match | 0.008 | 0.008 | -0.9 | -0.240 | 0.809 | ||
| EISR | Unmatch | 0.518 | 0.503 | 14.9 | 64.7 | 1.17 | 0.244 |
| Match | 0.520 | 0.514 | 5.3 | 0.37 | 0.708 | ||
| ECI | Unmatch | 0.082 | 0.081 | 1.1 | -441.3 | 0.08 | 0.935 |
| Match | 0.082 | 0.077 | 5.9 | 0.37 | 0.711 | ||
PSM-DID robustness test results
| Variables | (1) | (2) | (3) | (4) |
| Before matching | After matching | Before matching | After matching | |
| SO2 | SO2 | CO2 | CO2 | |
| DID | -0.0674** | -0.0169** | -0.0496*** | -0.0532** |
| (-2.0858) | (-2.4466) | (-3.4291) | (-2.4652) | |
| edu | -0.0445 | -0.0216 | 0.0137 | -0.0080 |
| (-1.4609) | (-0.9092) | (0.8593) | (-0.5922) | |
| PD | -0.8491** | -0.5901** | -0.5061** | -0.2746** |
| (-2.2360) | (-2.0020) | (-2.2630) | (-2.2636) | |
| FDI | -0.6877 | -0.2416 | 0.7484* | 0.3750 |
| (-1.0680) | (-0.3512) | (1.7486) | (0.6424) | |
| Eri | 0.0032 | -0.6750 | 0.5801 | 0.8494 |
| (0.0009) | (-0.1575) | (0.1985) | (0.2164) | |
| EISR | -0.2774 | -0.6829*** | -0.0256 | 0.1559 |
| (-1.3310) | (-2.6430) | (-0.1463) | (0.5903) | |
| ECI | 0.8974*** | 1.2859*** | 0.1842** | 0.2406** |
| (3.5358) | (7.2286) | (2.0786) | (2.1158) | |
| Observations | 4,403 | 2,618 | 4,403 | 2,618 |
| R-squared | 0.884 | 0.903 | 0.932 | 0.930 |
Other robustness tests
(1) Excluding direct-administered municipalities. Beijing, Shanghai, Tianjin, and Chongqing are excluded to mitigate potential bias from their unique resource concentrations.
(2) Winsorization. Variables are winsorized at the 1st and 99th percentiles to address potential outliers from linear interpolation.
(3) Controlling for concurrent policies. To exclude the confounding effects of other digitalization-related policies and environmental policies, we control for three concurrent policy interventions: (1) Low-carbon city pilot policy: Based on the three batches of pilots in 2010, 2012, and 2017 covering 156 cities, a dummy variable lc_policy is constructed (1 for pilot cities, 0 otherwise); (2) Emission rights trading pilot policy: Focusing on the policy implemented in 2007 (covering 11 provinces), a dummy variable rt_policy is constructed (1 for pilot cities in pilot provinces, 0 otherwise); (3) National Digital Economy Innovation Development Pilot Zone policy: Based on the policy launched in 2019 covering five provinces, a dummy variable di_policy is constructed (1 for cities in pilot provinces, 0 otherwise). By controlling for these policies, we ensure that the estimated effect of smart city construction is not confounded by other concurrent policy interventions.
(4) Include more control variables. To avoid omitted variable bias, this paper incorporates two additional control variables: the degree of government intervention (GI) and environmental protection performance (EP), with the latter measured by the harmless treatment rate of household waste.
(5) Replace the dependent variable. This paper uses urban carbon emission data from Emissions Database for Global Atmospheric Research (EDGAR) as a substitute variable for CO2 emissions and industrial wastewater discharge as a substitute variable for SO2 emissions to conduct robustness tests.
(6) Interaction term of sulfur dioxide and carbon dioxide. To ensure the existence of synergy, this paper interacts sulfur dioxide with carbon dioxide to obtain SO2&CO2, and uses it as a CRPC proxy indicator for robustness testing.
The results are shown in Table 8.
Other robustness test results
| Variables | (1) | (2) | (3) | (4) | (5) | (6) | (7) | (8) | (9) | (10) | (11) |
| Excluding municipality | Winsorization | Eliminate policy interference | Add control variables | Replace the dependent variable | Interaction | ||||||
| SO2 | CO2 | SO2 | CO2 | SO2 | CO2 | SO2 | CO2 | SO2 | CO2 | SO2&CO2 | |
| DID | -0.0555** | -0.0434*** | -0.0619** | -0.0508*** | -0.0680** | -0.0693*** | -0.039*** | -0.103** | -0.5116*** | -0.2993*** | -0.5821** |
| (-2.1736) | (-2.9957) | (-1.9763) | (-3.0252) | (-2.1037) | (-2.6082) | (-4.0231) | (-2.5836) | (-5.2191) | (-10.6071) | (-2.5177) | |
| lc_policy | -0.1816 | -0.0575** | |||||||||
| (-1.4386) | (-2.1094) | ||||||||||
| rt_policy | 0.4274*** | 0.0457* | |||||||||
| (4.8031) | (1.9608) | ||||||||||
| di_policy | -0.0680** | -0.0504*** | |||||||||
| (-2.1003) | (-3.4842) | ||||||||||
| GI | -0.051 | -0.599*** | |||||||||
| (-1.0723) | (-3.0095) | ||||||||||
| EP | -0.912*** | -1.200 | |||||||||
| (-3.5186) | (-1.1142) | ||||||||||
| Controls | YES | YES | YES | YES | YES | YES | YES | YES | YES | YES | YES |
| Year | YES | YES | YES | YES | YES | YES | YES | YES | YES | YES | YES |
| City | YES | YES | YES | YES | YES | YES | YES | YES | YES | YES | YES |
| Observations | 4,335 | 4,335 | 4,403 | 4,403 | 4,403 | 4,403 | 4,403 | 4,403 | 4,403 | 4,403 | 4,403 |
| R-squared | 0.653 | 0.903 | 0.653 | 0.903 | 0.661 | 0.903 | 0.970 | 0.847 | 0.694 | 0.927 | 0.619 |
Heterogeneity analysis
Analysis of heterogeneity in environmental regulation
Environmental regulation serves as a critical institutional determinant of urban sustainability, and its regional intensity variations are likely to influence the efficacy of CRPC. This study measures environmental regulation intensity using the frequency of environmental keywords in municipal government work reports. Based on the annual median, observations with environmental regulation intensity above the median are assigned to the high-regulation group, while those at or below the median are assigned to the low-regulation group.
As reported in Table 9, the effect is stronger in cities with higher environmental regulation intensity, suggesting that digital governance and formal environmental regulation are complementary. This finding suggests that stringent environmental mandates function as a policy amplifier by internalizing the social costs of pollution and compelling corporations to adopt greener production modalities[11].
Results of heterogeneity test of environmental regulation
| Variables | (1) | (2) | (3) | (4) |
| High environmental regulation | Low environmental regulation | |||
| SO2 | CO2 | SO2 | CO2 | |
| DID | -0.0752*** | -0.1248*** | -0.0304 | -0.0232 |
| (-3.5213) | (-3.4453) | (-0.5679) | (-0.9272) | |
| Controls | YES | YES | YES | YES |
| Constant | 12.1897*** | 3.8977*** | 3.7421** | 5.1502*** |
| (4.7308) | (6.2039) | (2.4703) | (19.1762) | |
| Year | YES | YES | YES | YES |
| City | YES | YES | YES | YES |
| Observations | 2,194 | 2,194 | 2,209 | 2,209 |
| R-squared | 0.669 | 0.910 | 0.895 | 0.917 |
Analysis of heterogeneity in resource endowment
Variations in resource endowment and developmental stages create distinct boundary conditions that influence the efficacy of smart city construction in facilitating CRPC. Following the classifications established in the National Sustainable Development Plan for Resource-Based Cities, this study categorizes the sample into five distinct cohorts: growing, mature, declining, regenerative, and non-resource-based cities.
As illustrated in Table 10, smart city construction yields significant synergistic effects on both pollutant and carbon reduction within growing and non-resource-based cities. In growing cities, the relative flexibility of the industrial structure and the rapid accumulation of digital infrastructure allow for the seamless integration of smart governance tools. Similarly, non-resource-based cities often possess a more diversified economic base that is inherently more receptive to the technological and organizational shifts required for synergistic governance[3].
Results of heterogeneity test of resource endowment
| Variables | (1) | (2) | (3) | (4) | (5) | (6) | (7) | (8) | (9) | (10) |
| Growing city | Mature city | Declining city | Regenerative city | Non-resource-based city | ||||||
| SO2 | CO2 | SO2 | CO2 | SO2 | CO2 | SO2 | CO2 | SO2 | CO2 | |
| DID | -0.3326** | -0.2967*** | -0.1435** | -0.0331 | -0.1472 | -0.0730 | -0.0837*** | 0.0205 | -0.0181*** | -0.0517** |
| (-2.0434) | (-2.8161) | (-1.9844) | (-0.7480) | (-0.8442) | (-1.1595) | (-3.2159) | (0.2958) | (-4.3670) | (-2.5324) | |
| Controls | YES | YES | YES | YES | YES | YES | YES | YES | YES | YES |
| Year | YES | YES | YES | YES | YES | YES | YES | YES | YES | YES |
| City | YES | YES | YES | YES | YES | YES | YES | YES | YES | YES |
| Observations | 204 | 204 | 935 | 935 | 357 | 357 | 255 | 255 | 2,652 | 2,652 |
| R-squared | 0.567 | 0.901 | 0.625 | 0.871 | 0.604 | 0.899 | 0.542 | 0.928 | 0.667 | 0.902 |
Conversely, mature and regenerative cities exhibit significant progress in pollution mitigation but fail to achieve corresponding gains in carbon reduction. This lack of impact reflects the profound structural inertia and fiscal constraints typical of resource-depleted areas, where the primary focus on economic survival may overshadow the implementation of advanced digital environmental governance[3,47].
Overall comparison of heterogeneity analysis
In order to better conduct a comparative analysis of heterogeneous results, this paper summarizes all heterogeneous results in Table 11.
Summary of heterogeneity test results
| Heterogeneity | SO2 | CO2 |
| High environmental regulation | -0.0752*** | -0.1248*** |
| Low environmental regulation | -0.0304 | -0.0232 |
| Growing city | -0.3326** | -0.2967*** |
| Mature city | -0.1435** | -0.0331 |
| Declining city | -0.1472 | -0.0730 |
| Regenerative city | -0.0837*** | 0.0205 |
| Non-resource-based city | -0.0181*** | -0.0517** |
The stronger policy effect observed in cities with higher environmental regulation intensity suggests that smart city construction and environmental regulation are complementary rather than substitutive. Stringent environmental regulation provides stronger incentives for governments and enterprises to adopt digital technologies, improve environmental monitoring, and optimize resource allocation. Consequently, the governance advantages brought by smart city construction can be translated more effectively into CRPC outcomes.
The heterogeneous results indicate that the environmental effects of smart city construction vary substantially across cities with different resource endowments and development stages. Specifically, smart city construction significantly reduces both SO2 and CO2 emissions in growing resource-based cities and non-resource-based cities. For growing cities, abundant resource revenues provide financial support for digital infrastructure investment and technological upgrading, enabling smart city initiatives to simultaneously improve environmental governance and promote low-carbon transformation. Similarly, non-resource-based cities generally possess more diversified industrial structures, stronger innovation capacity, and lower dependence on resource-intensive industries, allowing smart city policies to generate broader environmental benefits.
By contrast, in mature and regenerative resource-based cities, smart city construction significantly reduces SO2 emissions but does not produce a significant reduction in CO2 emissions. This suggests that digital governance and ecological management can effectively improve local environmental quality and conventional pollution control. However, carbon reduction relies more heavily on deep industrial restructuring and energy transition, which require longer adjustment periods and therefore cannot be fully realized in the short term.
The insignificant effects observed in declining resource-based cities may reflect the constraints imposed by shrinking industries, insufficient investment capacity, population outflows, and relatively weak innovation capability. Under these conditions, smart city initiatives alone are insufficient to overcome the structural barriers to CRPC, indicating that digital transformation should be accompanied by industrial revitalization and stronger policy support.
Potential mechanism analysis
Technology dimension
Panel A of Table 12 reports the three-step mediation results for the technology dimension. Smart city construction significantly promotes both GTI and DIC. The coefficients of GTI and DIC on both SO2 and CO2 emission intensity are negative and statistically significant, while the DID coefficients remain negative and significant after the mediators are included, indicating partial mediation through both channels. The association between DIC and SO2 emission intensity is significant only at the 10% level, suggesting that this channel is relatively weaker for SO2 reduction.
Results of the technology dimension test
| Panel A: Three-step mediation results | ||||||
| Variables | (1) | (2) | (3) | (4) | (5) | (6) |
| GTI | SO2 | CO2 | DIC | SO2 | CO2 | |
| DID | 0.0528* | -0.0703** | -0.0509*** | 0.0312*** | -0.0647** | -0.0463*** |
| (1.9304) | (-2.1752) | (-3.5090) | (3.0690) | (-2.0028) | (-3.2099) | |
| GTI | -0.0536** | -0.0242** | ||||
| (-2.3705) | (-2.0392) | |||||
| DIC | -0.0877* | -0.1051*** | ||||
| (-1.9124) | (-4.1486) | |||||
| Panel B: Causal mediation analysis | ||||||
| GTI | DIC | |||||
| NIE | NDE | TE | NIE | NDE | TE | |
| SO2 | -0.0053** | -0.0725** | -0.0778** | -0.0083** | -0.0825*** | -0.0909** |
| (-2.4028) | (-2.1993) | (-1.9844) | (-2.4642) | (-3.0693) | (-2.2791) | |
| CO2 | -0.0626** | -0.0296* | -0.0922** | -0.0183*** | -0.0369** | -0.0552* |
| (-2.0869) | (-1.9217) | (-2.1870) | (-3.3019) | (-2.4327) | (-1.8541) | |
Results of the organization dimension test
| Panel A: Three-step mediation results | ||||||
| Variables | (1) | (2) | (3) | (4) | (5) | (6) |
| IS | SO2 | CO2 | HC | SO2 | CO2 | |
| DID | 0.0101** | -0.0680** | -0.0498*** | 0.0033*** | -0.0695** | -0.0490*** |
| (2.0967) | (-2.1022) | (-3.4448) | (2.8427) | (-2.1546) | (-3.3882) | |
| IS | -0.7096** | -0.3274 | ||||
| (-2.2968) | (-0.6506) | |||||
| HC | -2.3942*** | -0.6898** | ||||
| (-2.7798) | (-1.9911) | |||||
| Panel B: Causal mediation analysis | ||||||
| IS | HC | |||||
| NIE | NDE | TE | NIE | NDE | TE | |
| SO2 | -0.0013** | -0.1003*** | -0.1017*** | -0.0143** | -0.0428** | -0.0572*** |
| (-2.4810) | (-4.1851) | (-3.0076) | (-2.0590) | (-2.2047) | (-3.4211) | |
| CO2 | -0.0030* | -0.0278* | -0.0308* | -0.0070* | -0.0172** | -0.0242* |
| (-1.7346) | (-1.6844) | (-1.8631) | (-1.8014) | (-2.2118) | (-1.7749) | |
Results of the environment dimension test
| Panel A: Three-step mediation results | ||||||
| Variables | (1) | (2) | (3) | (4) | (5) | (6) |
| GC | SO2 | CO2 | WTC | SO2 | CO2 | |
| DID | 1.6216*** | -0.0696** | -0.0516*** | 0.0315** | -0.0679** | -0.0500*** |
| (3.1045) | (-2.1538) | (-3.5671) | (1.9991) | (-2.1044) | (-3.4668) | |
| GC | -0.0013* | -0.0012*** | ||||
| (-1.8401) | (-3.3972) | |||||
| WTC | -0.0158* | -0.0118*** | ||||
| (-1.8536) | (-2.6200) | |||||
| Panel B: Causal mediation analysis | ||||||
| GC | WTC | |||||
| NIE | NDE | TE | NIE | NDE | TE | |
| SO2 | -0.0056** | -0.0447* | -0.0503*** | -0.0018*** | -0.0780** | -0.0799*** |
| (-2.1915) | (-1.8622) | (-3.2761) | (-4.3805) | (-2.1382) | (-3.5759) | |
| CO2 | -0.0112* | -0.0243 | -0.0354*** | -0.0110** | -0.0090* | -0.0199** |
| (-1.8611) | (-0.7297) | (-2.8443) | (-2.2977) | (-1.8047) | (-2.0982) | |
Panel B of Table 12 further reports the causal mediation results. The natural indirect effects (NIE) for both GTI and DIC are significantly negative for SO2 and CO2 emission intensities, providing evidence consistent with the mediated pathways identified in Panel A of Table 12. The natural direct effects (NDE) also remain negative and significant, indicating that smart city construction exerts a direct effect on CRPC beyond these technology-dimension channels. Taken together, the results from both panels support Hypothesis 2 that smart city construction may promote CRPC through green innovation and digital infrastructure as plausible transmission channels.
Organization dimension
Panel A of Table 13 reports the three-step mediation results for the organization dimension. Smart city construction significantly promotes both industrial structure upgrading and HC. IS is significantly associated with lower SO2 emission intensity, but its coefficient for CO2 emission intensity is statistically insignificant. By contrast, HC is significantly associated with reductions in both SO2 and CO2 emission intensity. The DID coefficients remain negative and significant after the mediators are included, indicating partial mediation through the supported channels.
Panel B of Table 13 confirms these findings. The natural indirect effects (NIE) for both IS and HC are negative and statistically significant for SO2 emission intensity and are also negative for CO2 emission intensity, although the CO2 effects are relatively weaker. This suggests that organizational adjustments operate more directly on conventional air pollutants than on carbon emissions. The natural direct effects (NDE) remain negative and significant for both channels, indicating that smart city construction also exerts a direct effect on CRPC beyond the organization-dimension pathways. These results are consistent with Hypothesis 3 that smart city construction may promote CRPC through industrial structure upgrading and human capital optimization as plausible transmission channels.
Environment dimension
Panel A of Table 14 shows that smart city construction significantly improves the green coverage rate. GC is negatively and significantly associated with both SO2 and CO2 emission intensity, while the DID coefficients remain negative and significant after GC is included, indicating partial mediation through this channel. Panel B of Table 14 provides further evidence that the NIE of GC are negative and significant for both outcomes. The NDE remains significant for SO2 but is statistically insignificant for CO2, suggesting that the carbon-reduction effect associated with GC operates primarily through the indirect channel. These findings support GC as a plausible transmission channel through which smart city construction promotes CRPC.
Panel A of Table 14 also presents the mechanism test results for pollution treatment capacity as a mediator. Smart city construction significantly enhances WTC, and the coefficients of WTC on both SO2 and CO2 emission intensities are significantly negative. The DID coefficients remain significant after including WTC, indicating partial mediation through this channel. Panel B of Table 14 further confirms that the NIE for WTC are significantly negative for both SO2 and CO2, and the NDE also remain negative and significant, suggesting that pollution control capacity serves as a balanced and plausible transmission channel through which smart city construction promotes CRPC across both pollutant dimensions. Taken together, the results from both panels support Hypothesis 4.
Discussion
The empirical results enrich the literature in at least three respects. First, they show that a policy not originally designed as a direct environmental intervention can still generate substantial environmental gains when it reshapes urban governance capacity, data integration, and resource allocation. This finding extends the existing co-reduction literature, which has mainly focused on environmental policies with explicit regulatory objectives, by showing that digital governance reforms can also serve as effective instruments for CRPC.
Second, the results suggest that the environmental effects of smart city construction should be understood as a systemic governance outcome rather than a purely technological outcome. The mechanism analysis provides evidence that the co-reduction effect is not driven by digital infrastructure alone. Instead, it may operate through multiple technological, organizational, and environmental channels, although the strength of the evidence varies across individual mechanisms. This interpretation is consistent with the TOE framework and helps explain why smart city construction produces broader environmental consequences than those captured by single-indicator studies.
Third, the heterogeneity results indicate that the effectiveness of smart city construction depends on local governance capacity and structural conditions. The stronger effects observed in cities with more stringent environmental regulation suggest that digital governance complements rather than substitutes for formal regulation. Likewise, the stronger effects in growing and non-resource-based cities imply that the environmental returns to smart city construction are shaped by development stage and industrial structure. In this sense, smart city policy is not a uniform solution, and its effectiveness depends on whether cities possess the institutional and economic conditions required to translate digital capacity into environmental improvement.
More broadly, the findings have implications for how urban sustainability is evaluated. Existing studies often assess smart city policy through separate outcomes such as innovation, carbon emissions, or pollution abatement. The evidence presented here suggests that a more meaningful assessment should focus on whether digital transformation improves the joint governance of multiple environmental pressures. For rapidly urbanizing economies, this broader perspective is especially important because climate mitigation and local environmental quality are closely interconnected in practice.
SPATIAL EFFECTS OF SMART CITY CONSTRUCTION
Spatial autocorrelation
Prior to conducting spatial econometric analysis, it is necessary to test the dependent variables for spatial dependence. This study employs the Global Moran’s I index to test for spatial autocorrelation in SO2 emission intensity and carbon emission intensity, respectively. The model is constructed as follows:
where n represents the total number of spatial units; xi and xj denote the observed values of spatial units i and j, respectively;
The calculation results are shown in Figure 6. The results show that the Global Moran’s I values for SO2 and CO2 emission intensities are consistently positive, with all corresponding P-values below 0.05. This indicates that cities with similar emission characteristics tend to cluster geographically, and spatial dependence should therefore be taken into account in the empirical analysis.
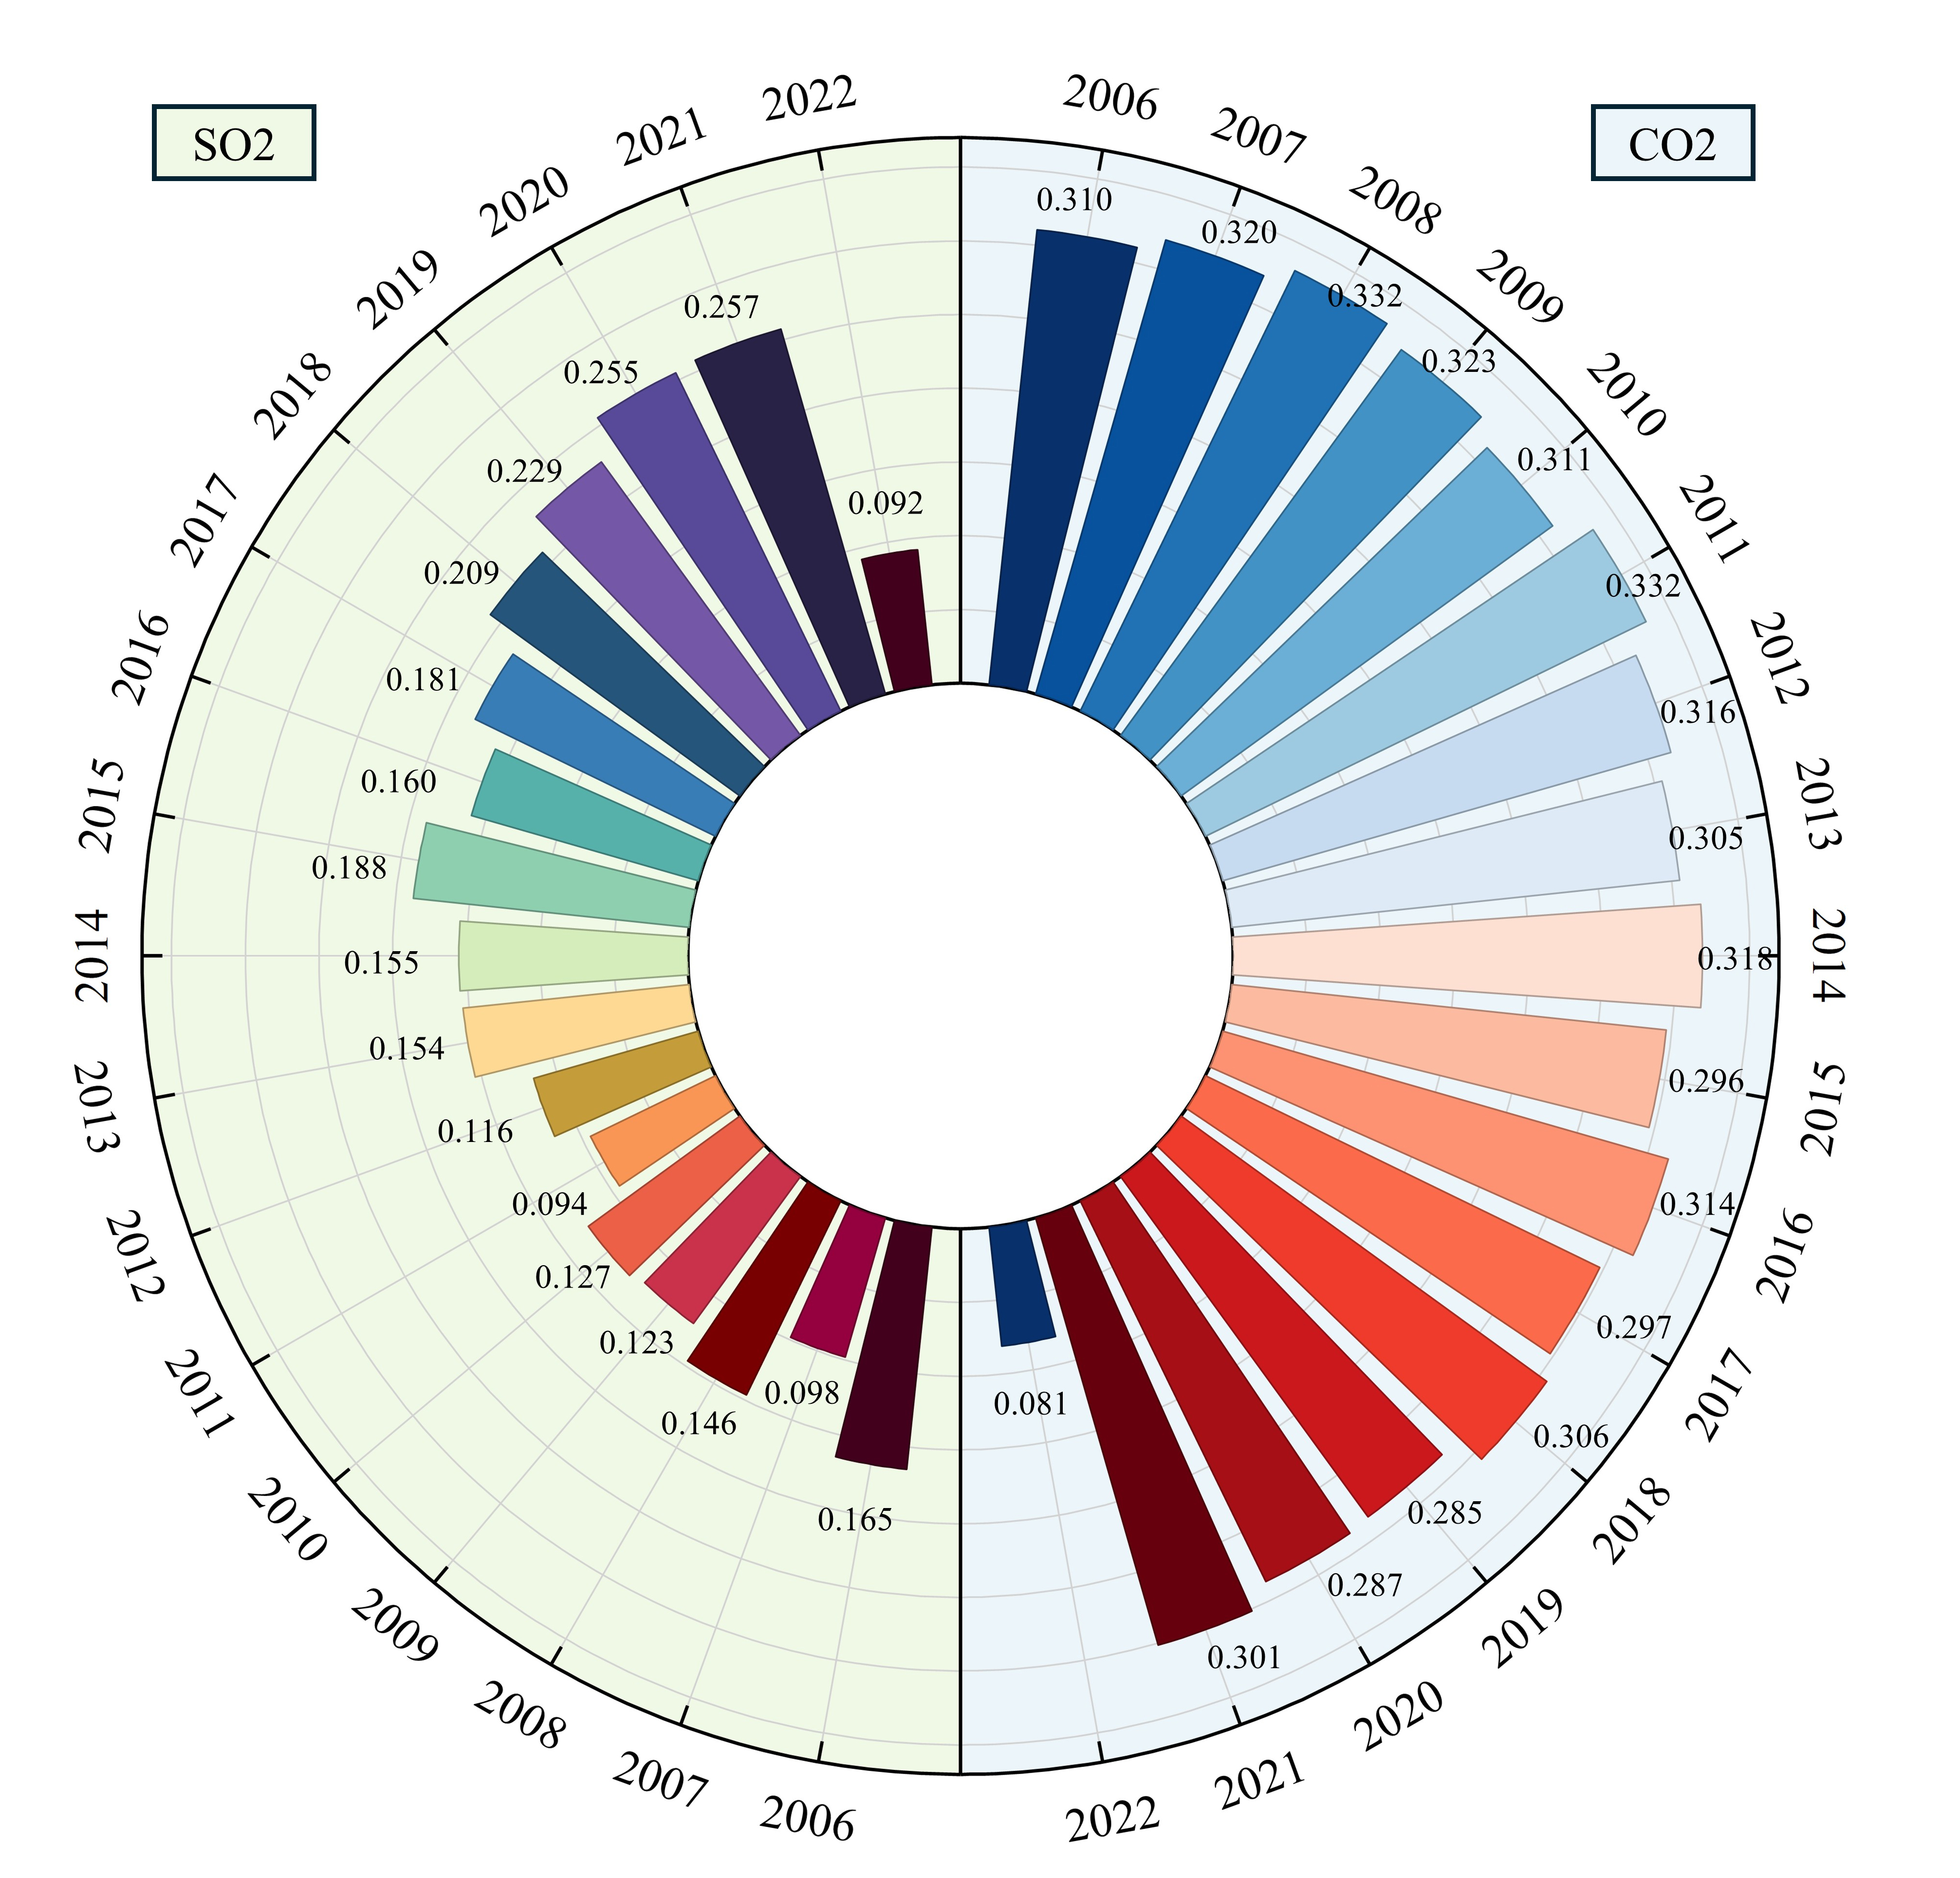
Figure 6. Global Moran’s I.
The local Moran scatterplots [Figures 7 and 8] further reveal clear spatial clustering patterns. Over time, the concentration of high-high clusters declines while the concentration of low-low clusters rises, suggesting that urban environmental performance is not randomly distributed across space and that environmental improvement may diffuse across cities.
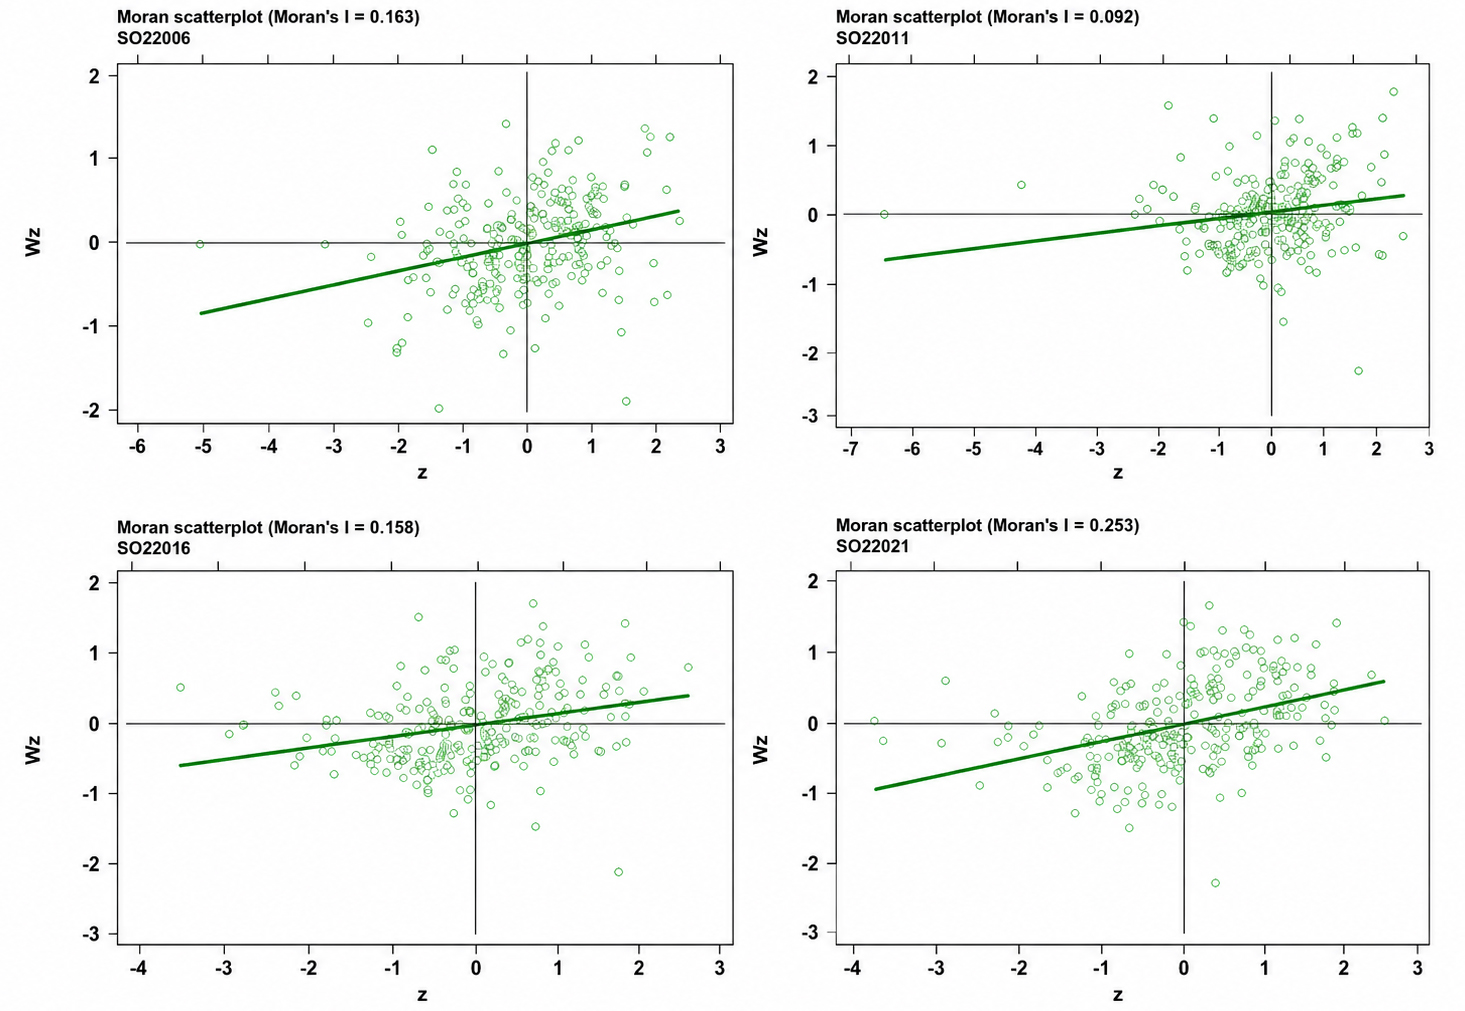
Figure 7. Local Moran scatter plot of SO2 emission intensity in certain years.
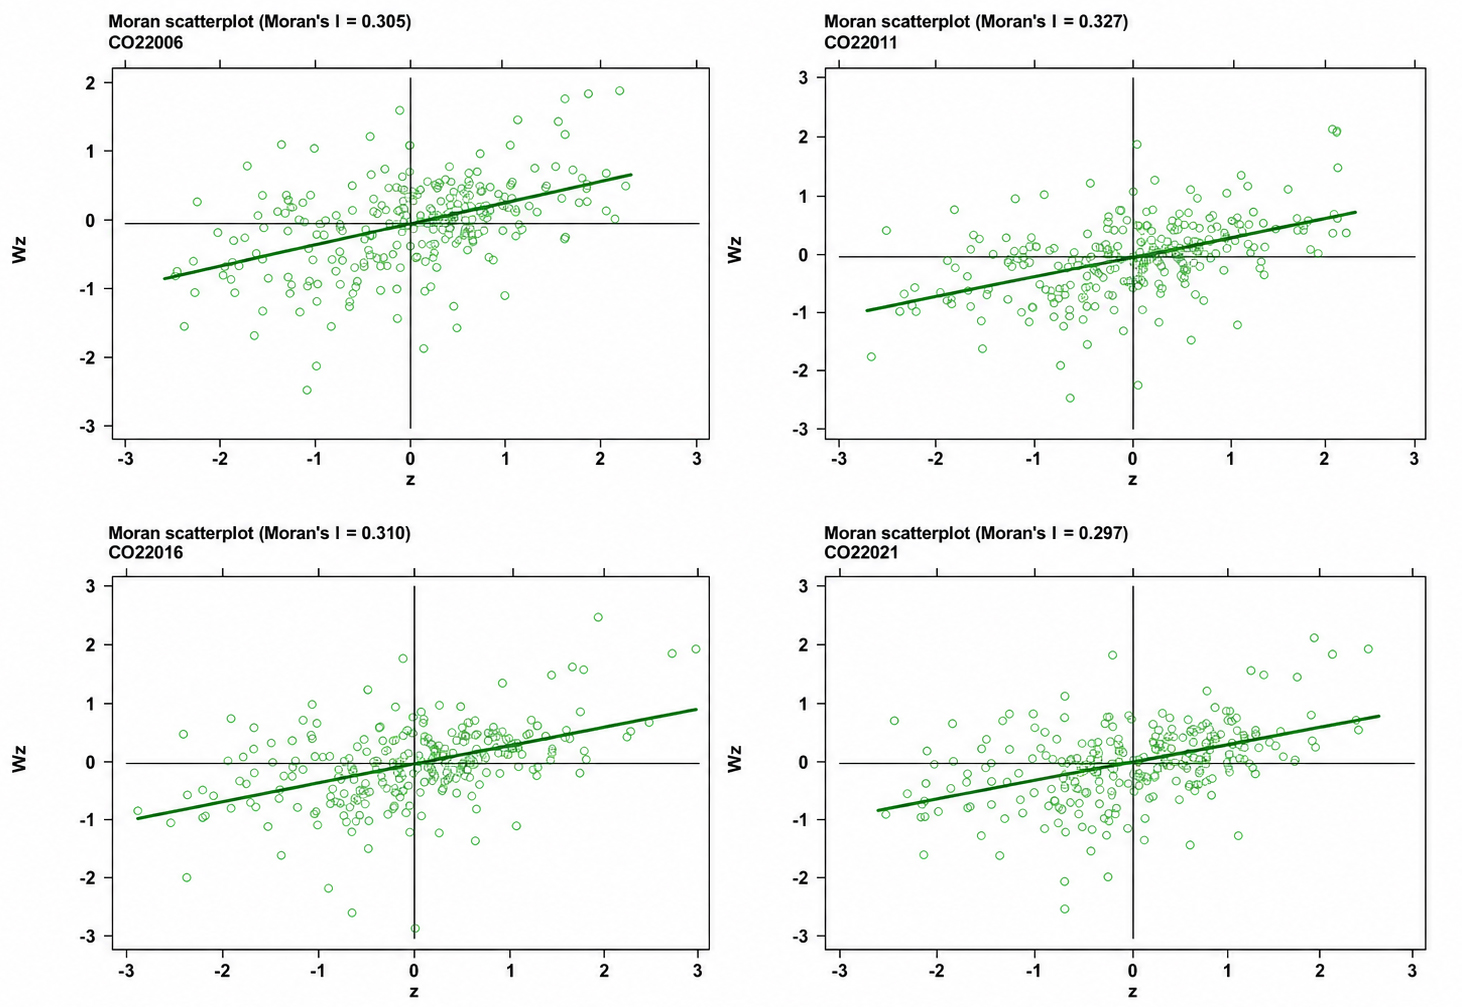
Figure 8. Local Moran scatter plot of CO2 emission intensity in certain years.
Spatial model specification and estimation
This study employs Lagrange multiplier (LM) tests and likelihood ratio (LR) tests to select the appropriate spatial econometric model. Tables 15 and 16 present the LM test and LR test results, respectively. Both tests significantly reject the null hypothesis, indicating that the Spatial Durbin Model (SDM) should be adopted for analysis. Consequently, this study applies the Spatial Difference-in-Differences method combined with the SDM to examine whether smart city construction exerts spatial effects on the synergistic governance of pollution and carbon reduction at the urban level.
LM test results
| Variables | Test type | LM test | Robustness LM test | ||
| Test value | P value | Test value | P value | ||
| SO2 | SEM | 1859.339 | 0.000 | 152.363 | 0.000 |
| SAR | 1981.055 | 0.000 | 274.080 | 0.000 | |
| CO2 | SEM | 985.804 | 0.000 | 919.473 | 0.000 |
| SAR | 150.394 | 0.000 | 84.063 | 0.000 | |
LR test results
| Variables | Test type | LR chi2 (6) | Prob > chi2 |
| SO2 | Irtest sdm sar | 77.34 | 0.0000 |
| lrtest sdm sem | 385.51 | 0.0000 | |
| CO2 | Irtest sdm sar | 56.99 | 0.0000 |
| lrtest sdm sem | 225.91 | 0.0000 |
Compared with the traditional DID model, the Spatial Difference-in-Differences (SDID) model can examine the spatial spillover effects of smart city construction. Therefore, building upon the baseline regression model, this paper constructs the following SDM:
where Wij represents the spatial weight matrix;
To capture different channels of intercity environmental spillovers, this study constructs a geographical adjacency matrix and an economic distance matrix. The geographical adjacency matrix assigns a value of 1 when two cities share a common administrative boundary and 0 otherwise. It is intended to capture cross-boundary pollution diffusion, regional environmental coordination, and policy imitation among neighboring cities. The economic distance matrix assigns greater weights to cities with more similar levels of economic development and is intended to capture policy learning, technology diffusion, and industrial linkages among economically connected cities. The diagonal elements of both matrices are set to zero, and both matrices are row-standardized before estimation.
A geographical adjacency matrix is selected instead of a geographical inverse-distance matrix because the spatial mechanisms emphasized in this study are primarily associated with direct cross-boundary pollution transmission and administrative coordination among contiguous cities. An inverse-distance matrix assumes a continuous distance-decay relationship and assigns positive connections to almost all city pairs, including geographically distant cities, which may obscure the boundary-based diffusion and governance mechanisms considered here. The economic distance matrix is included as a complementary specification to capture non-geographical linkages among cities.
where i and j are spatial unit identifiers, i,j ∈ [1,n], with n representing the total number of spatial units; W1 takes the value of 1 if the two cities are spatially adjacent, and 0 otherwise; W2 measures the magnitude of economic disparity between two regions, gi denotes the mean value of real GDP for region i over the observation period.
Table 17 presents the empirical results of the SDM utilizing both geographical and economic distance matrices. The estimation results show that the coefficients of the smart city policy variable remain significantly negative under both the geographic and economic matrices. This indicates that smart city construction significantly reduces local sulfur dioxide emission intensity and carbon emission intensity even after spatial dependence is taken into account[15].
Regression results under two matrix conditions
| Variables | Spatial adjacency matrix | Spatial economic distance matrix | ||
| SO2 | CO2 | SO2 | CO2 | |
| (1) | (2) | (3) | (4) | |
| DID | -0.1006*** | -0.0659*** | -0.0934*** | -0.0523*** |
| (-2.8950) | (-4.5786) | (-2.6854) | (-3.5887) | |
| W × DID | -0.2932*** | -0.2821*** | -0.2653*** | -0.2460*** |
| (-4.8579) | (-12.4323) | (-3.7188) | (-9.3637) | |
| rho | 0.7359*** | 0.5832*** | 0.8017*** | 0.6738*** |
| (79.9421) | (46.2544) | (82.5925) | (46.8458) | |
| sigma2_e | 0.3301*** | 0.0590*** | 0.3247*** | 0.0583*** |
| (45.4537) | (45.8389) | (46.0032) | (46.0023) | |
| Controls | YES | YES | YES | YES |
| Observations | 4,403 | 4,403 | 4,403 | 4,403 |
| R-squared | 0.071 | 0.038 | 0.368 | 0.084 |
| Number of city | 259 | 259 | 259 | 259 |
More importantly, the coefficients of the spatial interaction term are also significantly negative. Specifically, geographical proximity generates stronger synergistic effects owing to the natural dispersion patterns of pollutants and the necessity of administrative coordination in neighboring regions[75]. This suggests that smart city construction in one city can improve the co-reduction performance of neighboring or economically connected cities through spillover effects.
The spatial spillover effect under the geographical weight matrix is stronger than that under the economic weight matrix, suggesting that geographical proximity plays a more important role than economic linkages in transmitting the environmental benefits of smart city construction. This finding is consistent with the characteristics of pollution diffusion and regional environmental governance. Air pollutants such as SO2 can spread across adjacent administrative boundaries through atmospheric transport, while neighboring cities are also more likely to engage in joint environmental governance, policy coordination, and information sharing[76]. In contrast, although economically connected cities facilitate technology diffusion and industrial collaboration, these channels generally influence environmental performance more indirectly and require a longer period to generate observable co-reduction effects.
Spatial effect decomposition and discussion
To further clarify the magnitude of spatial effects, this study decomposes the estimated impacts into direct effects, indirect effects, and total effects. The decomposition results in Table 18 show that smart city construction has significantly negative direct, indirect, and total effects on both sulfur dioxide emission intensity and carbon emission intensity under the spatial adjacency matrix.
Decomposition results of the spatial Durbin effect
| Variables | SO2 | CO2 | ||||
| (1) | (2) | (3) | (4) | (5) | (6) | |
| Direct effect | Indirect effect | Total effect | Direct effect | Indirect effect | Total effect | |
| DID | -0.2084*** | -1.2632*** | -1.4716*** | -0.1246*** | -0.6985*** | -0.8231*** |
| (-4.7744) | (-6.3771) | (-6.4639) | (-8.2829) | (-17.4413) | (-17.9819) | |
| Controls | YES | YES | YES | YES | YES | YES |
| Observations | 4,403 | 4,403 | 4,403 | 4,403 | 4,403 | 4,403 |
| R-squared | 0.071 | 0.071 | 0.071 | 0.038 | 0.038 | 0.038 |
| Number of city | 259 | 259 | 259 | 259 | 259 | 259 |
The direct effects indicate that smart city construction improves the local co-reduction performance of pilot cities. The indirect effects show that the policy also generates positive spillovers for surrounding cities. This means that the environmental benefits of smart city construction are not confined to the local jurisdiction in which the policy is implemented.
Several channels may explain these spillover effects. Geographic proximity may facilitate policy imitation, administrative coordination, and the diffusion of environmental governance practices. Economic linkages may promote spillovers through technology transfer, industrial coordination, factor mobility, and the convergence of environmental standards.
Overall, the spatial results suggest that smart city construction generates environmental benefits at both the local and regional levels. These findings highlight the importance of viewing digital urban governance not only as a city-specific reform, but also as a potential driver of CRPC.
CONCLUSIONS AND POLICY IMPLICATIONS
Conclusions
This study examines whether smart city construction, originally introduced as a strategy for digital urban transformation, also contributes to CRPC. Using panel data for 259 prefecture-level cities in China from 2006 to 2022 and exploiting the staggered rollout of the smart city pilot policy, the empirical analysis shows that smart city construction significantly reduces both sulfur dioxide emission intensity and carbon emission intensity. These results indicate that smart city policy generates a clear CRPC effect. This finding extends the understanding of smart city construction beyond technological modernization alone. The environmental value of smart city policy is not confined to the deployment of digital infrastructure or the improvement of administrative efficiency. More fundamentally, it reflects the capacity of digital governance to reorganize information flows, strengthen regulatory responsiveness, and create conditions conducive to coordinated environmental improvement.
The mechanism analysis further shows that the co-reduction effect of smart city construction is generated through multiple and interconnected pathways. In the technology dimension, smart city construction promotes green innovation and digital infrastructure development. In the organization dimension, it facilitates industrial upgrading and improves human capital. In the environment dimension, it strengthens ecological investment and pollution control capacity. Taken together, these findings suggest that the environmental effects of smart city construction should be understood as the outcome of systemic urban transformation rather than isolated technological change.
The results also reveal that the effects of smart city construction are conditioned by differences in local governance and structural characteristics. The co-reduction effect is more pronounced in cities with stronger environmental regulation, in growing cities, and in non-resource-based cities, indicating that the environmental returns to digital transformation depend on supportive institutional and economic conditions. In addition, significant spatial spillover effects suggest that the environmental benefits of smart city construction are not confined to pilot cities themselves, but may also extend to geographically proximate and economically connected cities.
Overall, the findings support a broader conclusion: digital urban governance can become an important pathway toward integrated environmental governance. When combined with industrial transformation, ecological investment, and effective regulatory implementation, smart city construction can contribute not only to more efficient urban management, but also to CRPC.
Policy implications
Several policy implications follow from these findings. First, governments should continue promoting smart city construction by strengthening digital infrastructure, improving data-sharing mechanisms, and enhancing intelligent environmental governance platforms, thereby facilitating the coordinated reduction of air pollutants and carbon emissions.
Second, since the empirical results confirm the importance of technological, organizational, and environmental channels, policymakers should promote coordinated policies across these three dimensions. Specifically, greater emphasis should be placed on green technological innovation, industrial upgrading, human capital cultivation, ecological construction, and pollution control to maximize the environmental benefits of smart city initiatives.
Third, smart city construction should be better integrated with environmental regulation. In regions with stronger regulatory capacity, digital technologies can further improve environmental monitoring and enforcement efficiency. In regions with relatively weak environmental regulation, governments should first strengthen institutional capacity to ensure the effective implementation of digital governance.
Fourth, resource-based cities should formulate differentiated smart city strategies according to their development stage. Growing cities should continue integrating digital technologies with green industrial transformation. Mature and regenerative cities should accelerate energy structure adjustment and low-carbon technological innovation. Declining resource-based cities require stronger fiscal support, industrial revitalization, and innovation investment to overcome structural constraints before smart city construction can generate significant environmental benefits.
Finally, given the significant geographical spillover effects, neighboring cities should strengthen cross-regional cooperation in environmental monitoring, information sharing, and joint pollution prevention and control. Regional coordination mechanisms can amplify the environmental benefits of smart city construction beyond administrative boundaries.
Limitations and future research
This study has several limitations that should be acknowledged. First, the analysis focuses on prefecture-level cities in China, and the external validity of the findings should be assessed with caution in other institutional or urban contexts.
Second, although the study identifies several plausible channels, the mechanism analysis is based on observable city-level indicators and therefore cannot fully capture all dimensions of institutional change associated with smart city construction. Future research may combine micro-level firm or household data with policy evaluation designs to provide a more detailed account of how digital governance affects environmental behavior and performance.
Third, while the study documents spatial spillover effects, the precise pathways of intercity transmission require further examination. Future work could distinguish more clearly among technology diffusion, industrial relocation, infrastructure connectivity, and regional policy coordination as alternative channels of spillover.
Finally, although the TOE framework provides a comprehensive perspective for examining the potential mechanisms through which smart city construction promotes CRPC, the mediation analysis is based on observational data and therefore cannot fully establish the underlying causal transmission processes. Future studies may employ dynamic mediation models or quasi-experimental approaches to further verify these mechanisms.
DECLARATIONS
Authors’ contributions
Conceptual development and research design, manuscript drafting and proofreading, review and approval of the final manuscript: Bu, Y.
Methodology, manuscript drafting and proofreading, visualization: Zhang, X.
Data collection and analysis, manuscript drafting and proofreading: Wu, Y.
Data collection and analysis, econometric regression: Feng, Z.
Research design, overall supervision, review and approval of the final manuscript: Ai, M.
Availability of data and materials
The datasets generated during the current study are available from corresponding author upon reasonable request.
AI and AI-assisted tools statement
During the preparation of this manuscript, Google Gemini (version 3.1 Pro, released 2026.2-19) was used solely to generate the Graphical Abstract, including its icon elements, based on the content and prompts provided by the authors. The AI-generated visual output was reviewed and finalized by the authors and was used only for visual presentation. The tool did not influence the study design, data collection, empirical analysis, interpretation, conclusions, or any other scientific content of the work. All authors take full responsibility for the accuracy, integrity, originality, and final content of the graphical abstract and the manuscript.
Financial support and sponsorship
This work is supported by the National Natural Science Foundation of China (Grant No. 72404065), the Natural Science Foundation of Heilongjiang Province (Grant No. QC2025G003), the Fundamental Research Funds for the Central Universities Project, Harbin Engineering University (Grant No. 3072026WK0905), the Heilongjiang Excellent Doctoral Thesis Funding Project in the New Era (Grant No. LJYXL2023-005), and the Program for Young Talents of Basic Research in Universities of Heilongjiang Province (Grant No. YQJH2023306).
Conflicts of interest
All authors declared that there are no conflicts of interest.
Ethical approval and consent to participate
Not applicable.
Consent for publication
Not applicable.
Copyright
© The Author(s) 2026.
REFERENCES
1. Hu, J. Synergistic effect of pollution reduction and carbon emission mitigation in the digital economy. J. Environ. Manage. 2023, 337, 117755.
2. Nie, C.; Lee, C. Synergy of pollution control and carbon reduction in China: spatial-temporal characteristics, regional differences, and convergence. Environ. Impact. Assess. Rev. 2023, 101, 107110.
3. Shen, N.; Zhang, L.; Wang, Q. The empowerment of smart city construction on the synergy effect of pollution control and carbon reduce in China: empirical analysis with double machine learning method. J. Clean. Prod. 2025, 519, 145958.
4. Yue, A.; Mao, C.; Wang, Z.; Peng, W.; Zhao, S. Finding the pioneers of China’s smart cities: from the perspective of construction efficiency and construction performance. Technol. Forecast. Soc. Change. 2024, 204, 123410.
5. Luo, F.; Li, T.; Bu, Y. Synergistic effects of green finance and big data dual pilots on energy resilience: evidence from improved synthetic control methods. Energy. Policy. 2026, 214, 115270.
6. Feng, X.; Zhao, Y.; Yan, R. Does carbon emission trading policy has emission reduction effect? An empirical study based on quasi-natural experiment method. J. Environ. Manage. 2024, 351, 119791.
7. Wang, S.; Zhang, Z.; Zhou, Z.; Zhong, S. The carbon emission reduction effect of green fiscal policy: a quasi-natural experiment. Sci. Rep. 2024, 14, 20317.
8. Wang, W.; Wang, H.; Ortiz, J.; Alidaee, B.; Sun, B. The role of economic development on the effectiveness of industrial pollution reduction policy in Chinese cities. J. Clean. Prod. 2022, 339, 130709.
9. Ren, Z.; Zheng, J.; Jiao, L.; et al. The synergic impacts of air pollution control policies on pollutants and carbon emissions. J. Environ. Manage. 2024, 370, 122730.
10. Xian, B.; Wang, Y.; Xu, Y.; Wang, J.; Li, X. Assessment of the co-benefits of China’s carbon trading policy on carbon emissions reduction and air pollution control in multiple sectors. Econ. Anal. Policy. 2024, 81, 1322-35.
11. Du, W.; Li, M. Assessing the impact of environmental regulation on pollution abatement and collaborative emissions reduction: micro-evidence from Chinese industrial enterprises. Environ. Impact. Assess. Rev. 2020, 82, 106382.
12. Wang, H.; Gu, K.; Dong, F.; Sun, H. Does the low-carbon city pilot policy achieve the synergistic effect of pollution and carbon reduction? Energy. Environ. 2024, 35, 569-96.
13. Liu, D.; Liu, W.; He, Y. How does the intensive use of urban construction land improve carbon emission efficiency? Evidence from the panel data of 30 provinces in China. Land 2024, 13, 2133.
14. Shuang, Q.; Zheng, Z. Analysis on the impact of smart city construction on urban greenness in China’s megacities. J. Environ. Manage. 2024, 355, 120568.
15. Zhang, Y.; Liu, Y.; Zhao, J.; Wang, J. Smart city construction and urban green development: empirical evidence from China. Sci. Rep. 2023, 13, 17366.
16. Chen, W.; Song, H. Fostering renewable energy use through smart city construction: the role of national innovation systems. Energy. Strategy. Rev. 2025, 58, 101690.
17. Luo, Q.; Liu, W.; Wang, C. Air pollution transmission networks in China’s urban agglomerations: drivers and vulnerabilities. Cities 2025, 166, 106237.
18. Bu, Y.; Gao, J.; Zhang, W.; Ai, M. The impact of digital inclusive finance on the collaborative reduction of pollutant and carbon emissions: spatial spillover and mechanism analysis. J. Environ. Manage. 2024, 365, 121550.
19. Guo, D.; Zhang, S.; Hou, H.; Zhang, Y.; Xu, H. Synergistic evaluation methodology for pollution and carbon reduction in the field of solid waste resource utilization. Environ. Impact. Assess. Rev. 2024, 108, 107604.
20. Li, J.; Liu, G.; Dong, J. Coordinated reduction effect of pollutant discharge fees on enterprises’ pollutant and carbon emissions in China. Energy. Econ. 2024, 136, 107707.
21. Yi, L.; Yang, Z. P.; Zhang, Z. K.; Yang, L.; Deng, W. Collaborative governance effects of carbon market on GHG and air pollutants emission reduction in 3E model - analysis based on system dynamics. Heliyon 2023, 9, e22684.
22. Li, S.; Wang, S.; Wu, Q.; et al. Integrated benefits of synergistically reducing air pollutants and carbon dioxide in China. Environ. Sci. Technol. 2024, 58, 14193-202.
23. Mai, W.; Xiong, L.; Liu, B.; Liu, S. Spatial-temporal evolution, drivers, and pathways of the synergistic effects of digital transformation on pollution and carbon reduction in heavily polluting enterprises. Sci. Rep. 2025, 15, 11963.
24. Zhang, Q.; Yin, Z.; Lu, X.; et al. Synergetic roadmap of carbon neutrality and clean air for China. Environ. Sci. Ecotechnol. 2023, 16, 100280.
25. Zou, S.; Fan, X.; Zhou, Y.; Cui, Y. Achieving collaborative pollutant and carbon emissions reduction through digital governance: evidence from Chinese enterprises. Environ. Res. 2024, 263, 120197.
26. Li, M.; Liang, S.; Fan, Y.; Du, W. Can firms achieve the collaborative governance of airborne pollution and greenhouse gases? Energy. Strategy. Rev. 2023, 49, 101183.
27. Bu, Y.; Wang, E.; Qiu, Y.; Möst, D. Impact assessment of population migration on energy consumption and carbon emissions in China: a spatial econometric investigation. Environ. Impact. Assess. Rev. 2022, 93, 106744.
28. Guo, Q.; Wang, Y.; Dong, X. Effects of smart city construction on energy saving and CO2 emission reduction: evidence from China. Appl. Energy. 2022, 313, 118879.
29. Yang, X.; Zhang, D.; Masron, T. A. The impact of smart city construction on achieving peak carbon neutrality: evidence from 31 provinces in China. Land. Use. Policy. 2024, 147, 107372.
30. Wang, L.; Xie, Q.; Xue, F.; Li, Z. Does smart city construction reduce haze pollution? Int. J. Environ. Res. Public. Health. 2022, 19, 16421.
31. Su, Y.; Hu, M.; Yu, X. Does the development of smart cities help protect the environment? J. Environ. Plan. Manag. 2023, 66, 572-89.
32. Tang, J.; Li, Y. Study on the impact of smart energy on carbon emissions in smart cities from single and holistic perspectives - empirical evidence from China. Sustain. Cities. Soc. 2024, 101, 105145.
33. Lund, P. D.; Mikkola, J.; Ypyä, J. Smart energy system design for large clean power schemes in urban areas. J. Clean. Prod. 2015, 103, 437-45.
34. Westerman, G.; Bonnet, D.; McAfee, A. Leading digital: turning technology into business transformation; Harvard Business Press, 2014.
35. Bose, R.; Luo, X. Integrative framework for assessing firms’ potential to undertake green IT initiatives via virtualization - a theoretical perspective. J. Strateg. Inf. Syst. 2011, 20, 38-54.
36. Chen, S.; Li, Q.; Lei, B.; Wang, N. Configurational analysis of the driving paths of Chinese digital economy based on the technology-organization-environment framework. Sage. Open. 2021, 11, 21582440211054500.
37. Li, W.; Xiao, X.; Yang, X.; Li, L. How does digital transformation impact green supply chain development? An empirical analysis based on the TOE theoretical framework. Systems 2023, 11, 416.
38. N’dri, A. B.; Su, Z. Successful configurations of technology-organization-environment factors in digital transformation: evidence from exporting small and medium-sized enterprises in the manufacturing industry. Inf. Manag. 2024, 61, 104030.
39. Ullah, F.; Qayyum, S.; Thaheem, M. J.; Al-turjman, F.; Sepasgozar, S. M. Risk management in sustainable smart cities governance: a TOE framework. Technol. Forecast. Soc. Change. 2021, 167, 120743.
40. Wang, S.; Zhang, X.; Peng, J.; Tan, Y.; Fan, Z. Providing solutions for carbon emission reduction using the TOE framework. Expert. Syst. Appl. 2024, 255, 124547.
41. Chu, Z.; Cheng, M.; Yu, N. N. A smart city is a less polluted city. Technol. Forecast. Soc. Change. 2021, 172, 121037.
42. Zhang, X.; Chen, Y.; Wang, T. Digital economy, CO2 emissions and China’s environmental sustainable development- an analysis based on TVP-VAR model. Econ. Anal. Policy. 2024, 84, 1945-57.
43. Zhao, Z.; Zhao, Y.; Shi, X.; Zheng, L.; Fan, S.; Zuo, S. Green innovation and carbon emission performance: the role of digital economy. Energy. Policy. 2024, 195, 114344.
44. Chiu, Y.; Lee, C. Effects of financial development on energy consumption: the role of country risks. Energy. Econ. 2020, 90, 104833.
45. Neirotti, P.; De Marco, A.; Cagliano, A. C.; Mangano, G.; Scorrano, F. Current trends in smart city initiatives: some stylised facts. Cities 2014, 38, 25-36.
46. Song, T.; Dian, J.; Chen, H. Can smart city construction improve carbon productivity? A quasi-natural experiment based on China’s smart city pilot. Sustain. Cities. Soc. 2023, 92, 104478.
47. Liu, K.; Meng, C.; Tan, J.; Zhang, G. Do smart cities promote a green economy? Evidence from a quasi-experiment of 253 cities in China. Environ. Impact. Assess. Rev. 2023, 99, 107009.
48. Mao, C.; Wang, Z.; Yue, A.; Liu, H.; Peng, W. Evaluation of smart city construction efficiency based on multivariate data fusion: a perspective from China. Ecol. Indic. 2023, 154, 110882.
49. Zhang, M.; Yang, Y.; Du, P.; et al. The effect of public environmental participation on pollution governance in China: the mediating role of local governments’ environmental attention. Environ. Impact. Assess. Rev. 2024, 104, 107345.
50. Liu, L.; Han, P.; Wang, J.; et al. Approaches to the water environment and aquatic ecology governance in basin systems. Water. Sci. Technol. 2025, 92, 894-902.
51. Zhang, J.; Wang, F.; Wang, K.; Lin, W.; Xu, X.; Chen, C. Data-driven intelligent transportation systems: a survey. IEEE. Trans. Intell. Transport. Syst. 2011, 12, 1624-39.
52. Wu, S. Smart cities and urban household carbon emissions: a perspective on smart city development policy in China. J. Clean. Prod. 2022, 373, 133877.
53. Chehri, A.; Mouftah, H. T. Autonomous vehicles in the sustainable cities, the beginning of a green adventure. Sustain. Cities. Soc. 2019, 51, 101751.
54. Li, X. Study on the impact of energy rebound effect on carbon emission reduction at different stages of urbanization in China. Ecol. Indic. 2021, 120, 106983.
55. Qiu, L. Does the construction of smart cities promote urban green innovation? Evidence from China. Appl. Econ. Lett. 2023, 30, 2688-96.
56. Bu, Y.; Zhang, B.; Wang, Z. Environmental dividends of population migration: the collaborative reduction of pollutant and carbon emissions. Energy. Econ. 2026, 159, 109409.
57. Cui, S.; Li, G.; Liu, J. Can the construction of smart cities promote the capital allocation efficiency: evidence from China. Technol. Forecast. Soc. Change. 2024, 208, 123677.
58. Bu, Y.; Zhang, B.; Ai, M.; Hao, Y. The carbon burden of migration: inequality between and within cities. Struct. Change. Econ. Dyn. 2026, 78, 244-62.
59. De Gennaro, M.; Paffumi, E.; Martini, G. Big data for supporting low-carbon road transport policies in europe: applications, challenges and opportunities. Big. Data. Research. 2016, 6, 11-25.
60. Huang, C.; Zhang, X.; Liu, K. Effects of human capital structural evolution on carbon emissions intensity in China: a dual perspective of spatial heterogeneity and nonlinear linkages. Renew. Sustain. Energy. Rev. 2021, 135, 110258.
61. Lv, R.; Gao, H. Effects of smart city construction on employment: mechanism and evidence from China. Empir. Econ. 2023, , 1-33.
62. Chen, Q.; Gong, Z.; Wu, J.; Wang, T. Does digital transformation affect carbon performance through talent? The moderating role of employee structure. J. Clean. Prod. 2024, 435, 140581.
63. Sarkodie, S. A.; Adams, S.; Owusu, P. A.; Leirvik, T.; Ozturk, I. Mitigating degradation and emissions in China: the role of environmental sustainability, human capital and renewable energy. Sci. Total. Environ. 2020, 719, 137530.
64. Wang, F. Does the construction of smart cities make cities green? Evidence from a quasi-natural experiment in China. Cities 2023, 140, 104436.
65. Kong, J.; Hwang, J.; Kim, H. Building smarter cities together: government-to-government partnerships in the development of smart cities. Cities 2025, 156, 105532.
66. Qiao, Y.; Chen, Z.; Chen, Y.; Zheng, T. Deciphering the link between mental health and green space in Shenzhen, China: the mediating impact of residents’ satisfaction. Front. Public. Health. 2021, 9, 561809.
67. Li, Z.; Pan, Y.; Yang, W.; Ma, J.; Zhou, M. Effects of government subsidies on green technology investment and green marketing coordination of supply chain under the cap-and-trade mechanism. Energy. Econ. 2021, 101, 105426.
68. Ma, C.; Yang, H.; Zhang, W.; Huang, S. Low-carbon consumption with government subsidy under asymmetric carbon emission information. J. Clean. Prod. 2021, 318, 128423.
69. Zhang, C.; Guo, S.; Tan, L.; Randhir, T. O. A carbon emission costing method based on carbon value flow analysis. J. Clean. Prod. 2020, 252, 119808.
70. Zhao, R.; Hu, C.; Du, C.; Wang, C.; Sun, L. Synergistic effect assessment of pollution and carbon reduction and pathway of green transformation at regional level in China. J. Clean. Prod. 2025, 495, 145013.
71. Beck, T.; Levine, R.; Levkov, A. Big bad banks? The winners and losers from bank deregulation in the United States. J. Finance. 2010, 65, 1637-67.
72. Yang, G.; Zha, D.; Wang, X.; Chen, Q. Exploring the nonlinear association between environmental regulation and carbon intensity in China: the mediating effect of green technology. Ecol. Indic. 2020, 114, 106309.
73. Shahbaz, M.; Li, J.; Dong, X.; Dong, K. How financial inclusion affects the collaborative reduction of pollutant and carbon emissions: the case of China. Energy. Econ. 2022, 107, 105847.
74. Wang, L.; Shao, J. The energy saving effects of digital infrastructure construction: empirical evidence from Chinese industry. Energy 2024, 294, 130778.
75. Li, Z.; Bai, T.; Tang, C. How does the low-carbon city pilot policy affect the synergistic governance efficiency of carbon and smog? Quasi-experimental evidence from China. J. Clean. Prod. 2022, 373, 133809.
Cite This Article
 Open Access
How to Cite
Download Citation
Export Citation File:
Type of Import
Tips on Downloading Citation
Citation Manager File Format
Type of Import
Direct Import: When the Direct Import option is selected (the default state), a dialogue box will give you the option to Save or Open the downloaded citation data. Choosing Open will either launch your citation manager or give you a choice of applications with which to use the metadata. The Save option saves the file locally for later use.
Indirect Import: When the Indirect Import option is selected, the metadata is displayed and may be copied and pasted as needed.
About This Article
Copyright

Data & Comments
Data
0








Comments
Comments must be written in English. Spam, offensive content, impersonation, and private information will not be permitted. If any comment is reported and identified as inappropriate content by OAE staff, the comment will be removed without notice. If you have any queries or need any help, please contact us at support@oaepublish.com.