

Spatiotemporal PAH patterns in size-fractionated particles (PM>10-PM0.1) from Northern Thailand biomass burning via Sentinel-2
 0
0 Abstract
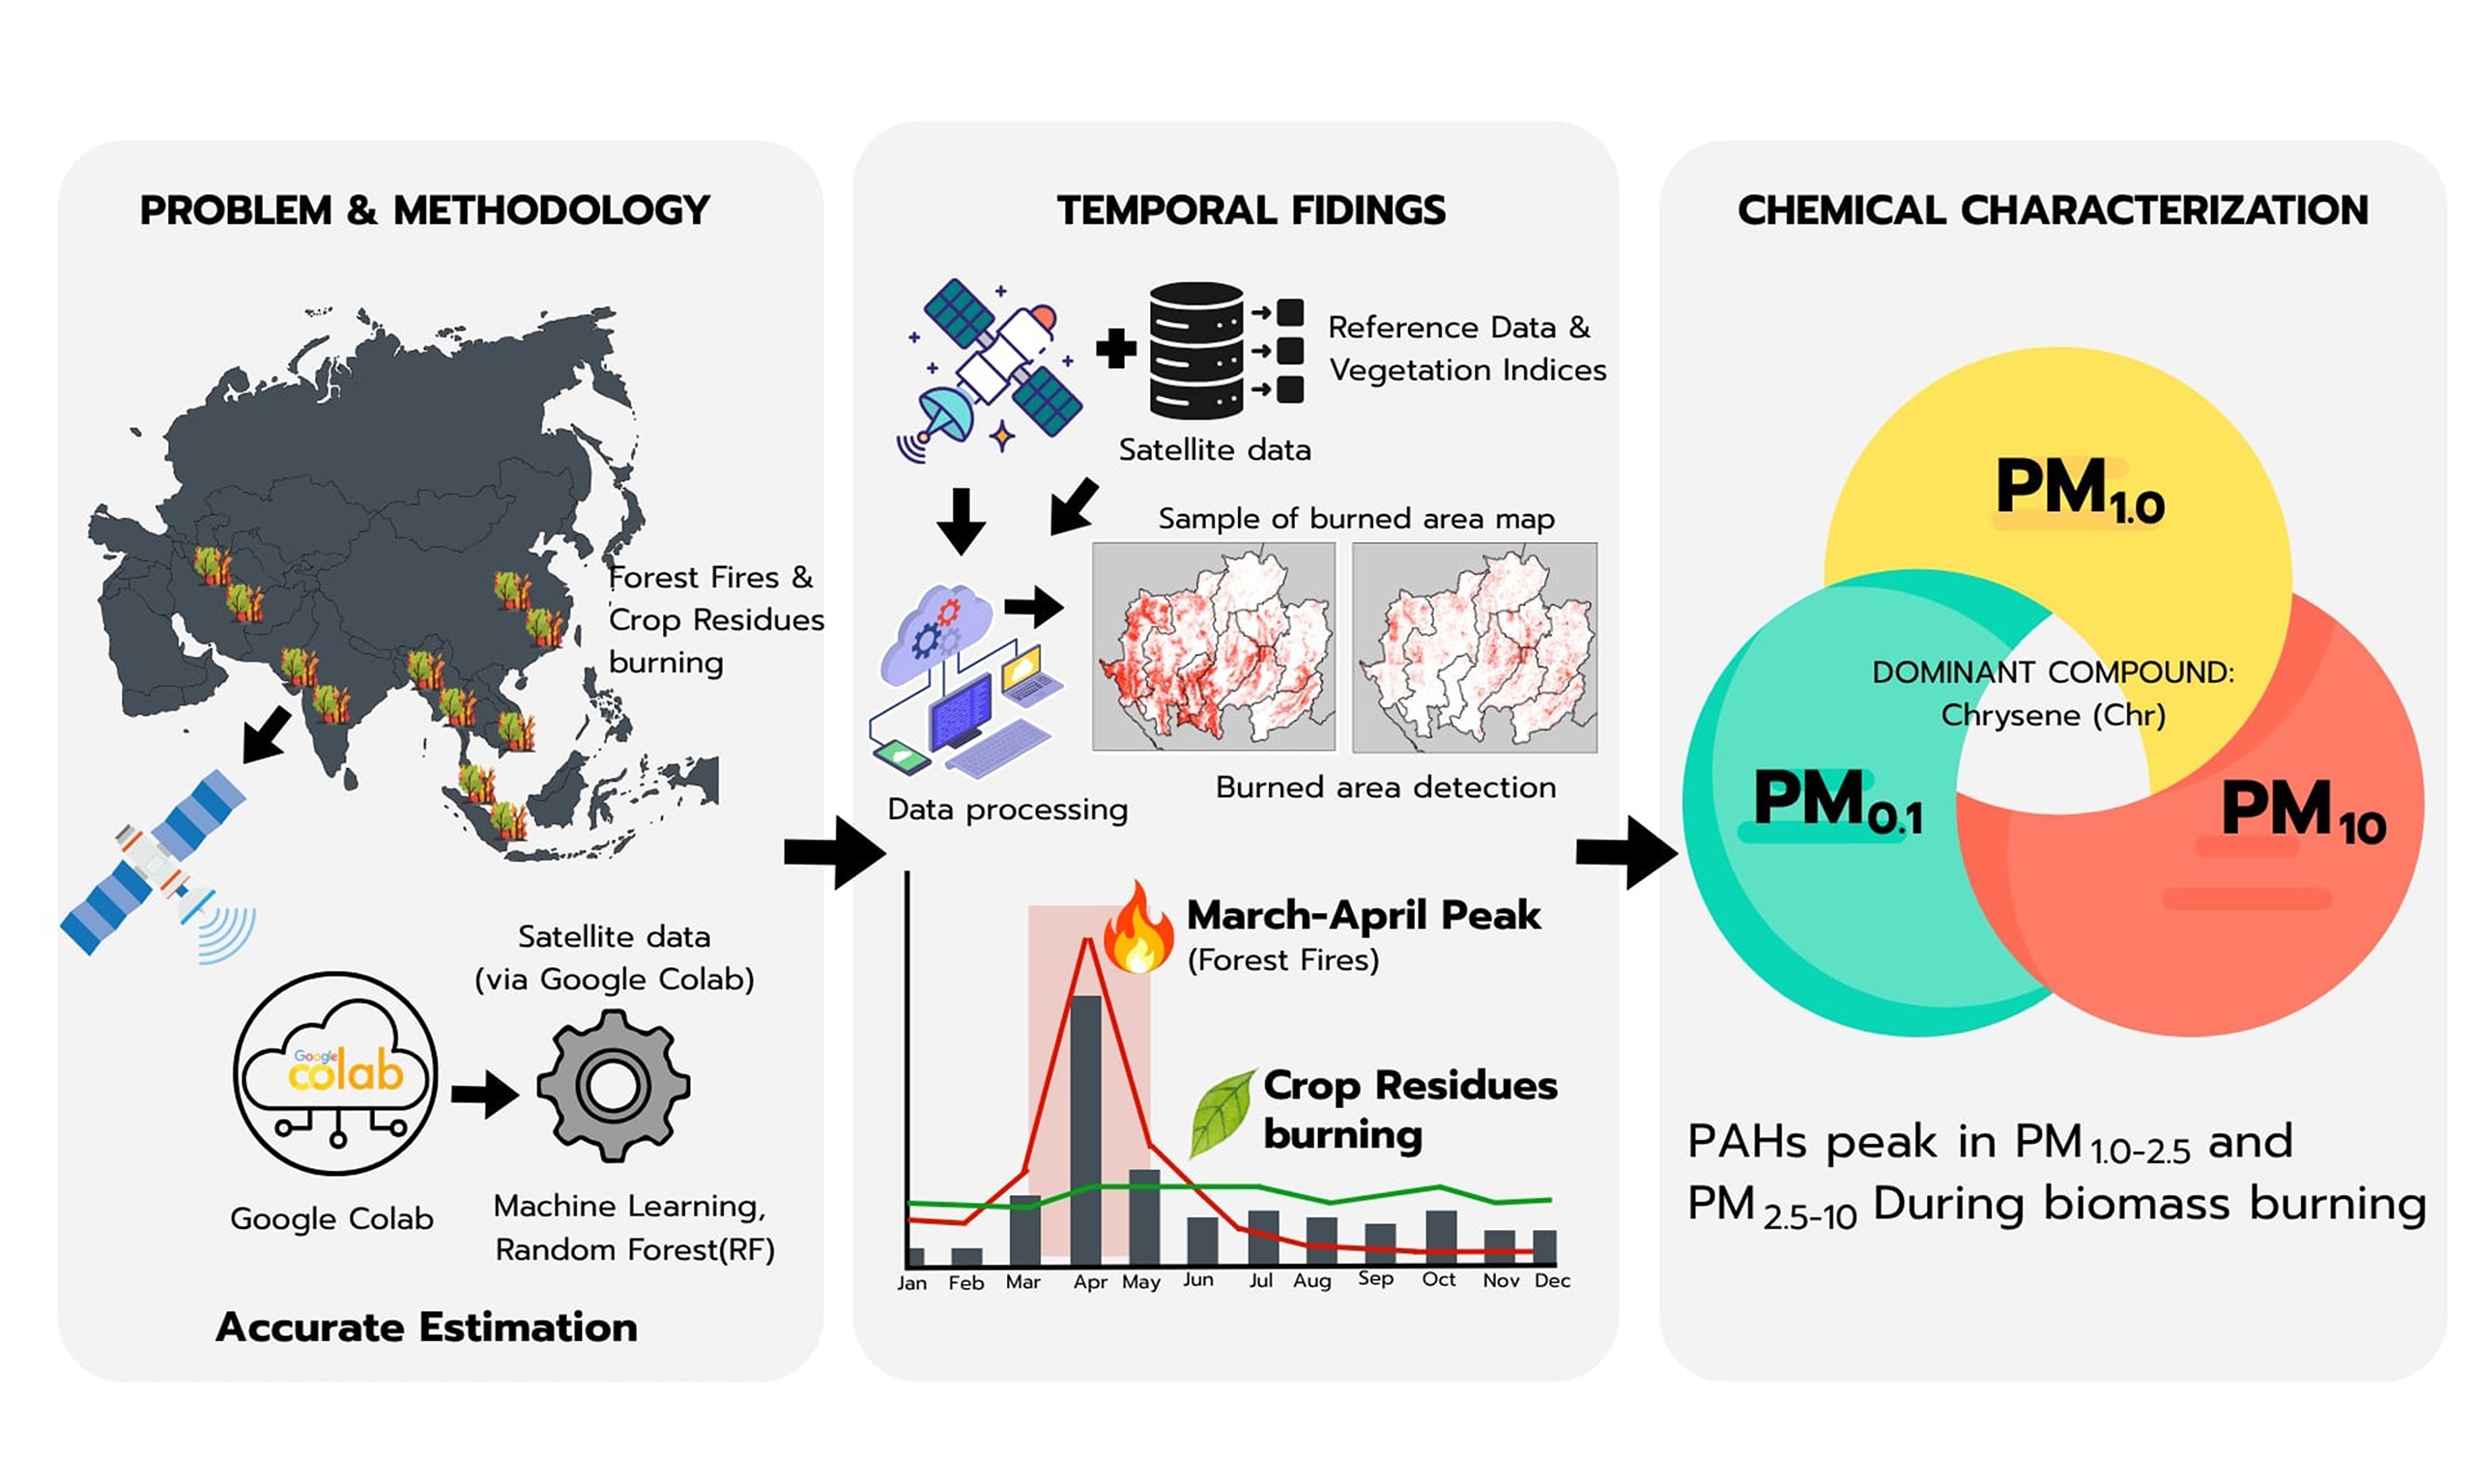
Biomass burning, particularly from forest fires and crop residue burning during the dry season, is a major source of particulate pollution across many Asian countries. However, accurately identifying these emissions remains challenging due to uncertainties in burned area estimation and the limited availability of country-specific emission factors. This study quantified the spatiotemporal distribution of emissions from biomass burning using satellite imagery. Burned areas were classified using a random forest (RF) algorithm implemented on the Google Colaboratory (Colab) platform. The RF model showed strong performance, with a kappa coefficient of 0.85 and an average accuracy of 0.81. Emission estimates for the period 2020-2024 showed that the largest burned area, exceeding 74,908.50 km2, occurred in 2023. Particulate matter–bound polycyclic aromatic hydrocarbons (PM-bound PAHs) were consistently highest in March, when forest fires are most prevalent. Chrysene (Chr) emerged as a dominant compound during the burning period across all particle size fractions, particularly in the PM1.0-2.5 and PM2.5-10 ranges. In contrast, emissions from crop residue burning remained relatively stable throughout the year, reflecting the multiple harvesting cycles typical of agricultural activities.
Keywords
INTRODUCTION
Atmospheric pollution is fundamentally defined by particulate matter (PM) across distinct aerodynamic dimensions of coarse PM, 10 μm or less (PM10), and fine PM, 2.5 μm or less (PM2.5)[1,2]. Coarse PM mostly comes from mechanical processes such as road dust and soil resuspension, whereas fine PM is mostly produced by combustion-related activities and secondary formation. Compared to PM2.5 and PM10, PM with sizes of 0.1 μm or less (PM0.1), often referred to as ultrafine particles (UFPs), is typically less common in the atmosphere[3,4]. However, due to their tiny size and large specific surface area, UFPs can penetrate deeply into the alveolar spaces, enter the systemic circulation, and induce a range of adverse biological responses[5,6]. Exposure to atmospheric PM is a major global public health concern, as numerous epidemiological studies have demonstrated strong associations between PM levels and increased morbidity and mortality[7-9].
Recent studies have linked PM10, PM2.5, PM1.0, and PM0.1[8-11] to respiratory and cardiovascular diseases, including asthma, chronic obstructive pulmonary disease (COPD), and lung cancer[12-14]. For source apportionment, it is very important to accurately measure particle sizes down to PM0.1. This is especially true when evaluating hazardous chemicals such as polycyclic aromatic hydrocarbons (PAHs) in public health assessments. PAHs pose a significant air quality concern due to their toxicity, carcinogenicity, and bioaccumulation[15,16]. Coarse and fine particles accumulate in the upper and middle airways, while UFPs
In northern Thailand, haze episodes (January-April) are mainly due to crop residue burning and forest fires. In upper northern Thailand, most forest fires are human-induced[20]. These fires contribute significantly to emissions. Farming activities, specifically the cultivation of rice, maize, and sugarcane, also add to emissions. Additionally, industrial biomass combustion, such as burning bagasse, plays a major role. The complex mountainous terrain in northern Thailand limits air circulation, thereby intensifying local pollutant exposure. Topographical confinement also impedes fire-spot detection, potentially accelerating fire spread. Therefore, remote sensing is essential for rapid and cost-effective monitoring. Improvements in remote sensing, such as Sentinel-2 multispectral imaging (MSI), provide high-resolution spatial data (10-20 m), enabling more accurate burned-area classification compared with coarser-resolution products such as moderate resolution imaging spectroradiometer (MODIS)[21]. When combined with machine learning algorithms such as random forest (RF), classification accuracy can be further improved.
Although remote sensing technologies have been widely used, earlier emission inventories in Thailand have mostly relied on low-resolution satellite data or the differenced normalized burn ratio (dNBR), which requires paired pre- and post-fire images. Additionally, most regional studies have focused on total PM2.5 or PM10 mass, often neglecting the toxicological implications of UFPs and the size-resolved distributions of carcinogenic chemicals. This work aims to fill these gaps by utilizing Google Colaboratory (Colab) to interpret Sentinel-2 MSI images for high-resolution spatiotemporal quantification of emissions. In addition, an RF algorithm is employed to map burned regions (defined as the “GSR procedure” in this work) in northern Thailand from 2020 to 2024. The study encompasses forested regions and major agricultural fields, with a notable innovation being the assessment of PM-bound PAH emissions across six particle-size fractions, ranging from coarse particles (> 10 µm) to UFPs (< 0.1 µm). By mapping these distributions across forested and agricultural lands, this work provides useful information on particle-bound PAHs and informs strategies for their control and reduction, thereby contributing to combating PM pollution in tropical biomass-burning regions.
EXPERIMENTAL
Overviews
This study examines PM-bound PAH emissions from biomass combustion in forested and agricultural regions through satellite-based analysis. Figure 1 presents the conceptual framework, outlining the steps from data processing to emissions estimation. We applied the GSR procedure, combined with the soil-adjusted vegetation index (SAVI) and the modified normalized difference water index (MNDWI), to improve classification accuracy and reduce errors. After accurately measuring the burned area, spatial data were used to estimate PAH emissions using emission factors (EFs) specific to each of the six particle size fractions, thereby quantifying the total emissions.
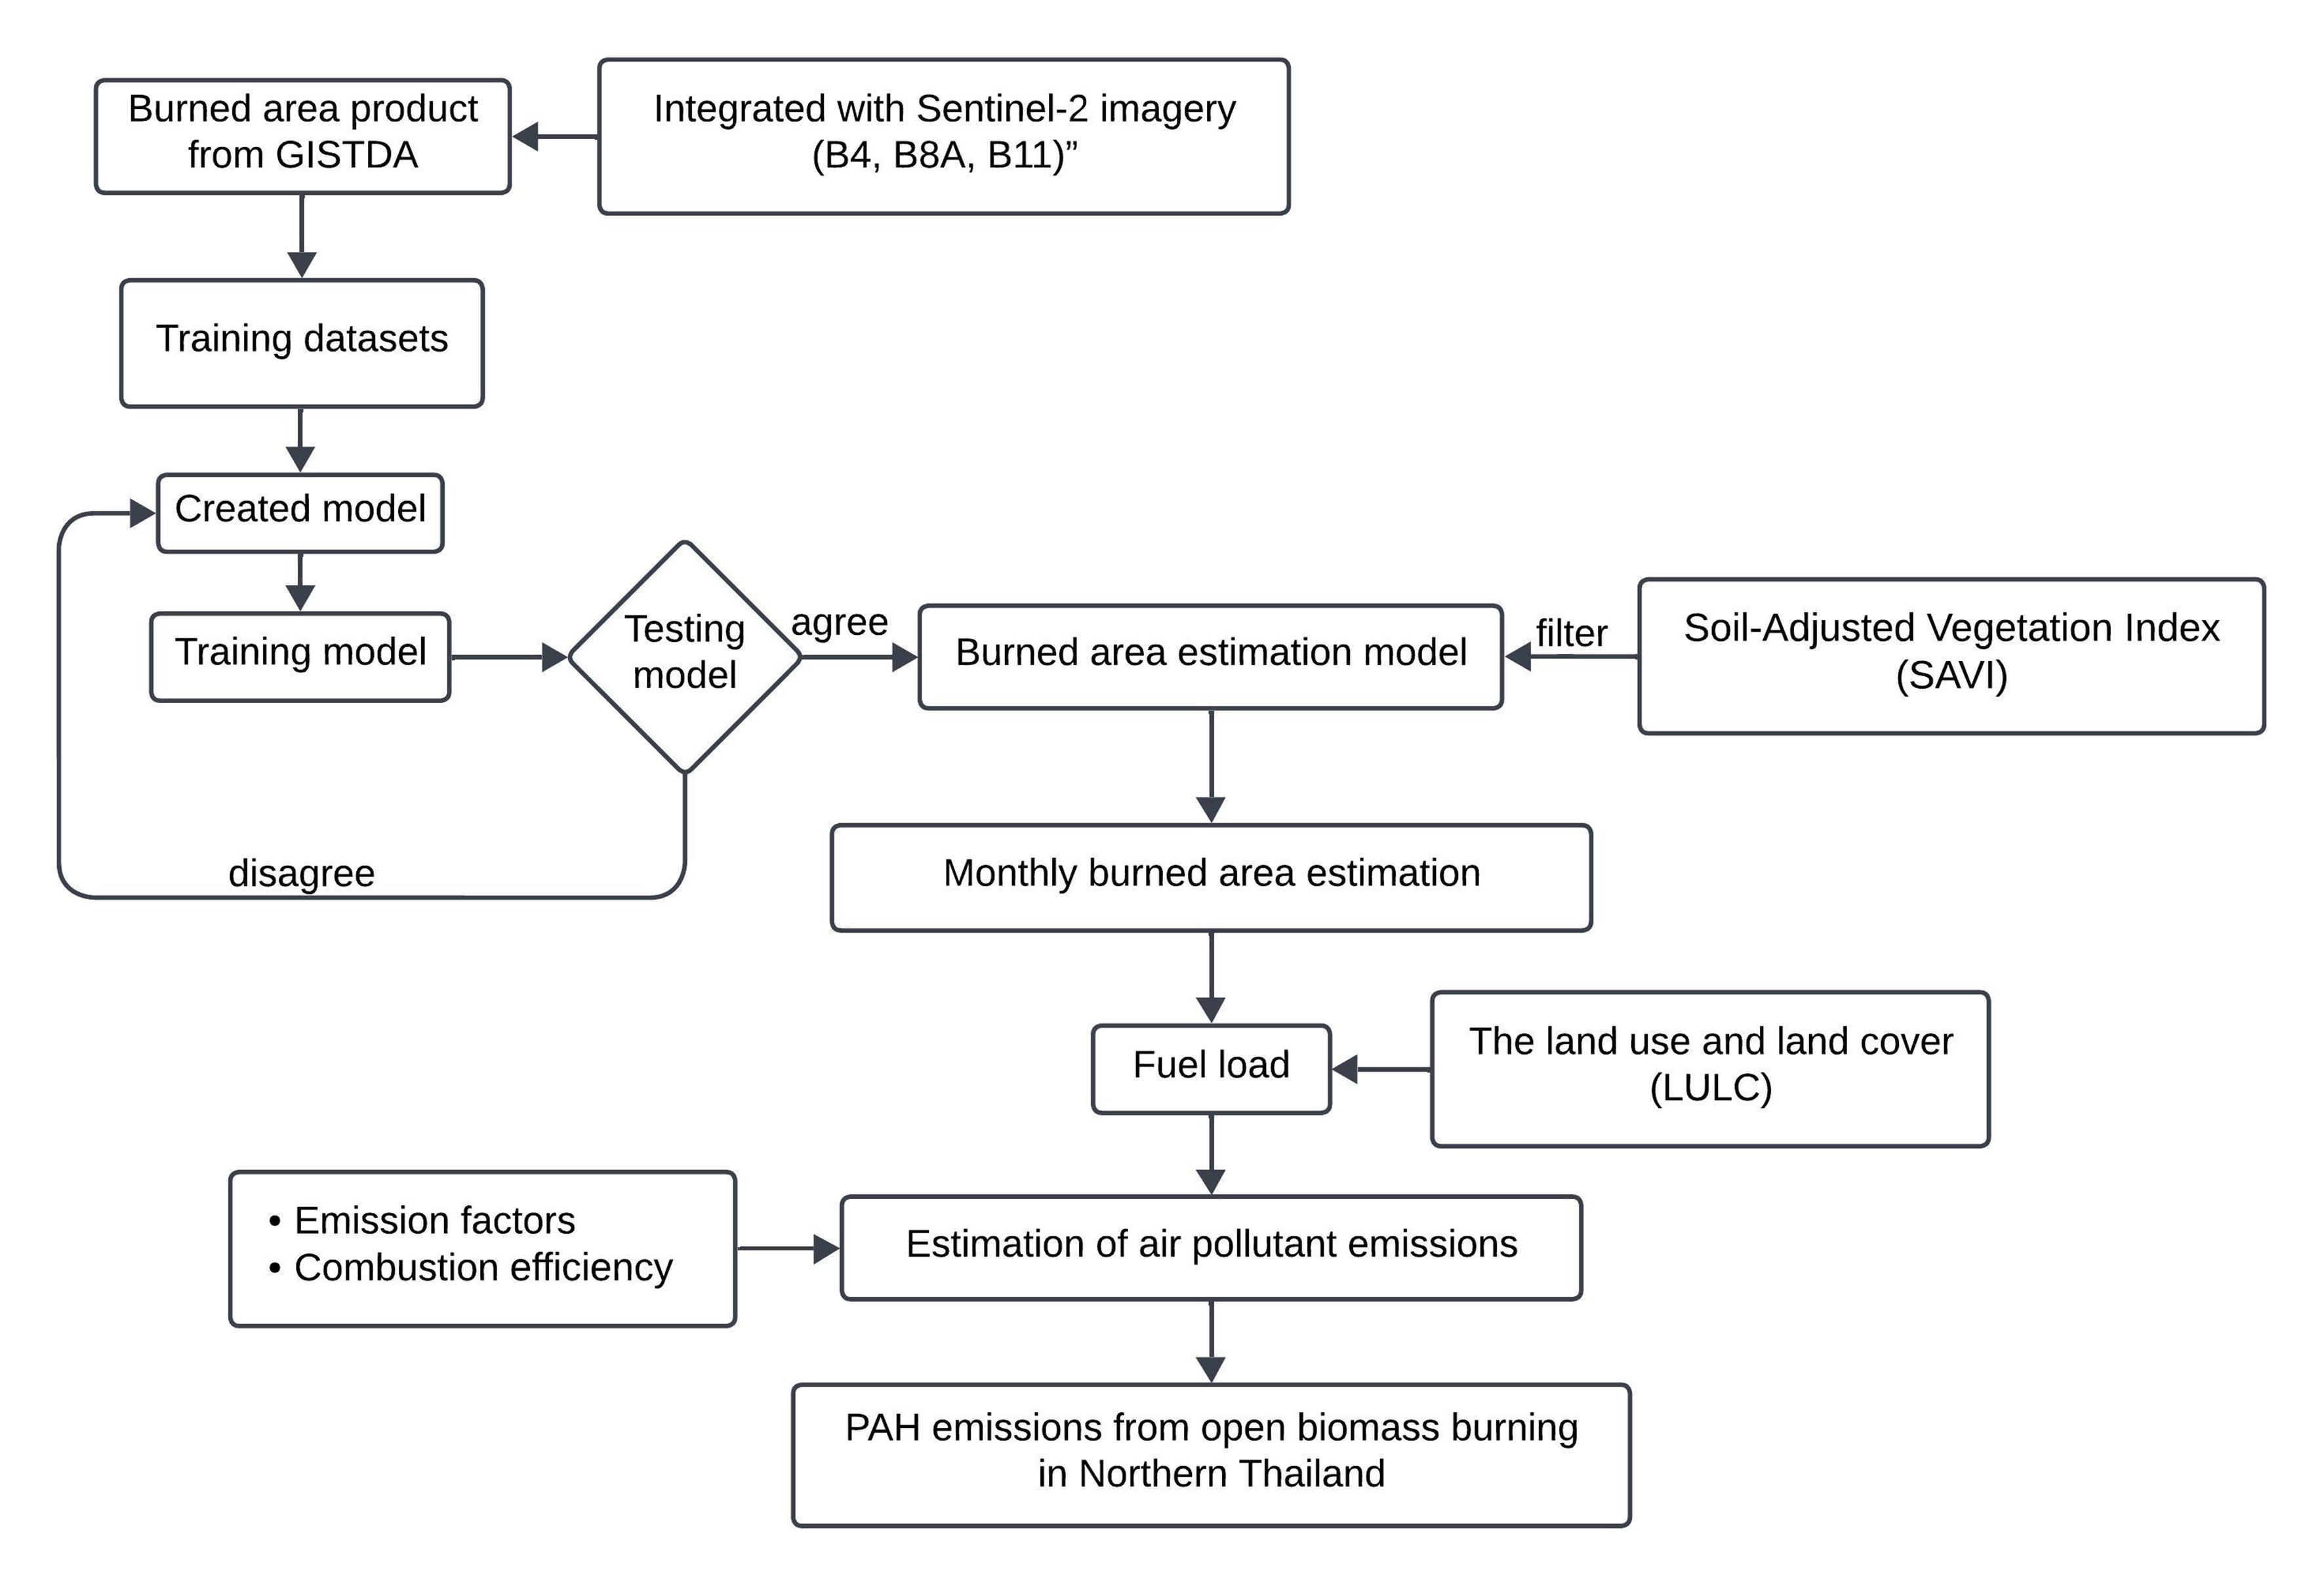
Figure 1. Flowchart of the methodology. GISTDA: Geo-Informatics and Space Technology Development Agency; PAHs: polycyclic aromatic hydrocarbons.
Data collections
The GSR procedure was utilized to delineate burned areas during the dry seasons (January-May) from 2020 to 2024. We chose the B4, B8A, and B11 spectral bands of Sentinel-2 imagery to identify burned areas and reduce analysis errors. The SAVI, which is specifically designed to measure plant density in areas with sparse vegetation or very bright soil background, was also estimated based on the normalized difference vegetation index (NDVI)[22,23], originally developed by Huete (1988)[24], as shown in Equation (1).
The Land Development Department (LDD) of Thailand provided land use and land cover (LULC) data to support the classification of emission sources. The study focused on forested regions and agricultural lands, particularly rice, maize, and sugarcane plantations, which are major factors affecting regional air quality. Finally, due to the limited availability of local data, the EFs required to estimate PAH concentrations were derived from a comprehensive literature review.
The location of the study area
This study focuses on the upper northern part of Thailand, which includes nine provinces: Chiang Mai, Chiang Rai, Lamphun, Lampang, Nan, Phrae, Mae Hong Son, Phayao, and Uttaradit. One of the main contributing factors to air pollution in this region is open biomass burning, especially forest fires and crop residue burning, particularly from maize plantations, which is a key economic crop in the area. Maize plantations have rapidly expanded to meet the demand of the livestock feed industry in neighboring countries, resulting in forest encroachment for monoculture farming and the burning of post-harvest crop residues[25], which is a significant source of transboundary haze pollution. Additionally, the mountainous terrain in the region facilitates the occurrence of forest fires and exacerbates air pollution due to limited air circulation in valley areas [Figure 2].
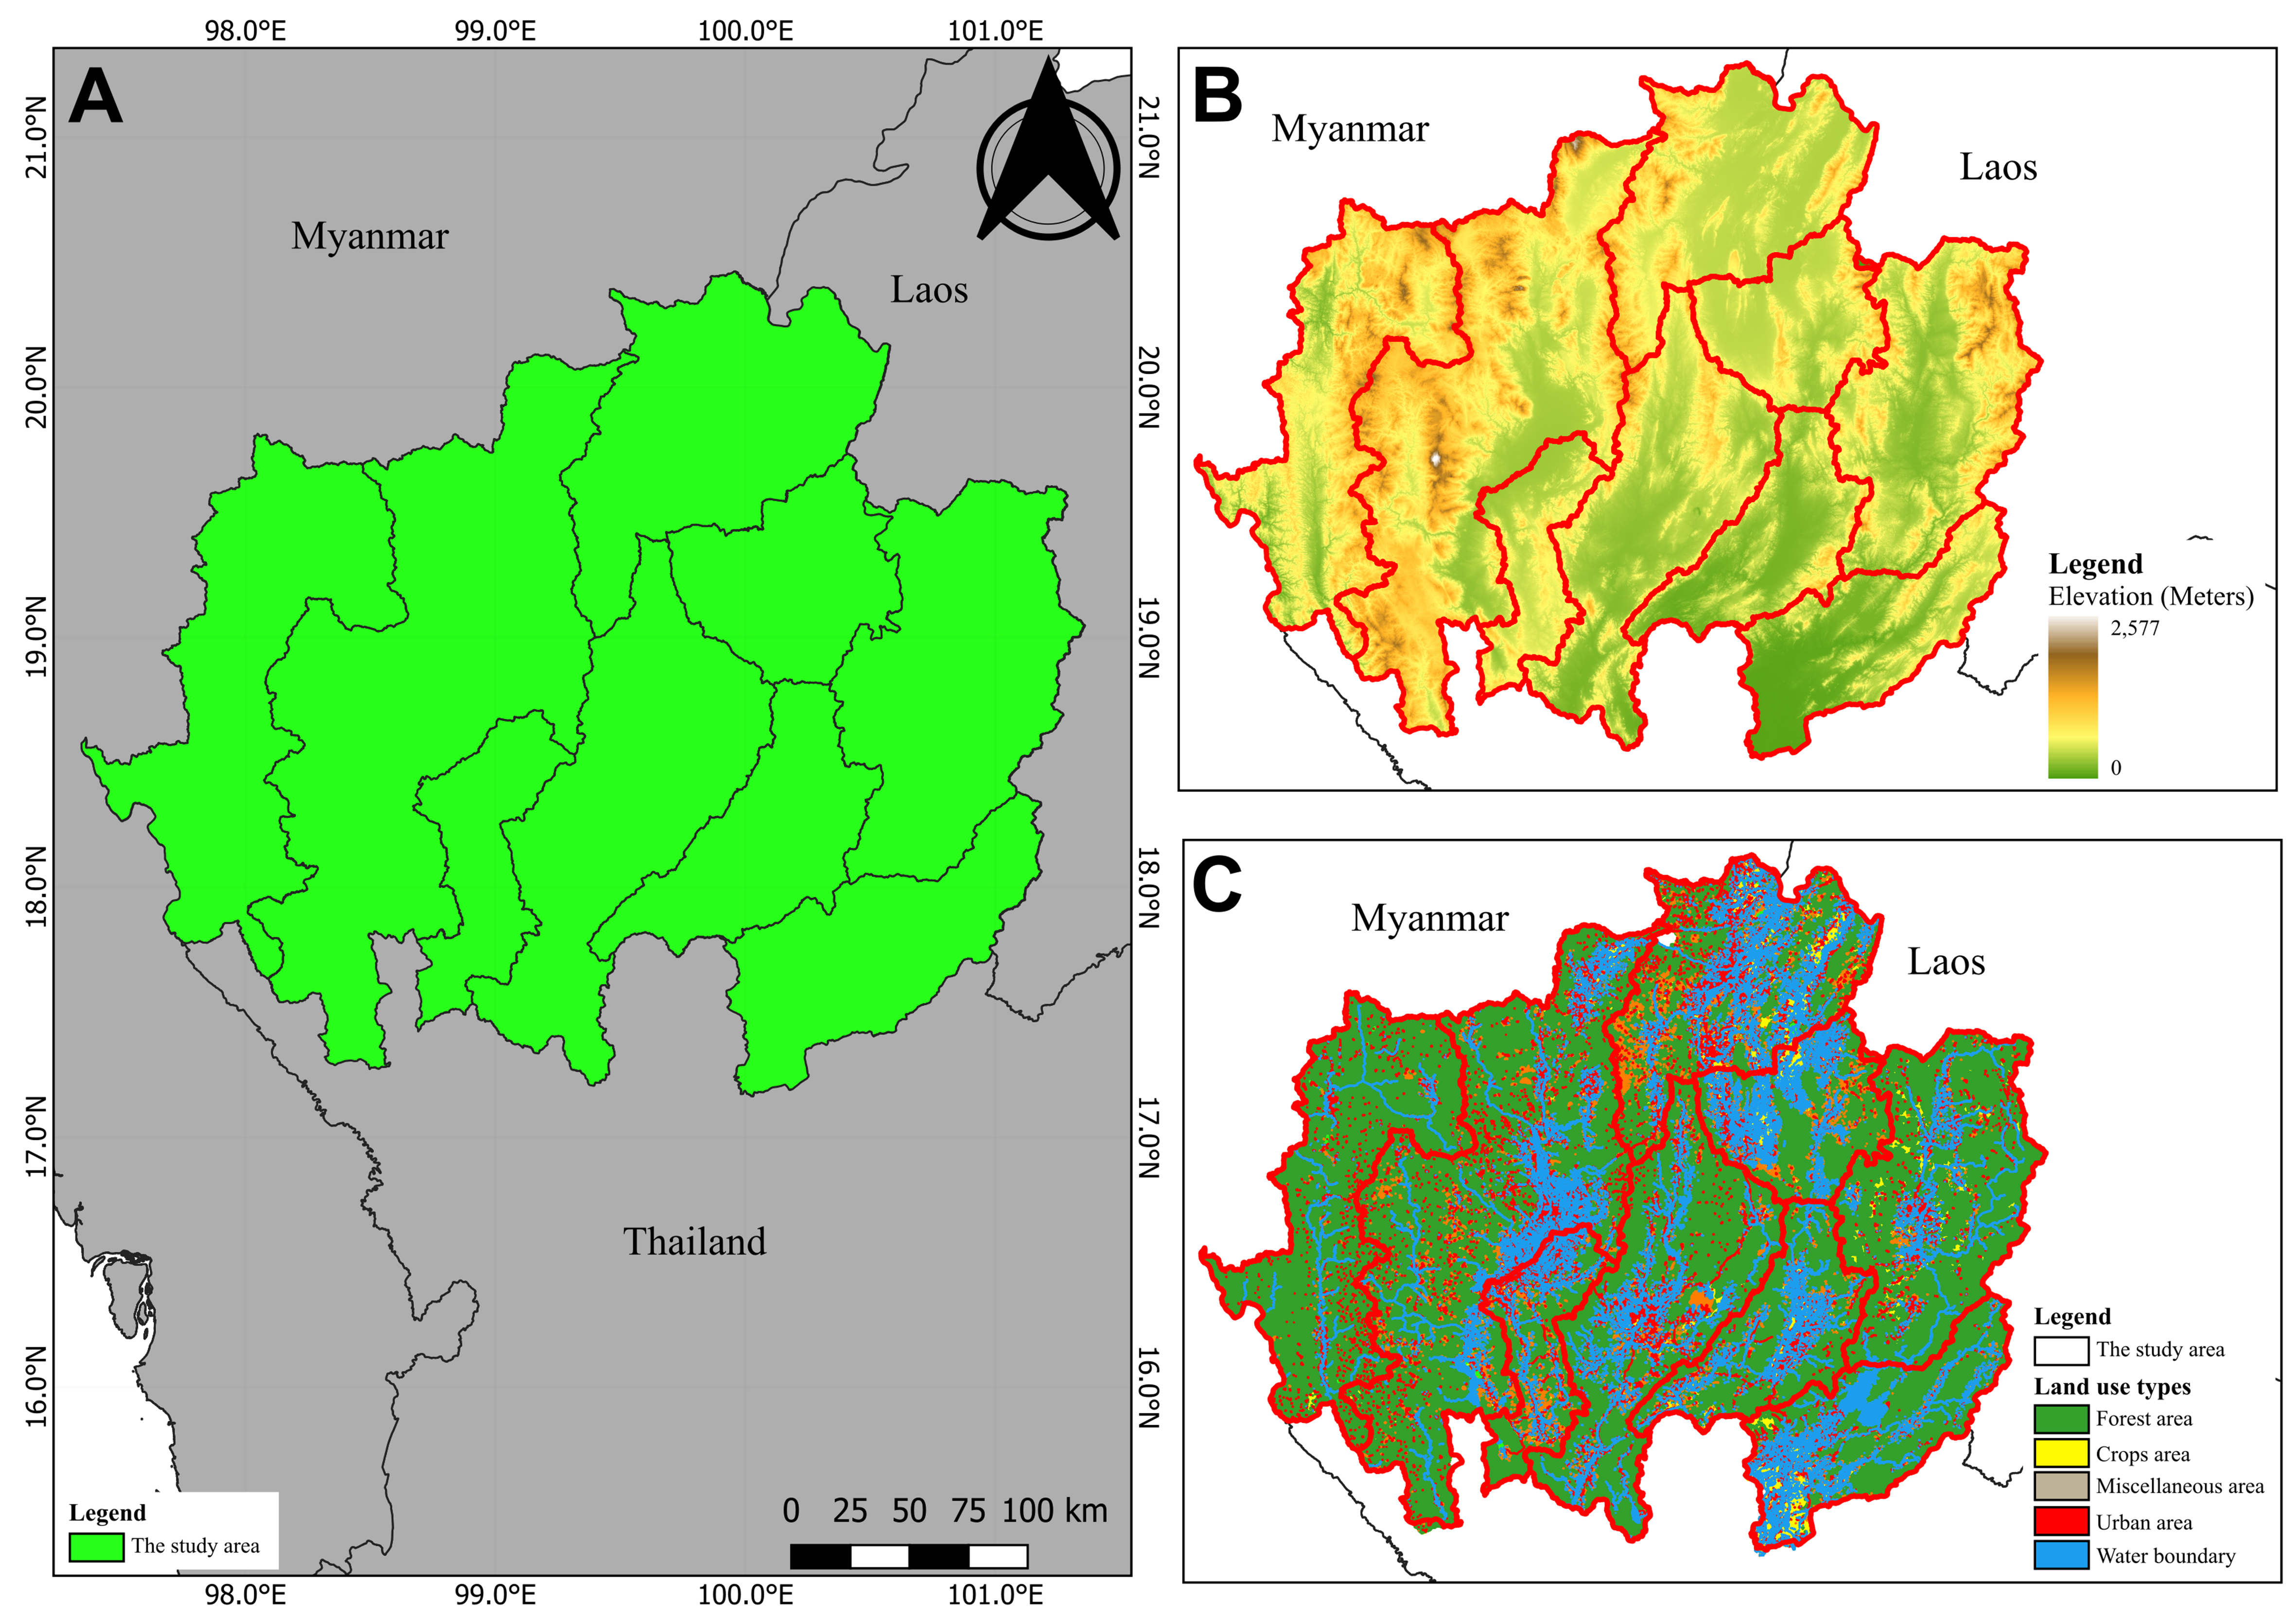
Figure 2. Study area characteristics: (A) Geographic location; (B) Topography; and (C) Land use and land cover.
Identification of burned areas
This study developed an integrated analytical workflow combining cloud-based computing, multispectral satellite imagery, and machine learning algorithms to classify burned areas across a large, diverse landscape[26]. Google Colab was employed as the primary computational environment for data preprocessing and model execution[27,28]. Its scalable cloud computing resources, such as graphics processing unit (GPU)/tensor processing unit (TPU) acceleration, support efficient data handling. Additionally, seamless integration with Google Drive allows the rapid implementation of analytical workflows, making it ideal for processing large remote sensing datasets[29].
Reference burned-area information from the Geo-Informatics and Space Technology Development Agency (GISTDA), derived from 60 m Landsat-8 imagery, was used to develop the training dataset. To manage computational complexity, the study area was divided into four sections. Using the GIS Point Sampling Tool, 16,000 training samples were generated, evenly split between burned and unburned classes. The RF algorithm was selected after a comparative performance analysis with other machine learning methods in a representative sub-area, showing superior performance in assessing burned scars. The model was configured with 1,000 trees using the smileRandomForest algorithm on the Google Earth Engine (GEE) platform. For model training and validation, the dataset was randomly split into 80% training and 20% testing sets to ensure high classification reliability. The spectral bands B4, B8A, and B11 were primarily used to generate color composites for visual validation against GISTDA reference data. Furthermore, SAVI and MNDWI were implemented in Google Colab as post-classification filters rather than input variables. SAVI was applied to distinguish burned areas from high-reflectance soil or sparse vegetation, while MNDWI was used to filter out wetlands and inundated agricultural areas, particularly rice paddies, to minimize evaluation errors. This approach improved classification performance and provided a strong foundation for further analyses, including emissions estimation and environmental impact assessment [Figure 3][30-32].
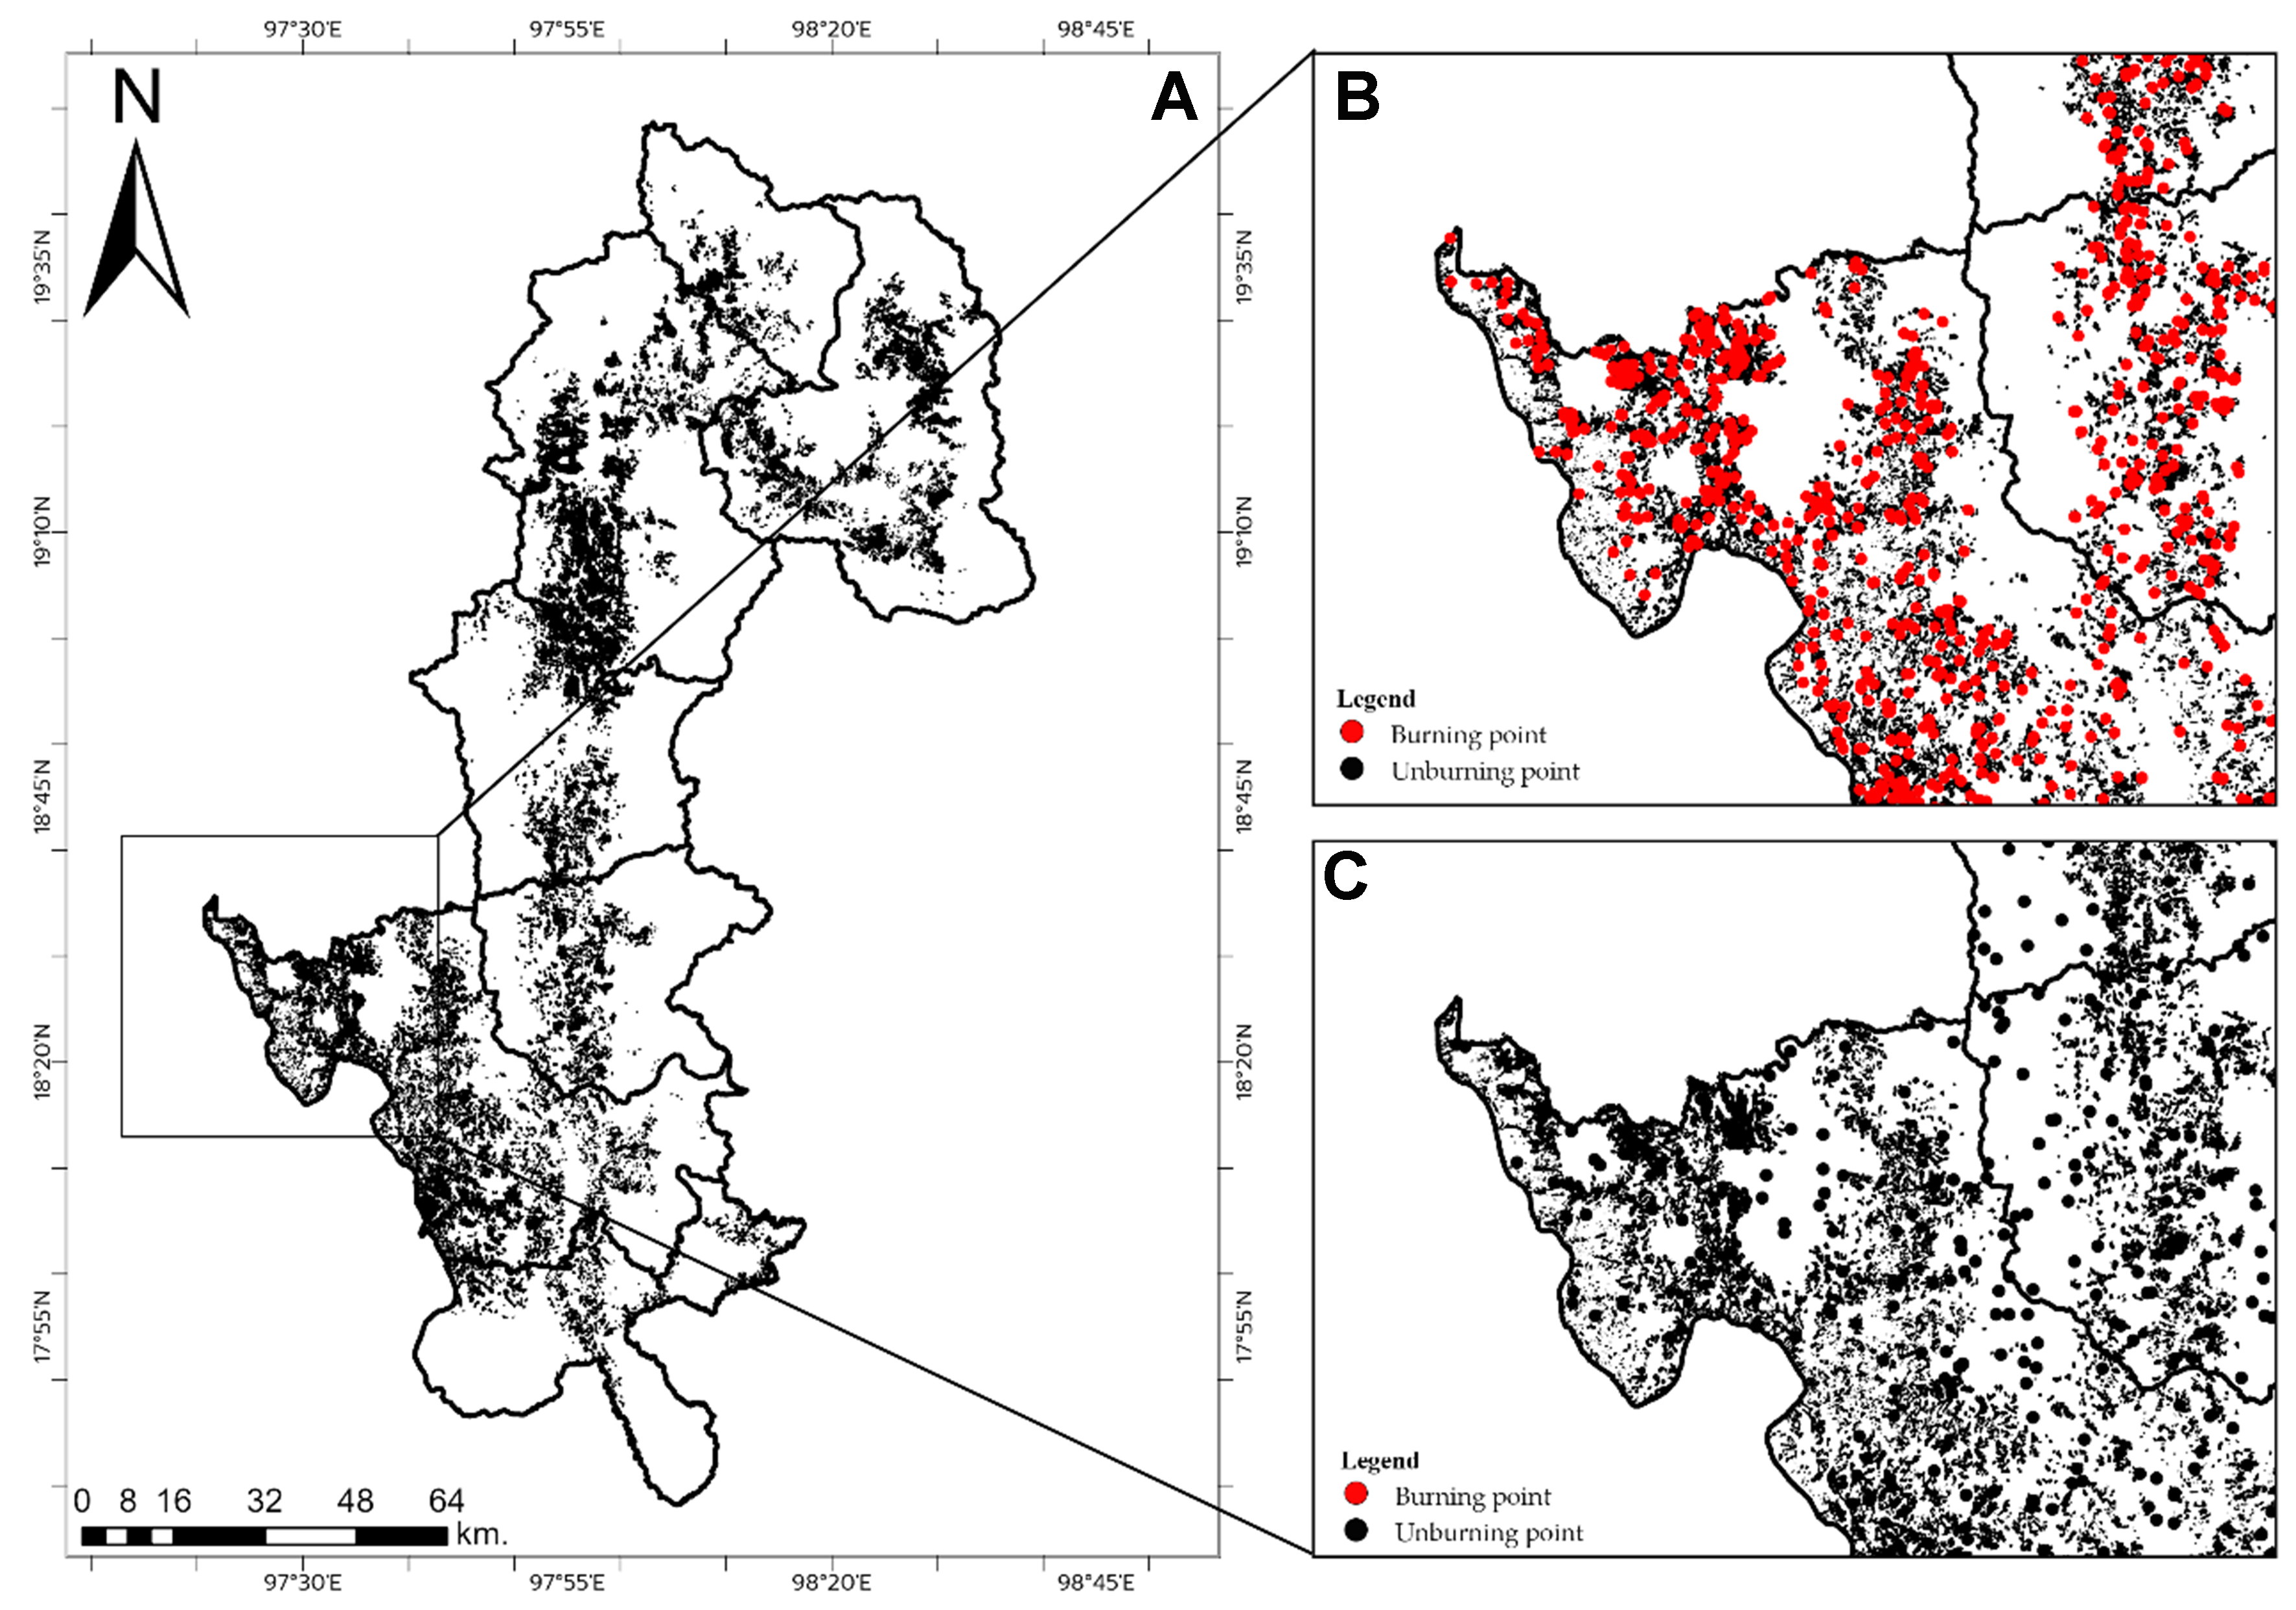
Figure 3. Training datasets and reference burned area polygons: (A) Spatial distribution; (B) Burning and unburning points; and (C) Reference burned area polygons.
Accuracy assessment
Cohen’s kappa coefficient was used to assess the accuracy of the burned area identified from the reference data. This coefficient is widely employed to evaluate the degree of agreement between two categorical datasets beyond that expected by chance[32]. A kappa value of 1.0 indicates perfect agreement, whereas a value of 0.0 signifies no agreement beyond chance. The detailed results are presented in Table 1.
Interpretation of Cohen’s kappa (
| Cohen’s kappa ( | Interpretation |
| 0 | No agreement |
| 0.11-0.20 | Slight agreement |
| 0.21-0.40 | Fair agreement |
| 0.41-0.60 | Moderate agreement |
| 0.61-0.80 | Substantial agreement |
| 0.81-0.99 | Near-perfect agreement |
| 1 | Perfect agreement |
Assessment of the air emission inventory
Air emissions from biomass burning, specifically forest fires and crop residues, were calculated using the equation derived from Giglio et al. (2006)[33], as shown in Equation (2). Both categories were quantified using this Equation.
where EMi,j (ton) is the emission of pollutant (i) from area (j) and Mj (kg) is the amount of burned biomass in area (j). EFi,j is the emission factor for pollutant (i) from area (j) (g/kg of dry matter), taken from the report by Samae et al. (2020)[34]. Mj (kg) for forest fires and crop residues was calculated using the Equations (3) and (4).
where Mj (kg) is the amount of burned biomass in forest areas, A is the burned area (km2), B is the biomass density (kgdry mass/km2), and C is the burning efficiency. The values of biomass density and burning efficiency for forest fires are shown in Table 2.
Summary of parameters used for estimating the emission inventory
where Mj (kg) is the amount of burned biomass from crop residues, A is the burned area in crop areas (km2), and B is the biomass density in crop areas (kgdry mass/km2). Distinct parameters were applied for forest and agricultural areas, as detailed in Table 2. E is the burning efficiency, and the corresponding values for crop residues are also provided in Table 2.
The carcinogenicity of PAHs
PAHs are a class of organic compounds composed of multiple fused benzene rings, primarily generated during the incomplete combustion of organic materials such as biomass, coal, petroleum products, and organic waste[40,41]. Many PAHs have been classified as carcinogenic by the International Agency for Research on Cancer (IARC)[42,43], as shown in Table 3. Benzo[a]pyrene (BaP) has been designated as a Group 1 carcinogen (carcinogenic to humans), whereas dibenzo[a,h]anthracene (DBahA) has been classified as Group 2A (probably carcinogenic). Compounds including benzo[a]anthracene (BaA), benzo[b]fluoranthene (BbF), benzo[k]fluoranthene (BkF), and chrysene (Chr) are categorized as Group 2B (possibly carcinogenic)[44]. According to the World Health Organization (WHO) Air Quality Guidelines, the annual average concentration of BaP in ambient air is set at 1 ng/m3, above which an increased lifetime cancer risk has been reported[45,46]. To quantitatively assess human exposure in this study, the toxicity equivalent concentration (TEQ) was evaluated, which estimates the carcinogenic potential of the measured PAH mixture relative to BaP. During the smoke haze season, local BaP-equivalent levels (TEQ) exceeded the WHO guideline, ranging from 0.46 to 2.06 ng/m3 in rural areas, and from 0.38 to 1.33 ng/m3 in urban areas[47]. These results demonstrate that during intensive burning episodes, carcinogenic PAH concentrations can exceed the WHO safety limit by up to 2-fold in rural environments and 1.3-fold in urban environments, confirming a high respiratory health risk for local populations[47]. In this study, although direct ambient concentrations were not measured, the estimated emissions, particularly from forest fires, suggest that local BaP levels during burning episodes could exceed this guideline.
Classification of selected PAHs according to IARC
| Types of PAHs | IARC classification | Status |
| BaP | Group 1 | Carcinogenic to humans |
| DBahA | Group 2A | Probably carcinogenic to humans |
| BaA | Group 2B | Possibly carcinogenic to humans |
| BbF | Group 2B | Possibly carcinogenic to humans |
| BkF | Group 2B | Possibly carcinogenic to humans |
| Chr | Group 2B | Possibly carcinogenic to humans |
BaP has been classified as a Group 1 carcinogen by the IARC[42,43], with strong evidence supporting its carcinogenicity in humans[48-50]. It is primarily produced during the incomplete combustion of organic materials, such as cigarette smoke, vehicle exhaust, and open biomass burning. Smaller PM was found to carry higher levels of carcinogens than larger particles. The highest PAH emissions were recorded in 2023. It was found that BaP was present at 2.08 g in PM1.0-2.5, followed by 1.21 g in PM0.1-1.0. The lowest concentration (0.11 g) was detected in PM smaller than 0.1 µm. However, studies suggest that BaP can significantly increase the risk of lung and other cancers, even at low concentrations[49], particularly when accumulated in PM2.5, where it can induce oxidative stress and DNA damage, factors associated with cardiovascular, respiratory, and other diseases[50].
RESULTS AND DISCUSSION
To provide a comprehensive understanding of the impacts of burning, this study presents analyses of the temporal and spatial dynamics of burned areas, evaluates data reliability, and assesses pollutant emissions and their associated health risks, as discussed below.
Time-series changes in burned areas during the dry seasons and identification of burned areas
The integration of the GSR procedure with SAVI and MNDWI proved essential for accurate detection. In terms of spectral response, SAVI digital numbers exceed 3,000 in characterized forest areas, while values between 0 and 2,000 indicate rice plantations during the pre-cultivation phase. Applying these thresholds yielded MNDWI values surpassing 10,000, enabling effective identification of burned areas [Figure 4]. These results align with reference datasets, confirming the accuracy of the classification method.
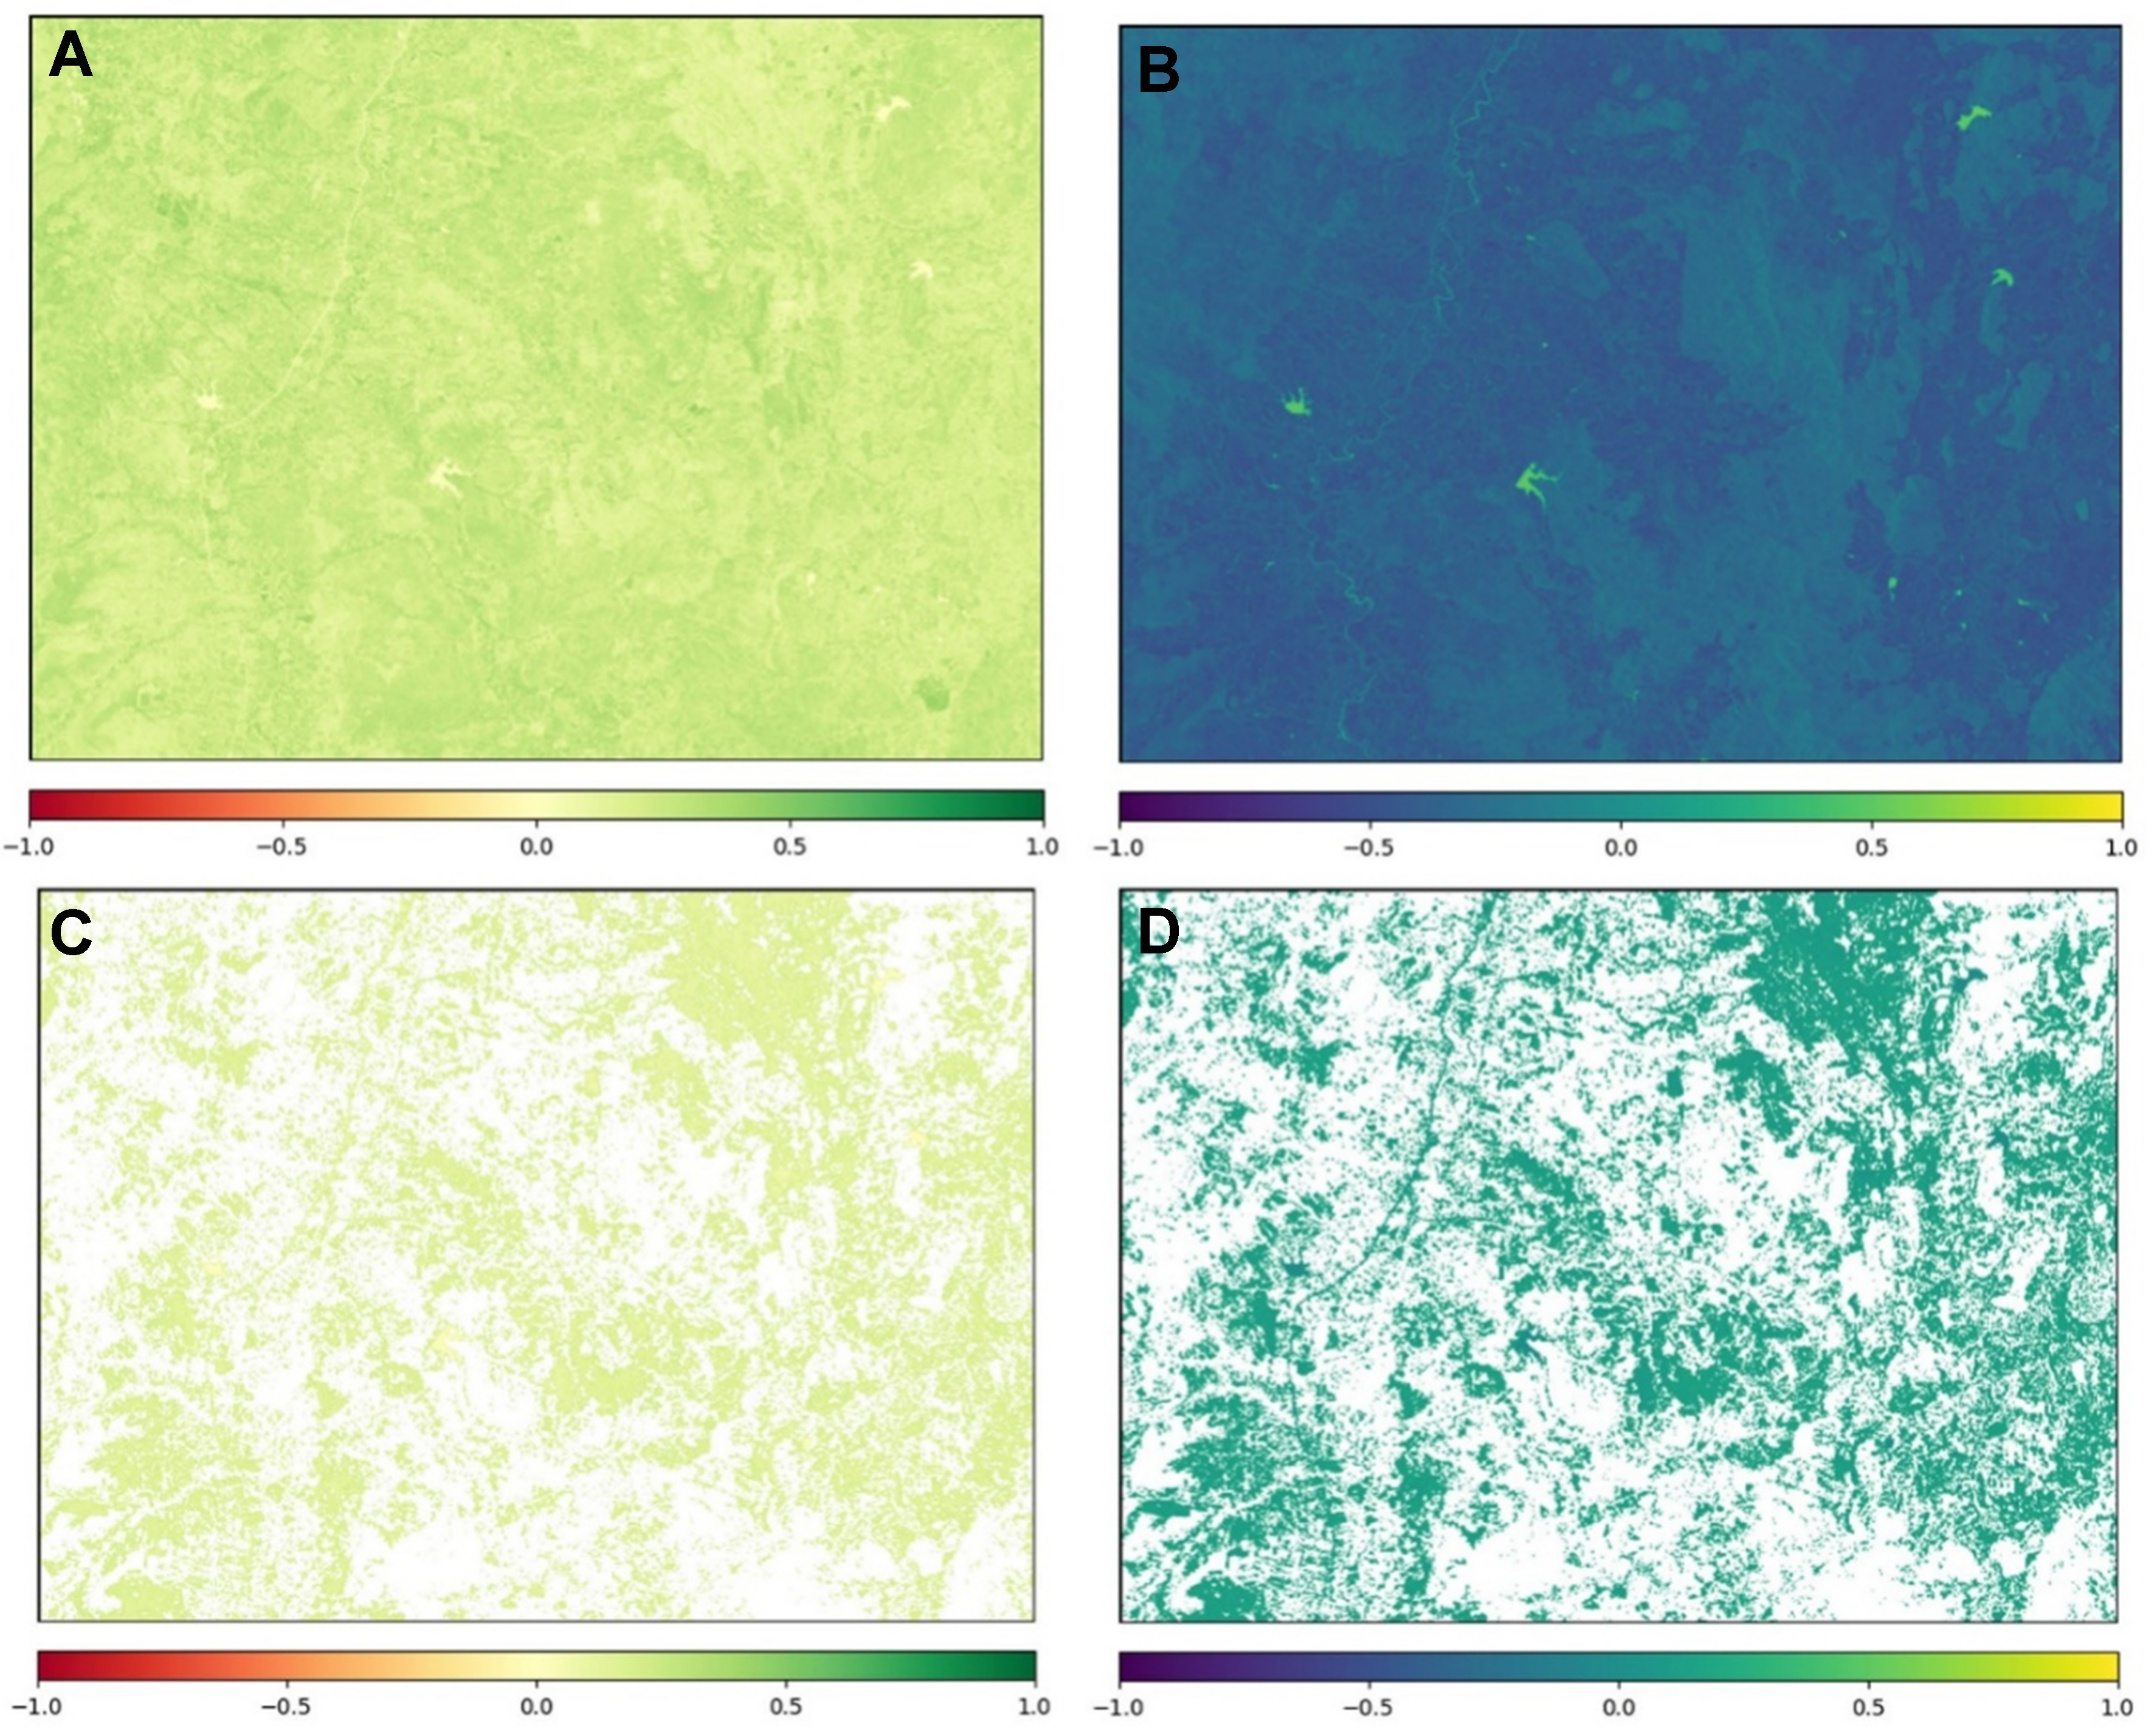
Figure 4. DN values of SAVI and MNDWI: (A) SAVI values greater than 3,000; (B) SAVI values between 0 and 2,000; (C) MNDWI values greater than 1,000; (D) MNDWI values exceeding 1,000, differentiated by color-coded thematic classes. SAVI: Soil-adjusted vegetation index; MNDWI: modified normalized difference water index.
Analysis of the spatiotemporal dynamics reveals that the extent of burned areas peaked in 2023
Burned areas during the dry seasons from 2020 to 2024
| Year | Land use types | Month | ||||
| January | February | March | April | All | ||
| 2020 | Maize | 1,862.62 | 1,289.43 | 933.97 | 2,265.58 | 6,351.60 |
| Sugarcane | 150.90 | 89.03 | 35.47 | 0.00 | 275.40 | |
| Rice | 3,823.49 | 1,180.15 | 590.40 | 2,872.79 | 8,466.82 | |
| Forest | 9,769.80 | 17,570.49 | 19,786.99 | 10,126.23 | 57,253.50 | |
| All | 15,606.80 | 20,129.09 | 21,346.83 | 15,264.60 | 72,347.33 | |
| 2021 | Maize | 1,288.29 | 1,459.25 | 549.51 | 1,982.52 | 5,279.57 |
| Sugarcane | 0.39 | 101.73 | 25.58 | 137.00 | 264.70 | |
| Rice | 2,973.42 | 1,474.98 | 251.15 | 1,943.20 | 6,642.74 | |
| Forest | 6,358.47 | 13,966.73 | 14,221.68 | 9,332.46 | 43,879.35 | |
| All | 10,620.56 | 17,002.69 | 15,047.93 | 13,395.18 | 56,066.36 | |
| 2022 | Maize | 2,059.36 | 1,688.65 | 1,207.58 | 1,780.33 | 6,735.92 |
| Sugarcane | 184.48 | 115.68 | 52.55 | 167.25 | 519.95 | |
| Rice | 4,011.57 | 1,435.97 | 898.72 | 2,152.70 | 8,498.96 | |
| Forest | 9,893.93 | 17,108.20 | 21,048.74 | 8,386.67 | 56,437.53 | |
| All | 16,149.34 | 20,348.49 | 23,207.59 | 12,486.95 | 72,192.36 | |
| 2023 | Maize | 2,192.43 | 1,706.90 | 1,129.61 | 2,105.63 | 7,134.57 |
| Sugarcane | 219.33 | 114.36 | 48.82 | 188.19 | 570.70 | |
| Rice | 4,614.72 | 1,460.03 | 732.89 | 2,154.05 | 8,961.68 | |
| Forest | 10,202.39 | 18,325.05 | 21,318.15 | 8,395.97 | 58,241.55 | |
| All | 17,228.87 | 21,606.33 | 23,229.46 | 12,843.84 | 74,908.50 | |
| 2024 | Maize | 2,068.03 | 1,792.56 | 1,092.37 | 2,147.01 | 7,099.97 |
| Sugarcane | 194.35 | 114.81 | 38.11 | 250.00 | 597.27 | |
| Rice | 4,352.25 | 1,416.58 | 777.84 | 2,510.92 | 9,057.60 | |
| Forest | 10,004.26 | 18,355.31 | 21,239.70 | 8,252.31 | 57,851.59 | |
| All | 16,618.90 | 21,679.27 | 23,148.02 | 13,160.24 | 74,606.43 | |
Moreover, the time series of burned area, as illustrated in Figure 5, indicates that February and March experienced the largest burned areas, influenced by meteorological conditions, particularly high temperatures and low relative humidity. In addition, terrain characteristics, such as surrounding mountains, were found to increase burning activity[51]. These factors also hinder fire suppression efforts, allowing fires to spread rapidly. The combination of steep terrain and unfavorable meteorological conditions was found to increase combustion efficiency, leading to the release of large amounts of pollutants.
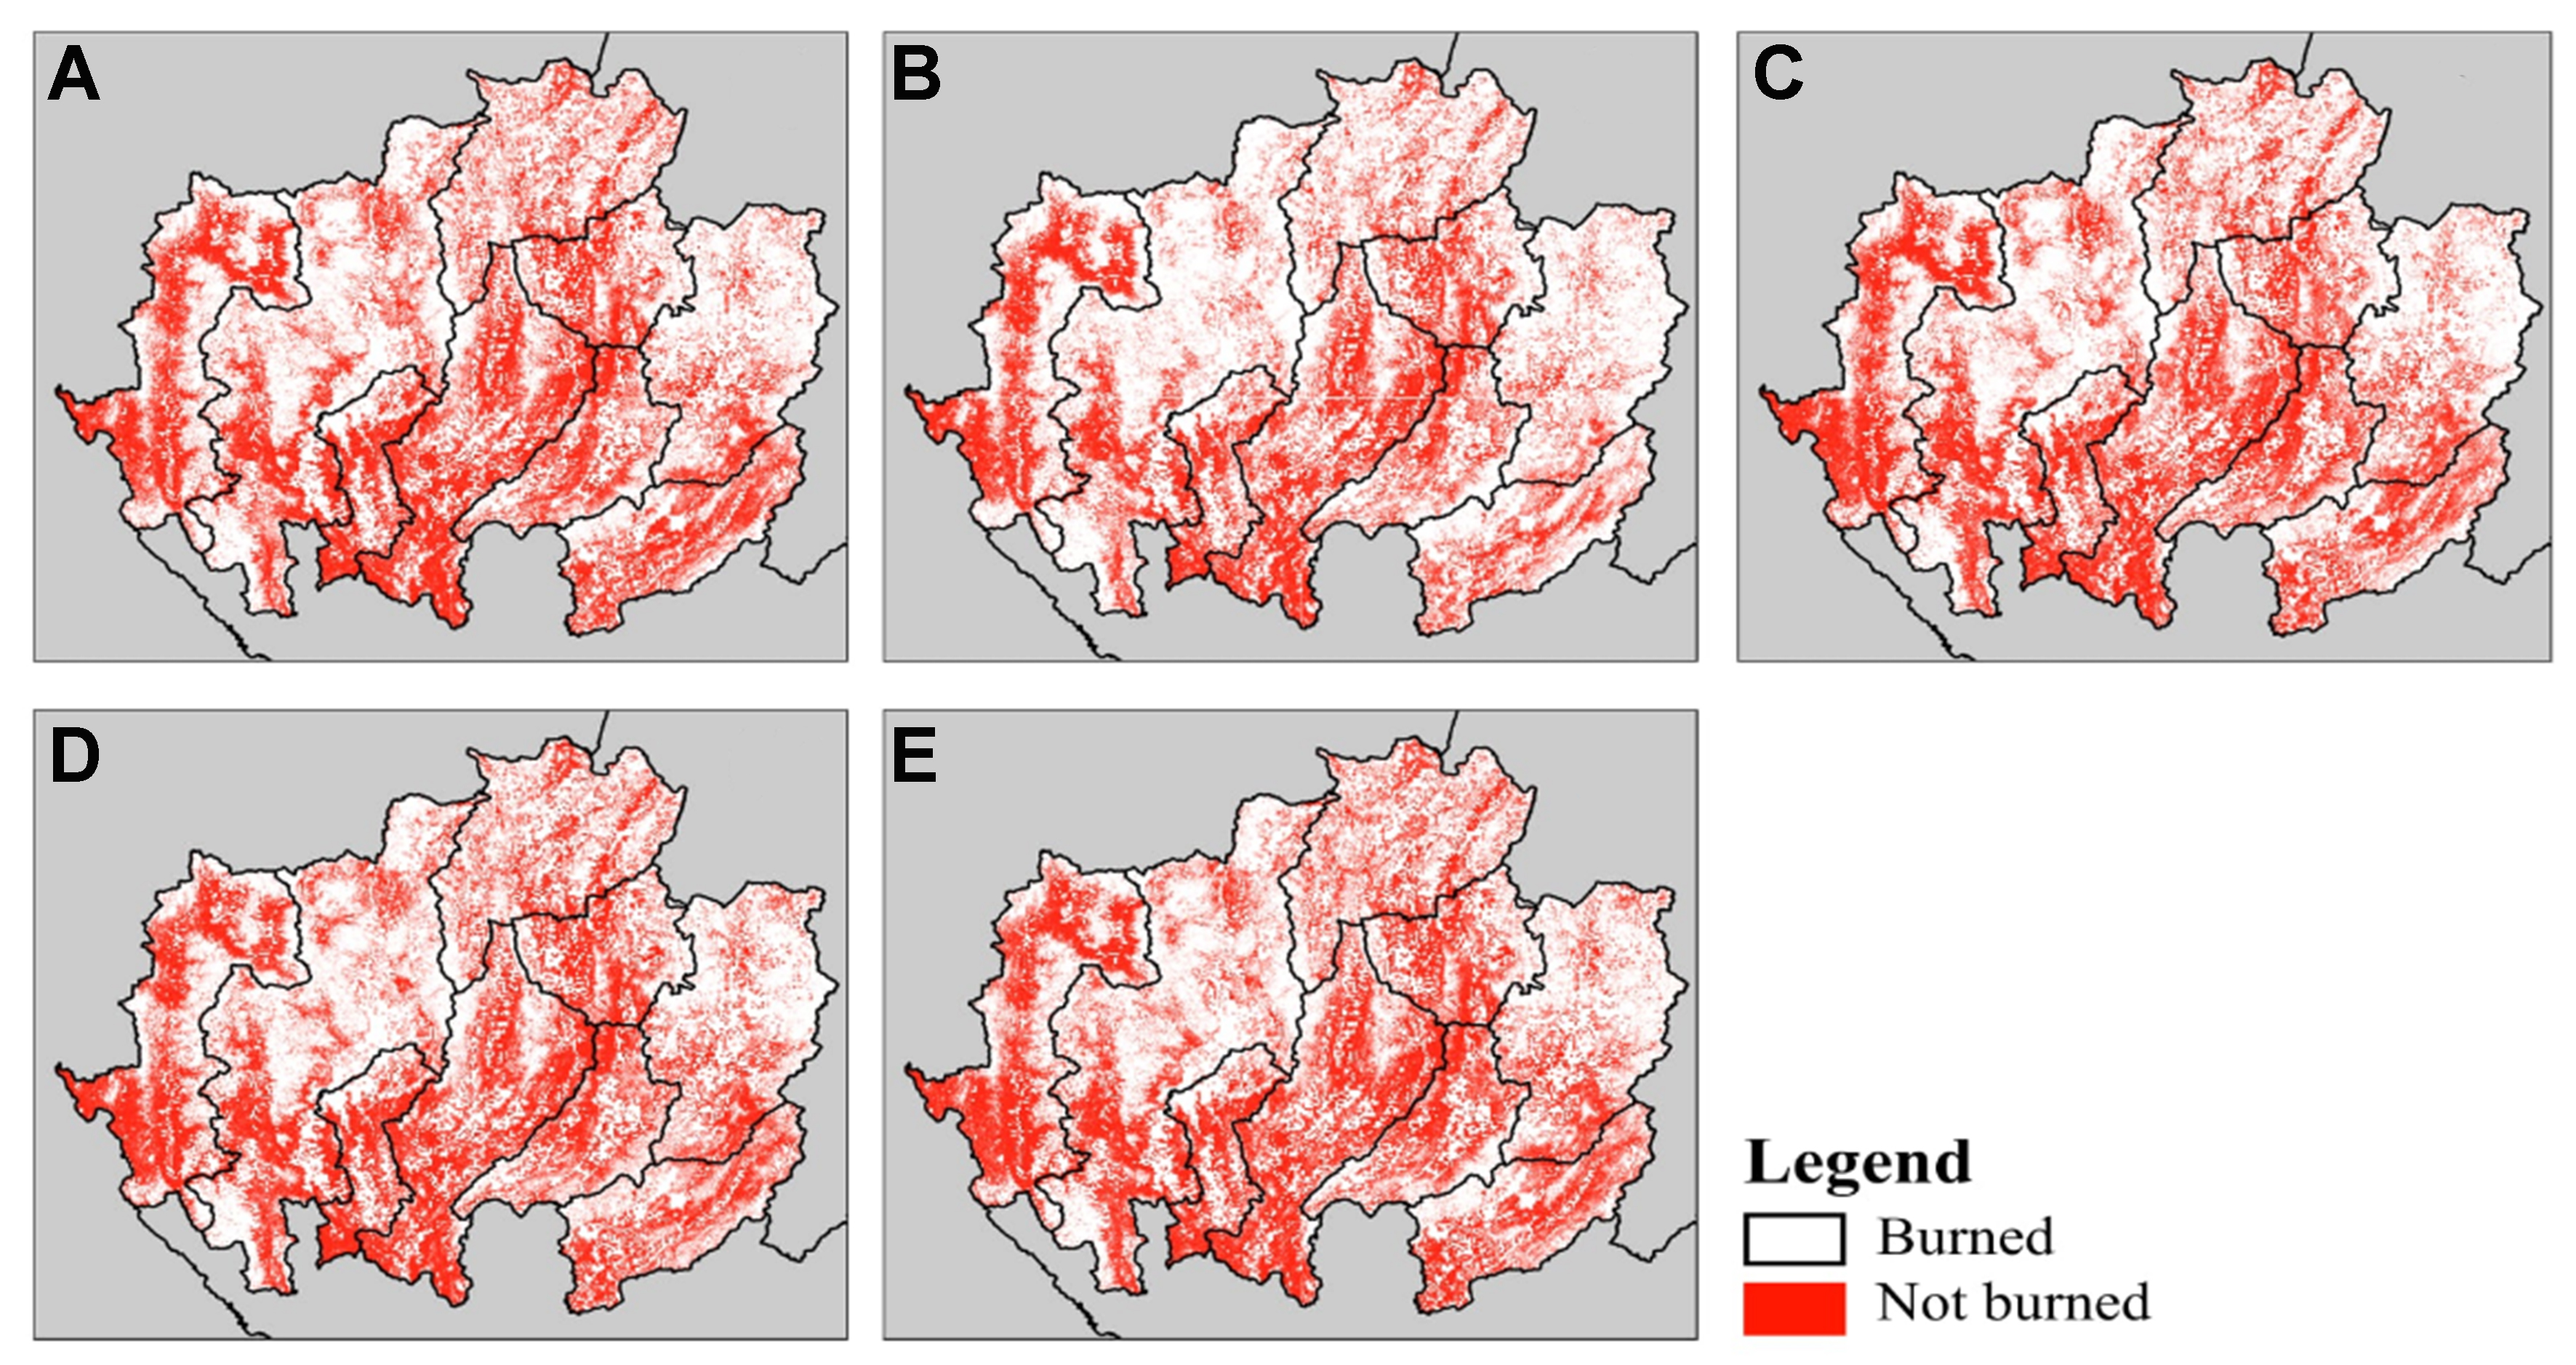
Figure 5. Monthly changes in burned area: (A) 2020; (B) 2021; (C) 2022; (D) 2023; and (E) 2024.
The spatial distribution of burned area
Figures 5-7 display the spatial distribution of burned areas in forests, as well as rice, maize, and sugarcane plantations. From these figures, the characteristics and distribution patterns of burned areas were identified. Throughout the study period, a consistent temporal variation in burned area distribution was observed. To effectively highlight this spatial pattern, data from 2023, when the highest total burned area was recorded, were selected. The resulting map indicates that geographical characteristics strongly influence the distribution of burned areas. As shown in Figure 5, forest areas exhibit recurring concentrations of burned zones across all provinces. This trend is likely related to the large proportion of forest area in northern Thailand, which accounts for approximately 63.66% of the total land area[51].
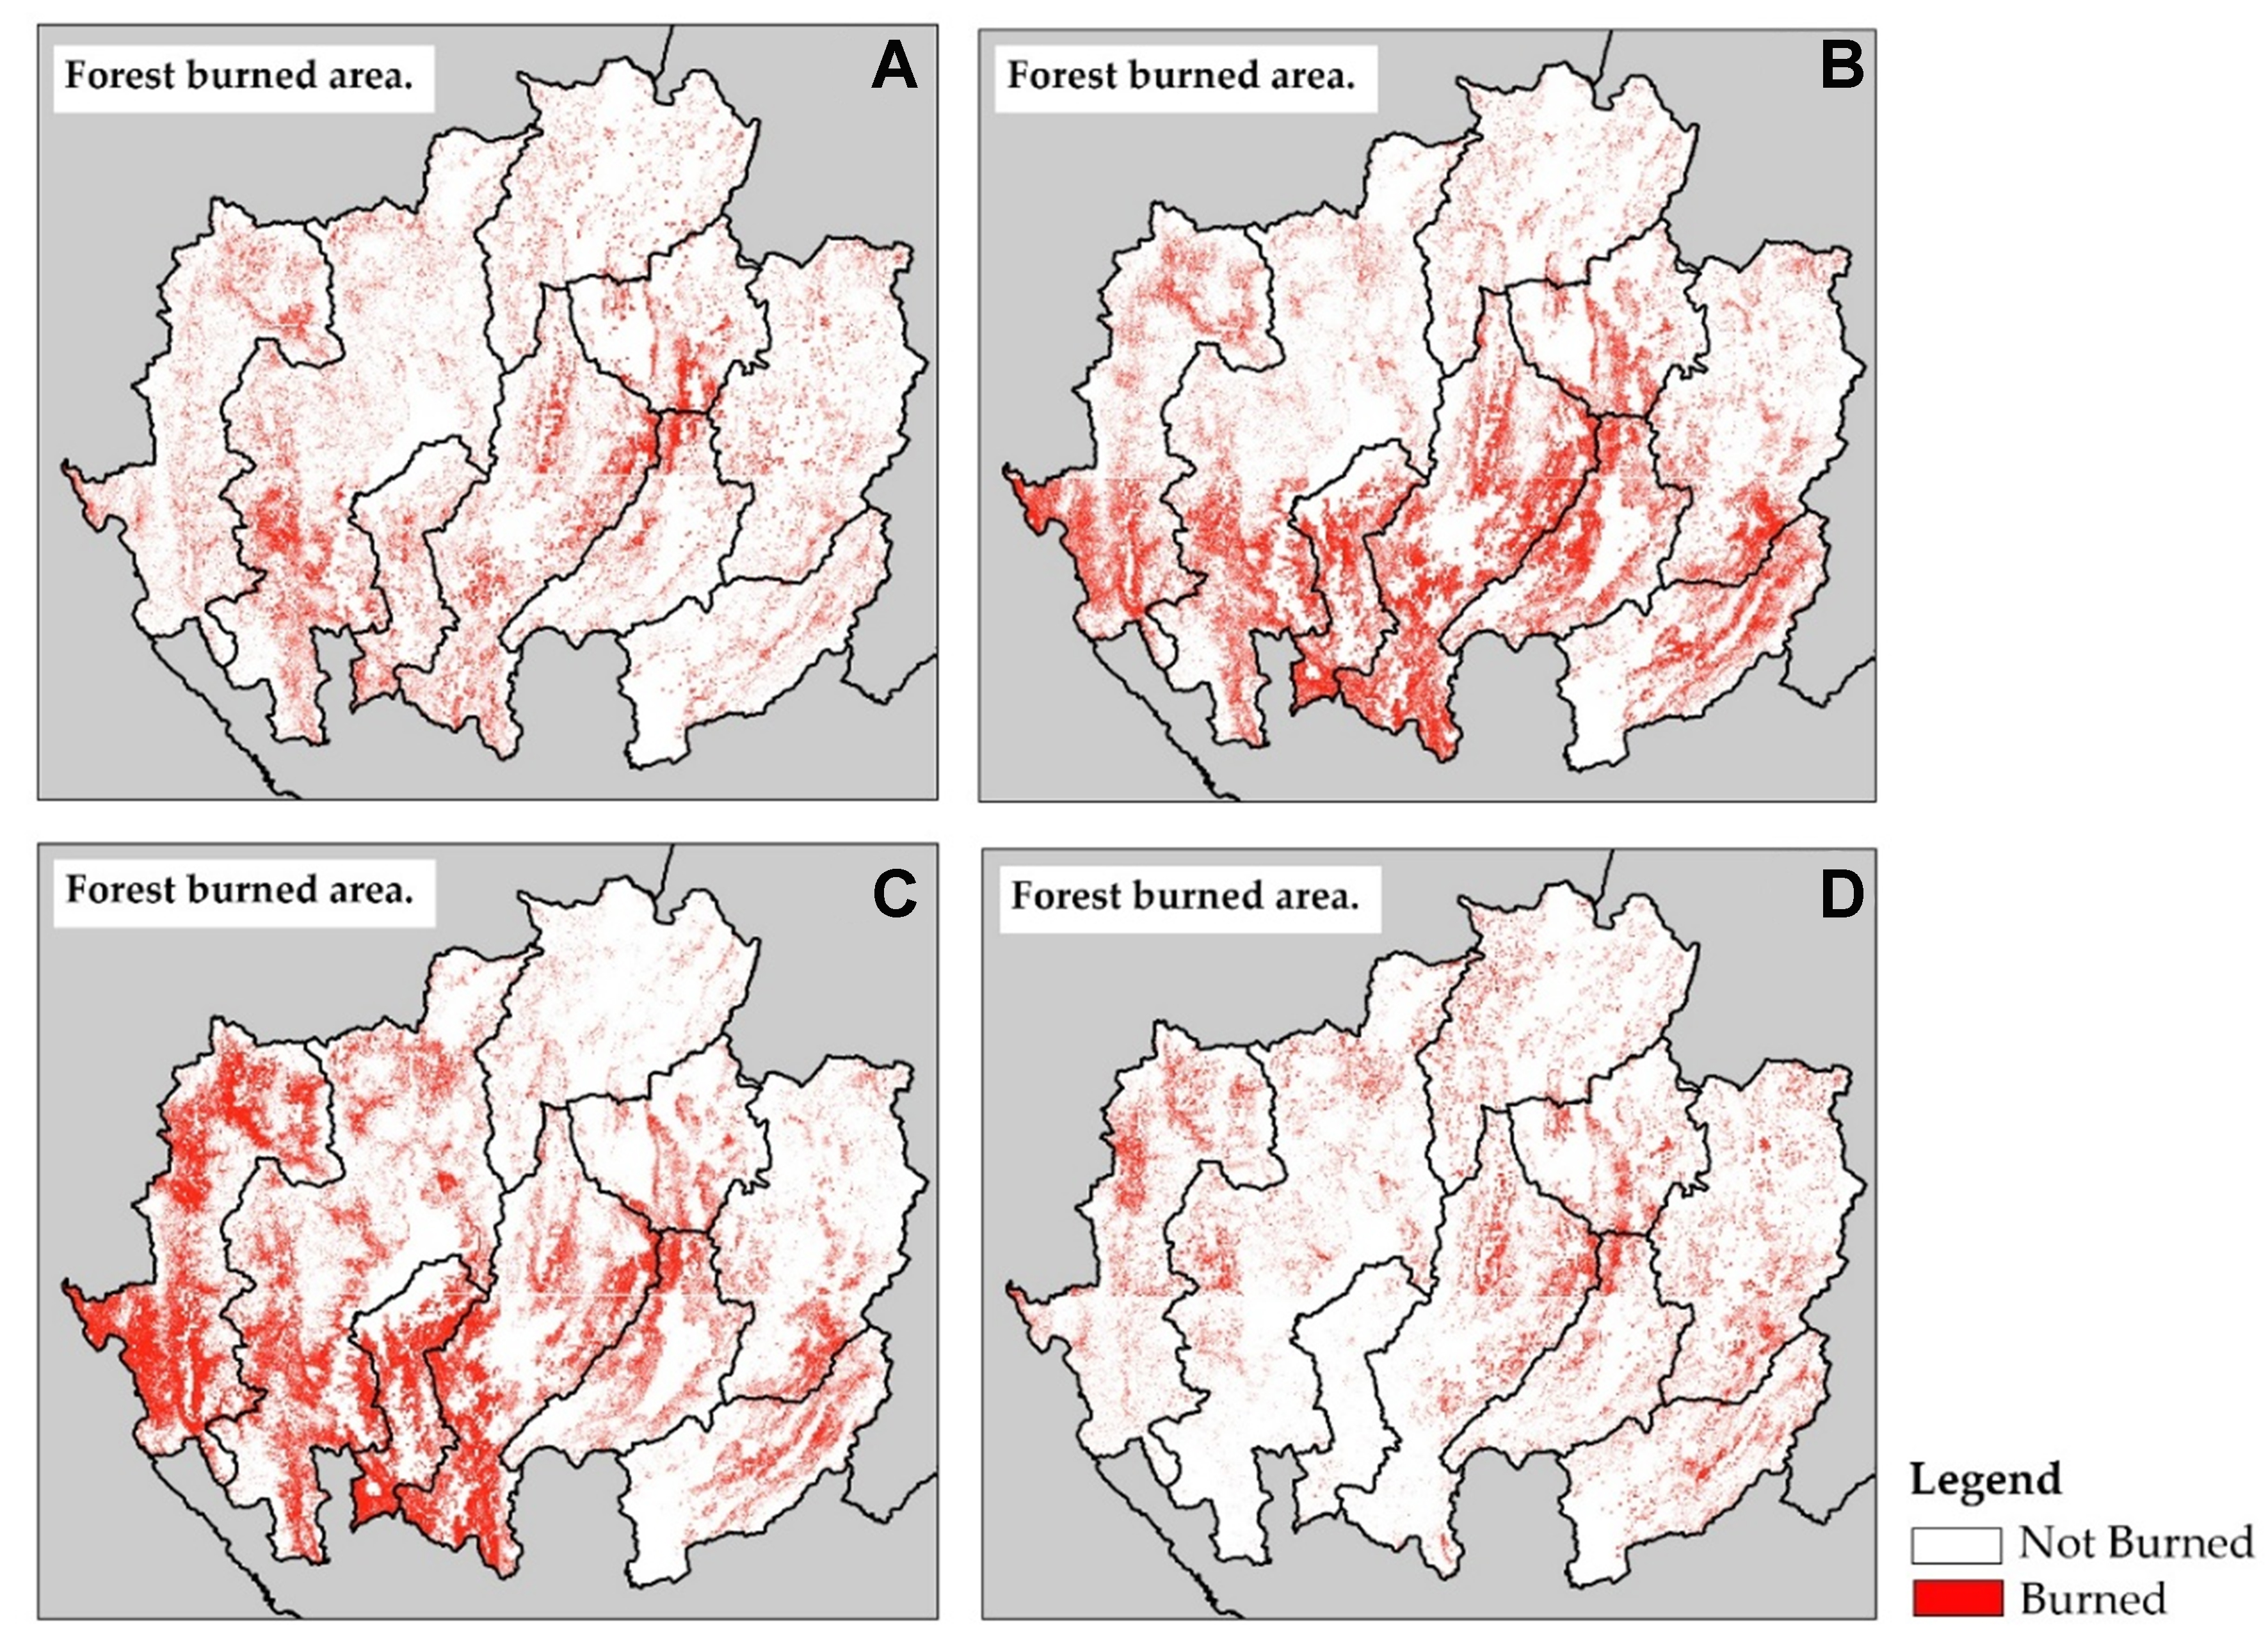
Figure 6. Burned areas in forest regions in 2023: (A) January, (B) February, (C) March, and (D) April.
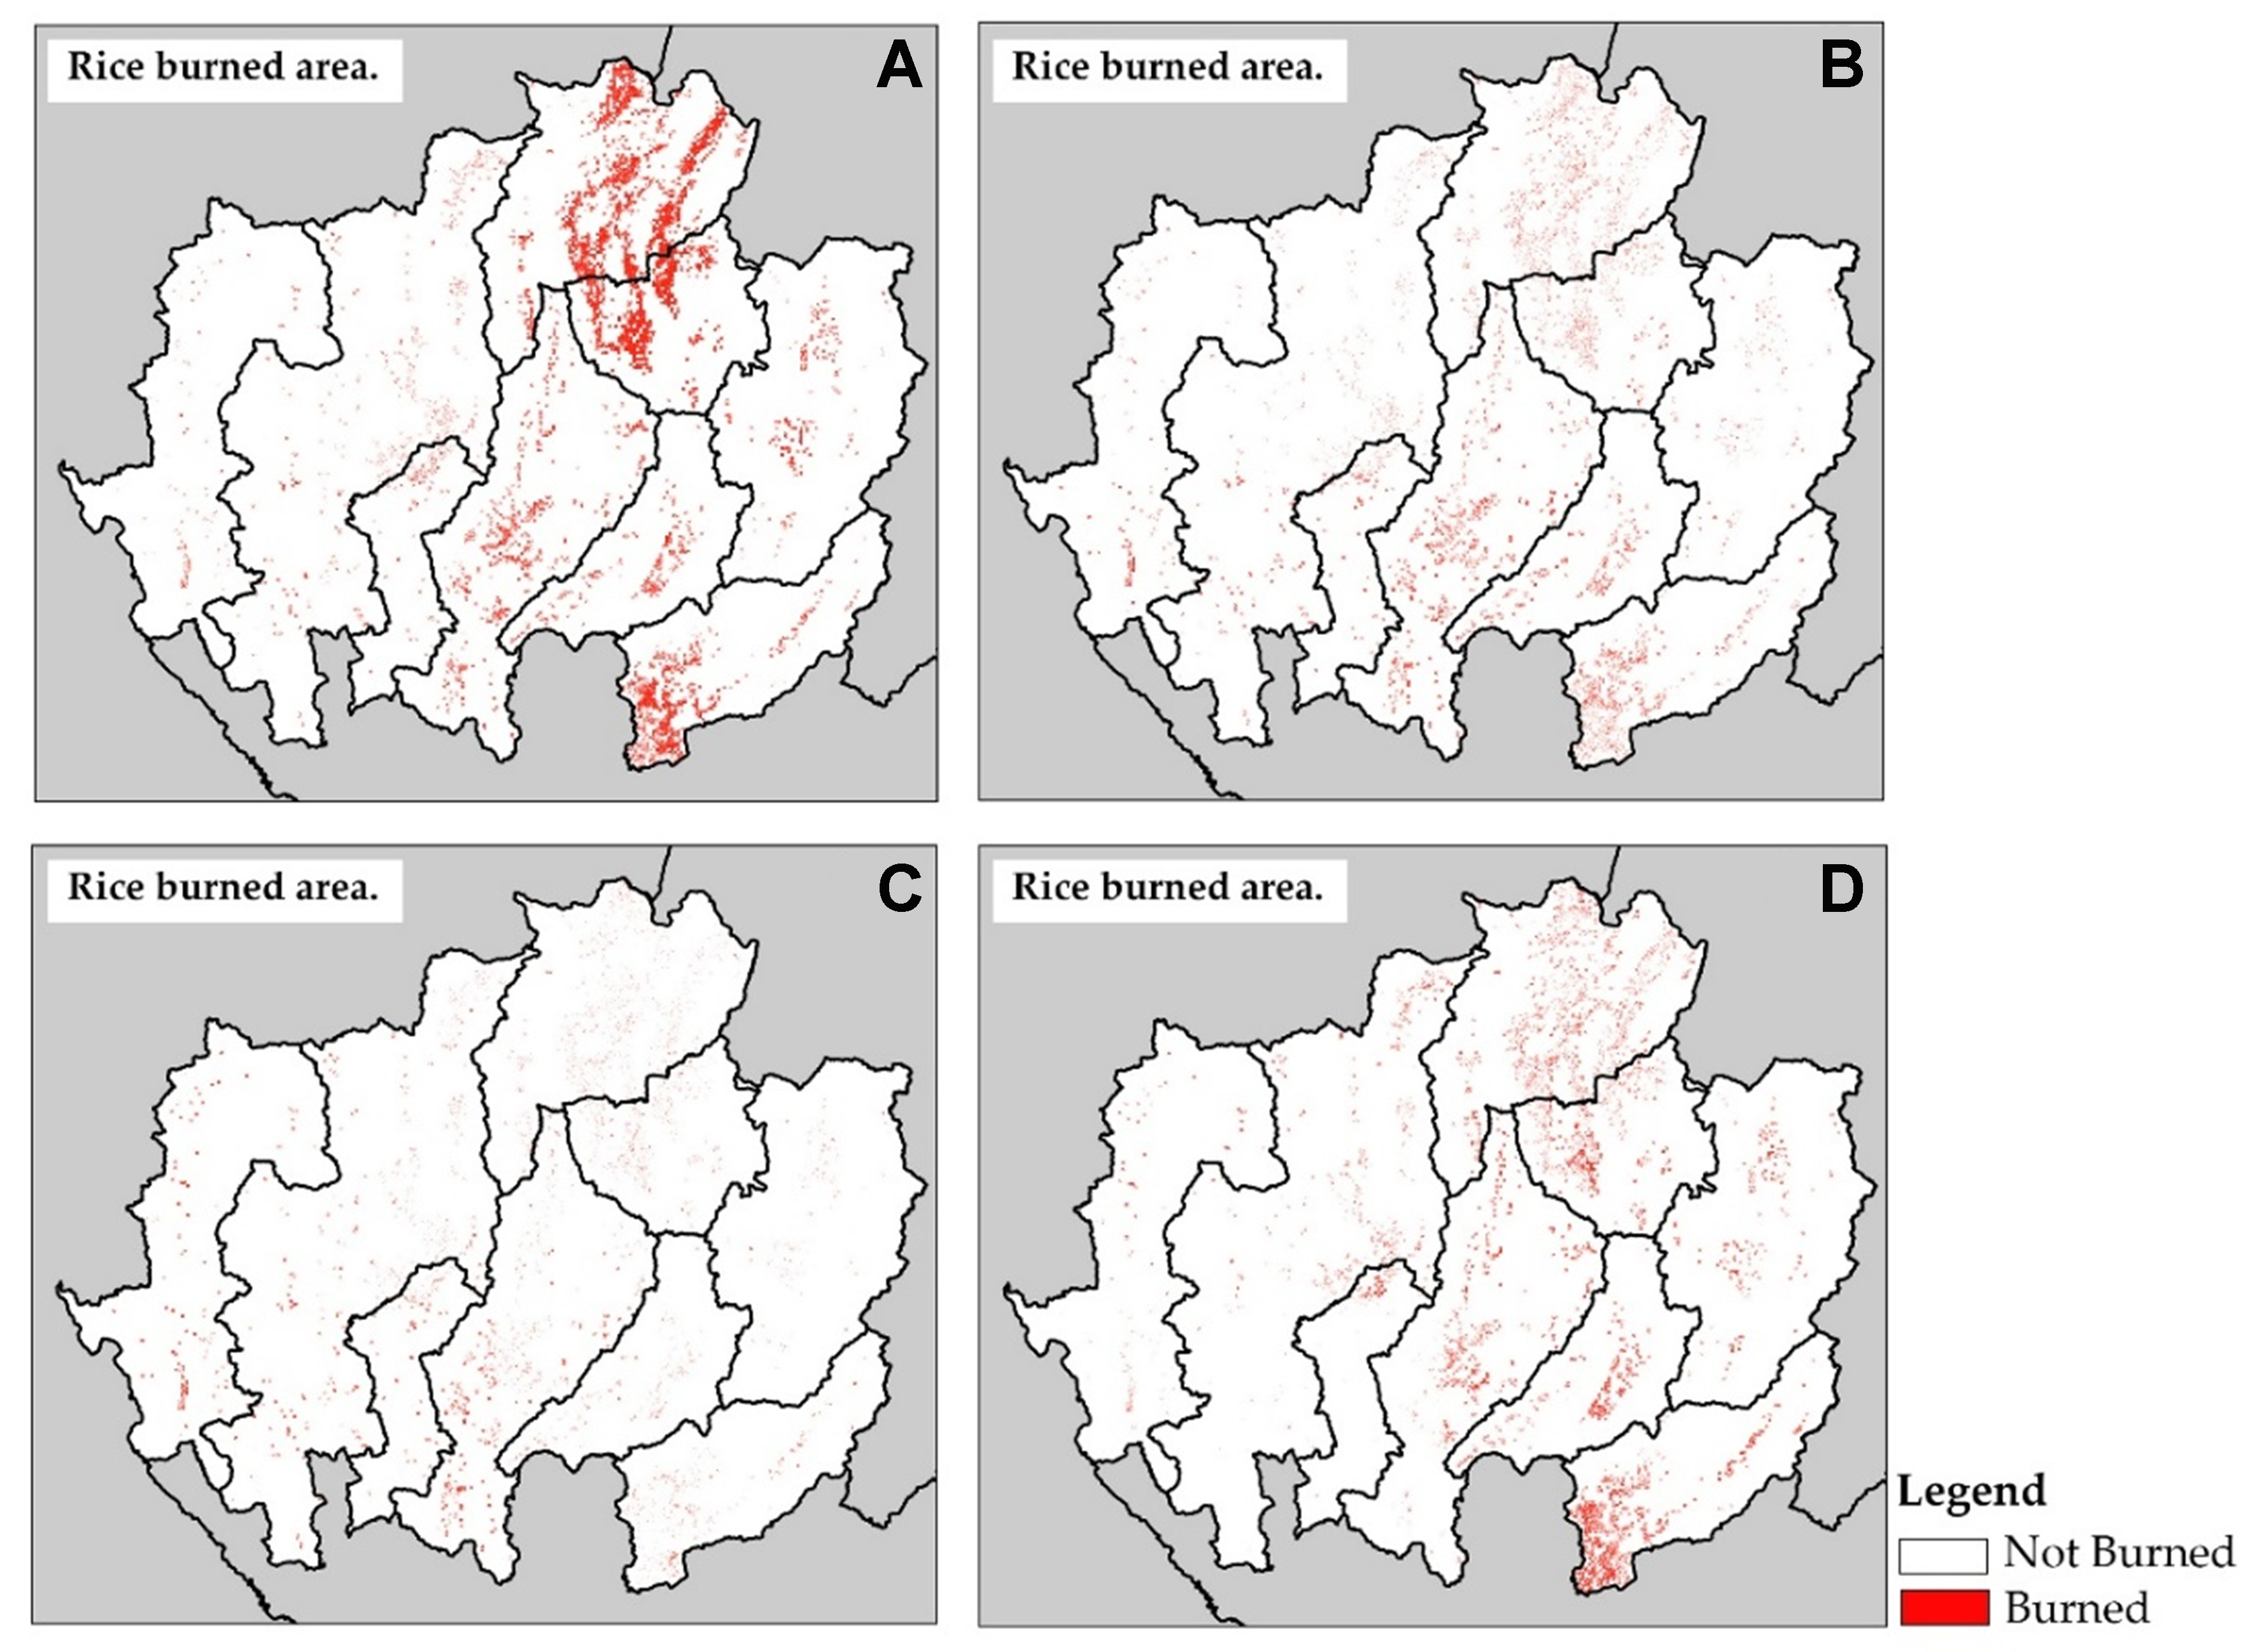
Figure 7. Burned areas in rice plantations in 2023: (A) January, (B) February, (C) March, and (D) April.
In contrast, the extent of burned areas associated with crop residues is lower than that observed in forests, particularly in rice plantations, as illustrated in Figure 6. This discrepancy is mainly due to differences in planting and harvesting schedules among agricultural systems. The dry season generally does not coincide with the rice harvesting period[52-54], as most farmers in northern Thailand plant rice during the rainy season. Specifically, rice is typically planted between May and October and harvested between November and December. Consequently, rice straw burning usually occurs in November and December. However, a rise in burned area is observed in April, which is associated with land preparation for off-season rice cultivation in certain regions.
In maize plantation areas, burned areas are widely distributed across the region, in contrast to other agricultural regions, as shown in Figure 7. This widespread distribution can largely be attributed to the agronomic advantages of maize, particularly its ability to thrive without irrigation[55]. As a result, this characteristic increases the likelihood of forest encroachment. In contrast, burning in sugarcane plantation areas is relatively limited, primarily because sugarcane farming is less prevalent in northern Thailand. This is partly due to the lack of sugarcane processing facilities in the region. Consequently, fires in sugarcane-growing areas are recorded at very low levels, with crop-specific economic and infrastructural factors strongly influencing agricultural burning across different farming systems.
Consistent with previous findings[56,57], many studies in Thailand continue to rely on dNBR for burned area detection[58-60]. However, the popular dNBR method depends heavily on the selection of appropriate pre- and post-fire imagery, limiting its applicability for monthly or high-frequency monitoring[61,62]. In contrast, machine learning approaches such as the GSR procedure can process large, continuous datasets more effectively and provide scalable, high-resolution results.
Accuracy assessment of the activity data
The accuracy assessment of the burned area classification is illustrated in Figure 8, which compares the classification results with the reference burned area data and the GSR procedure. The visual comparison shows strong correspondence between the detected burned areas and the reference datasets in both full-scene and close-up views [Figure 9].
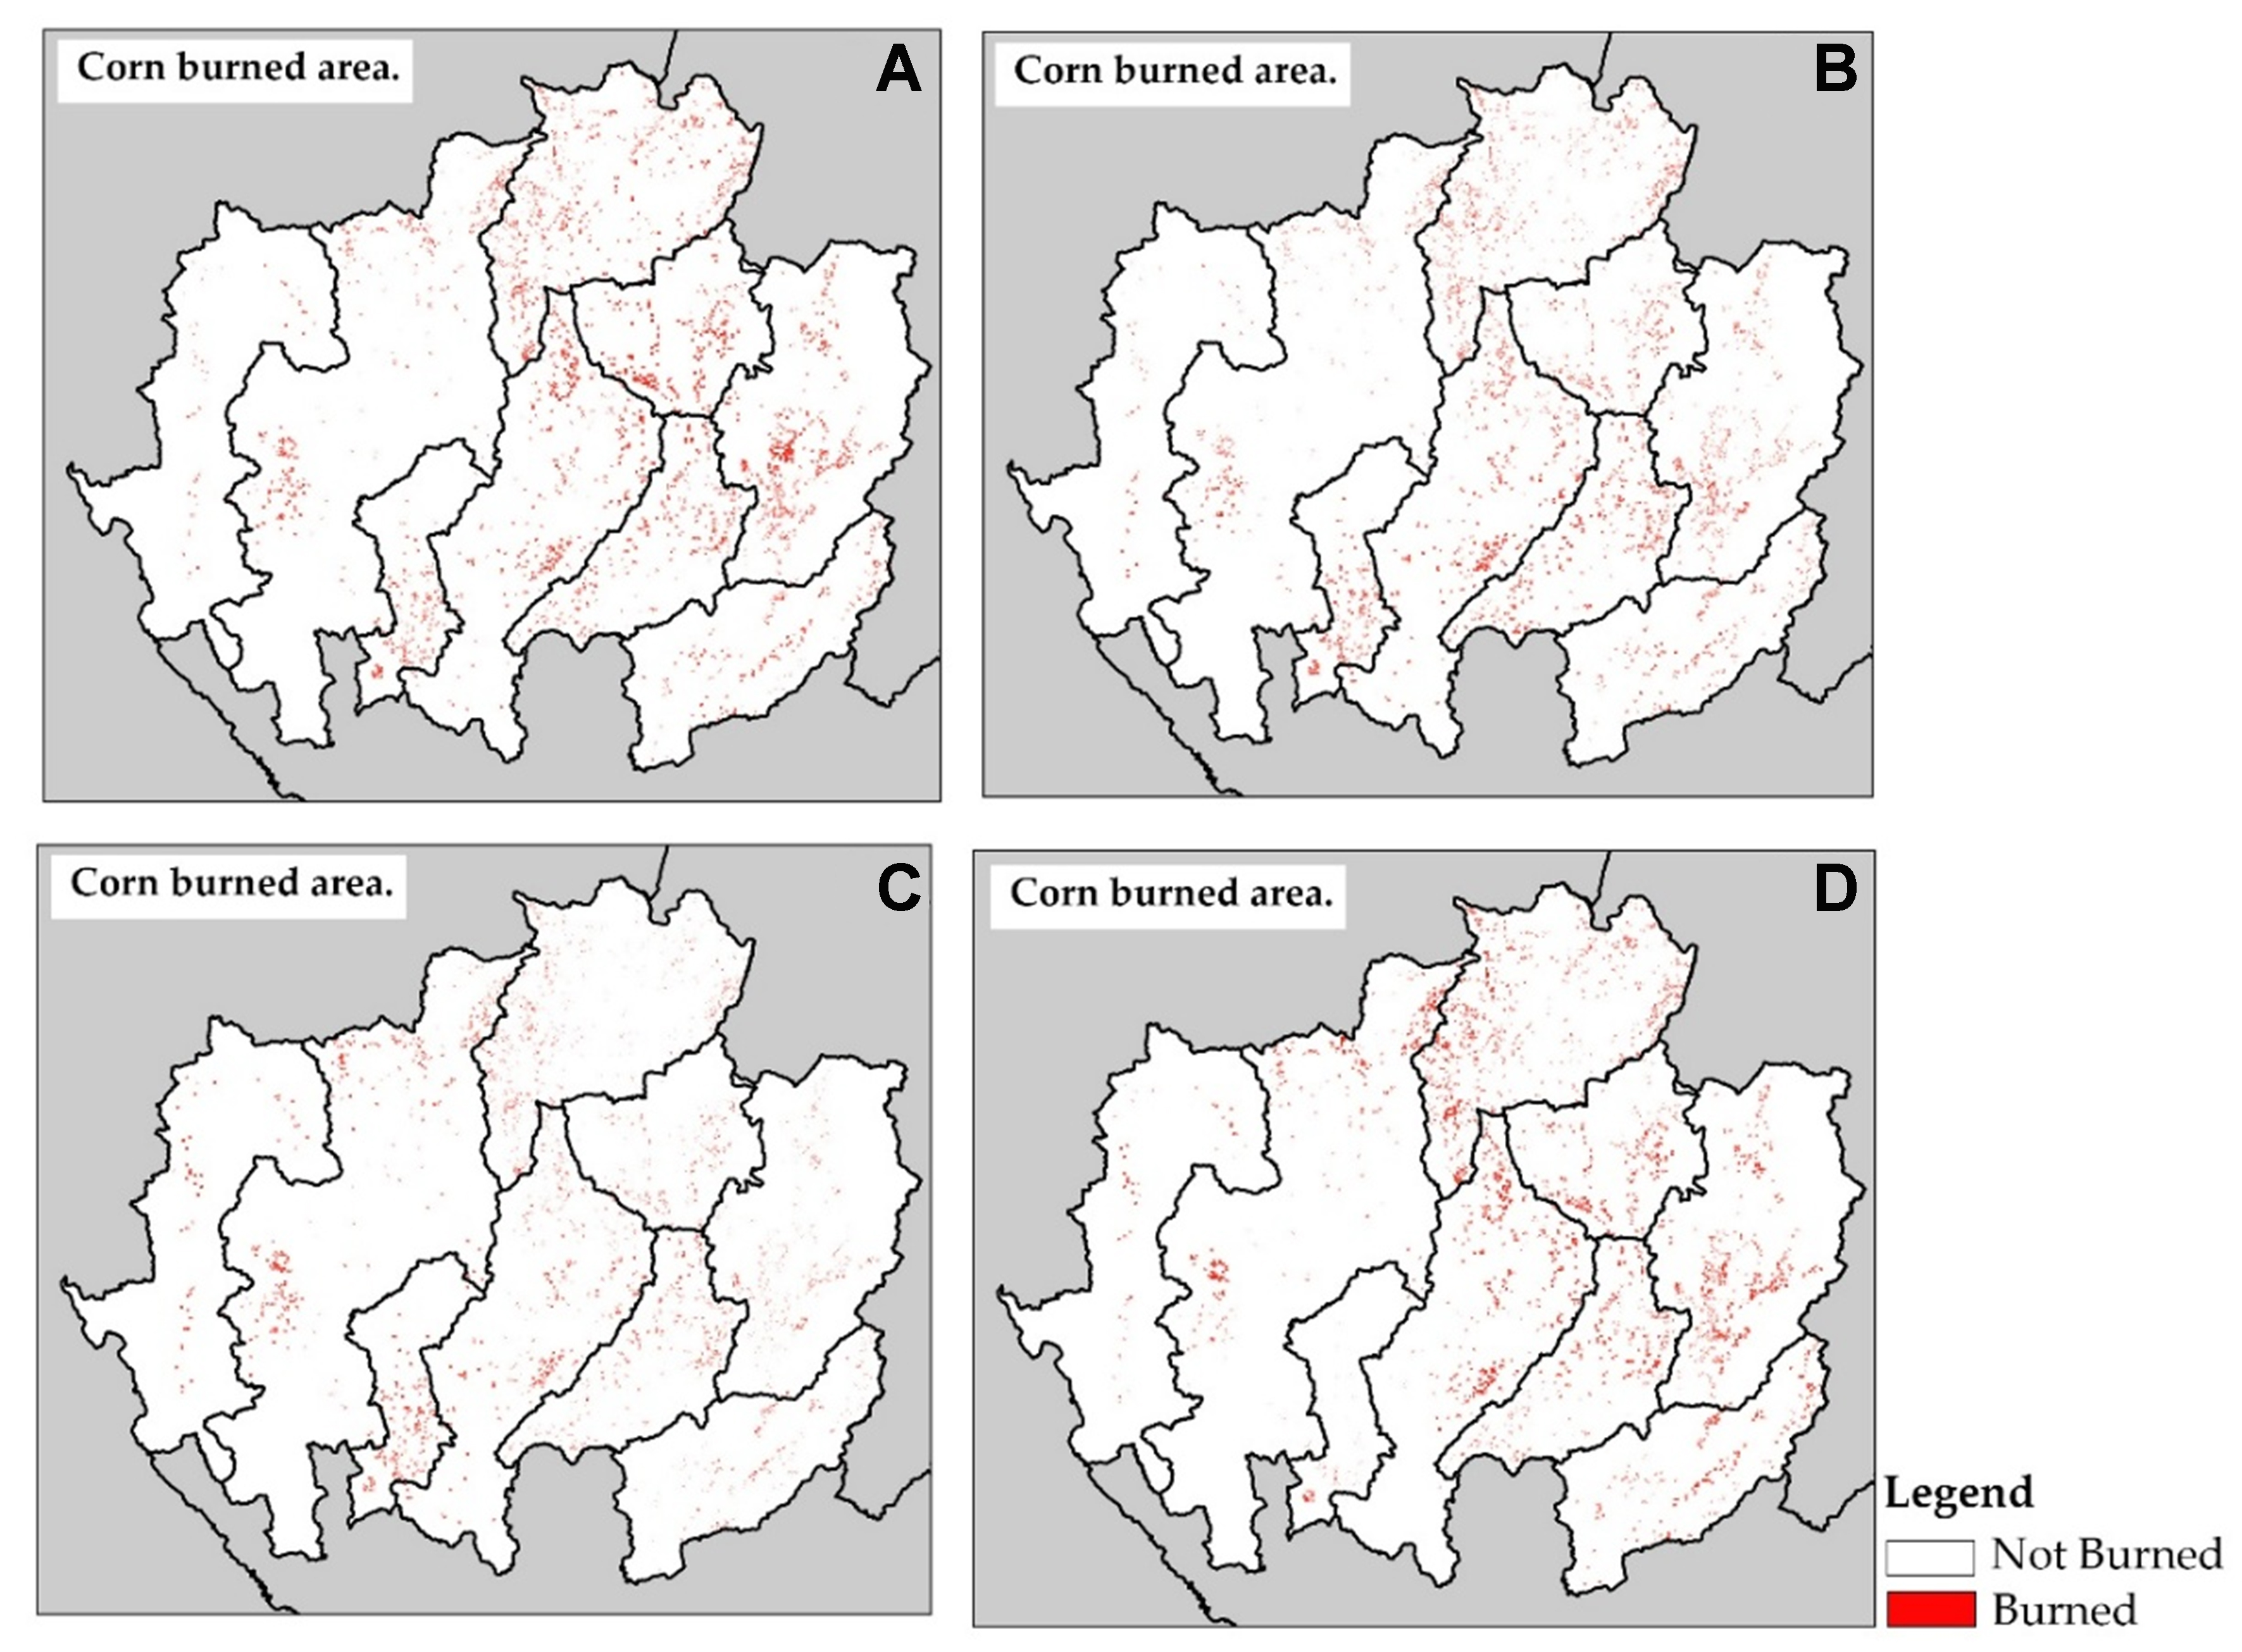
Figure 8. Burned areas in maize plantations in 2023: (A) January, (B) February, (C) March, and (D) April.
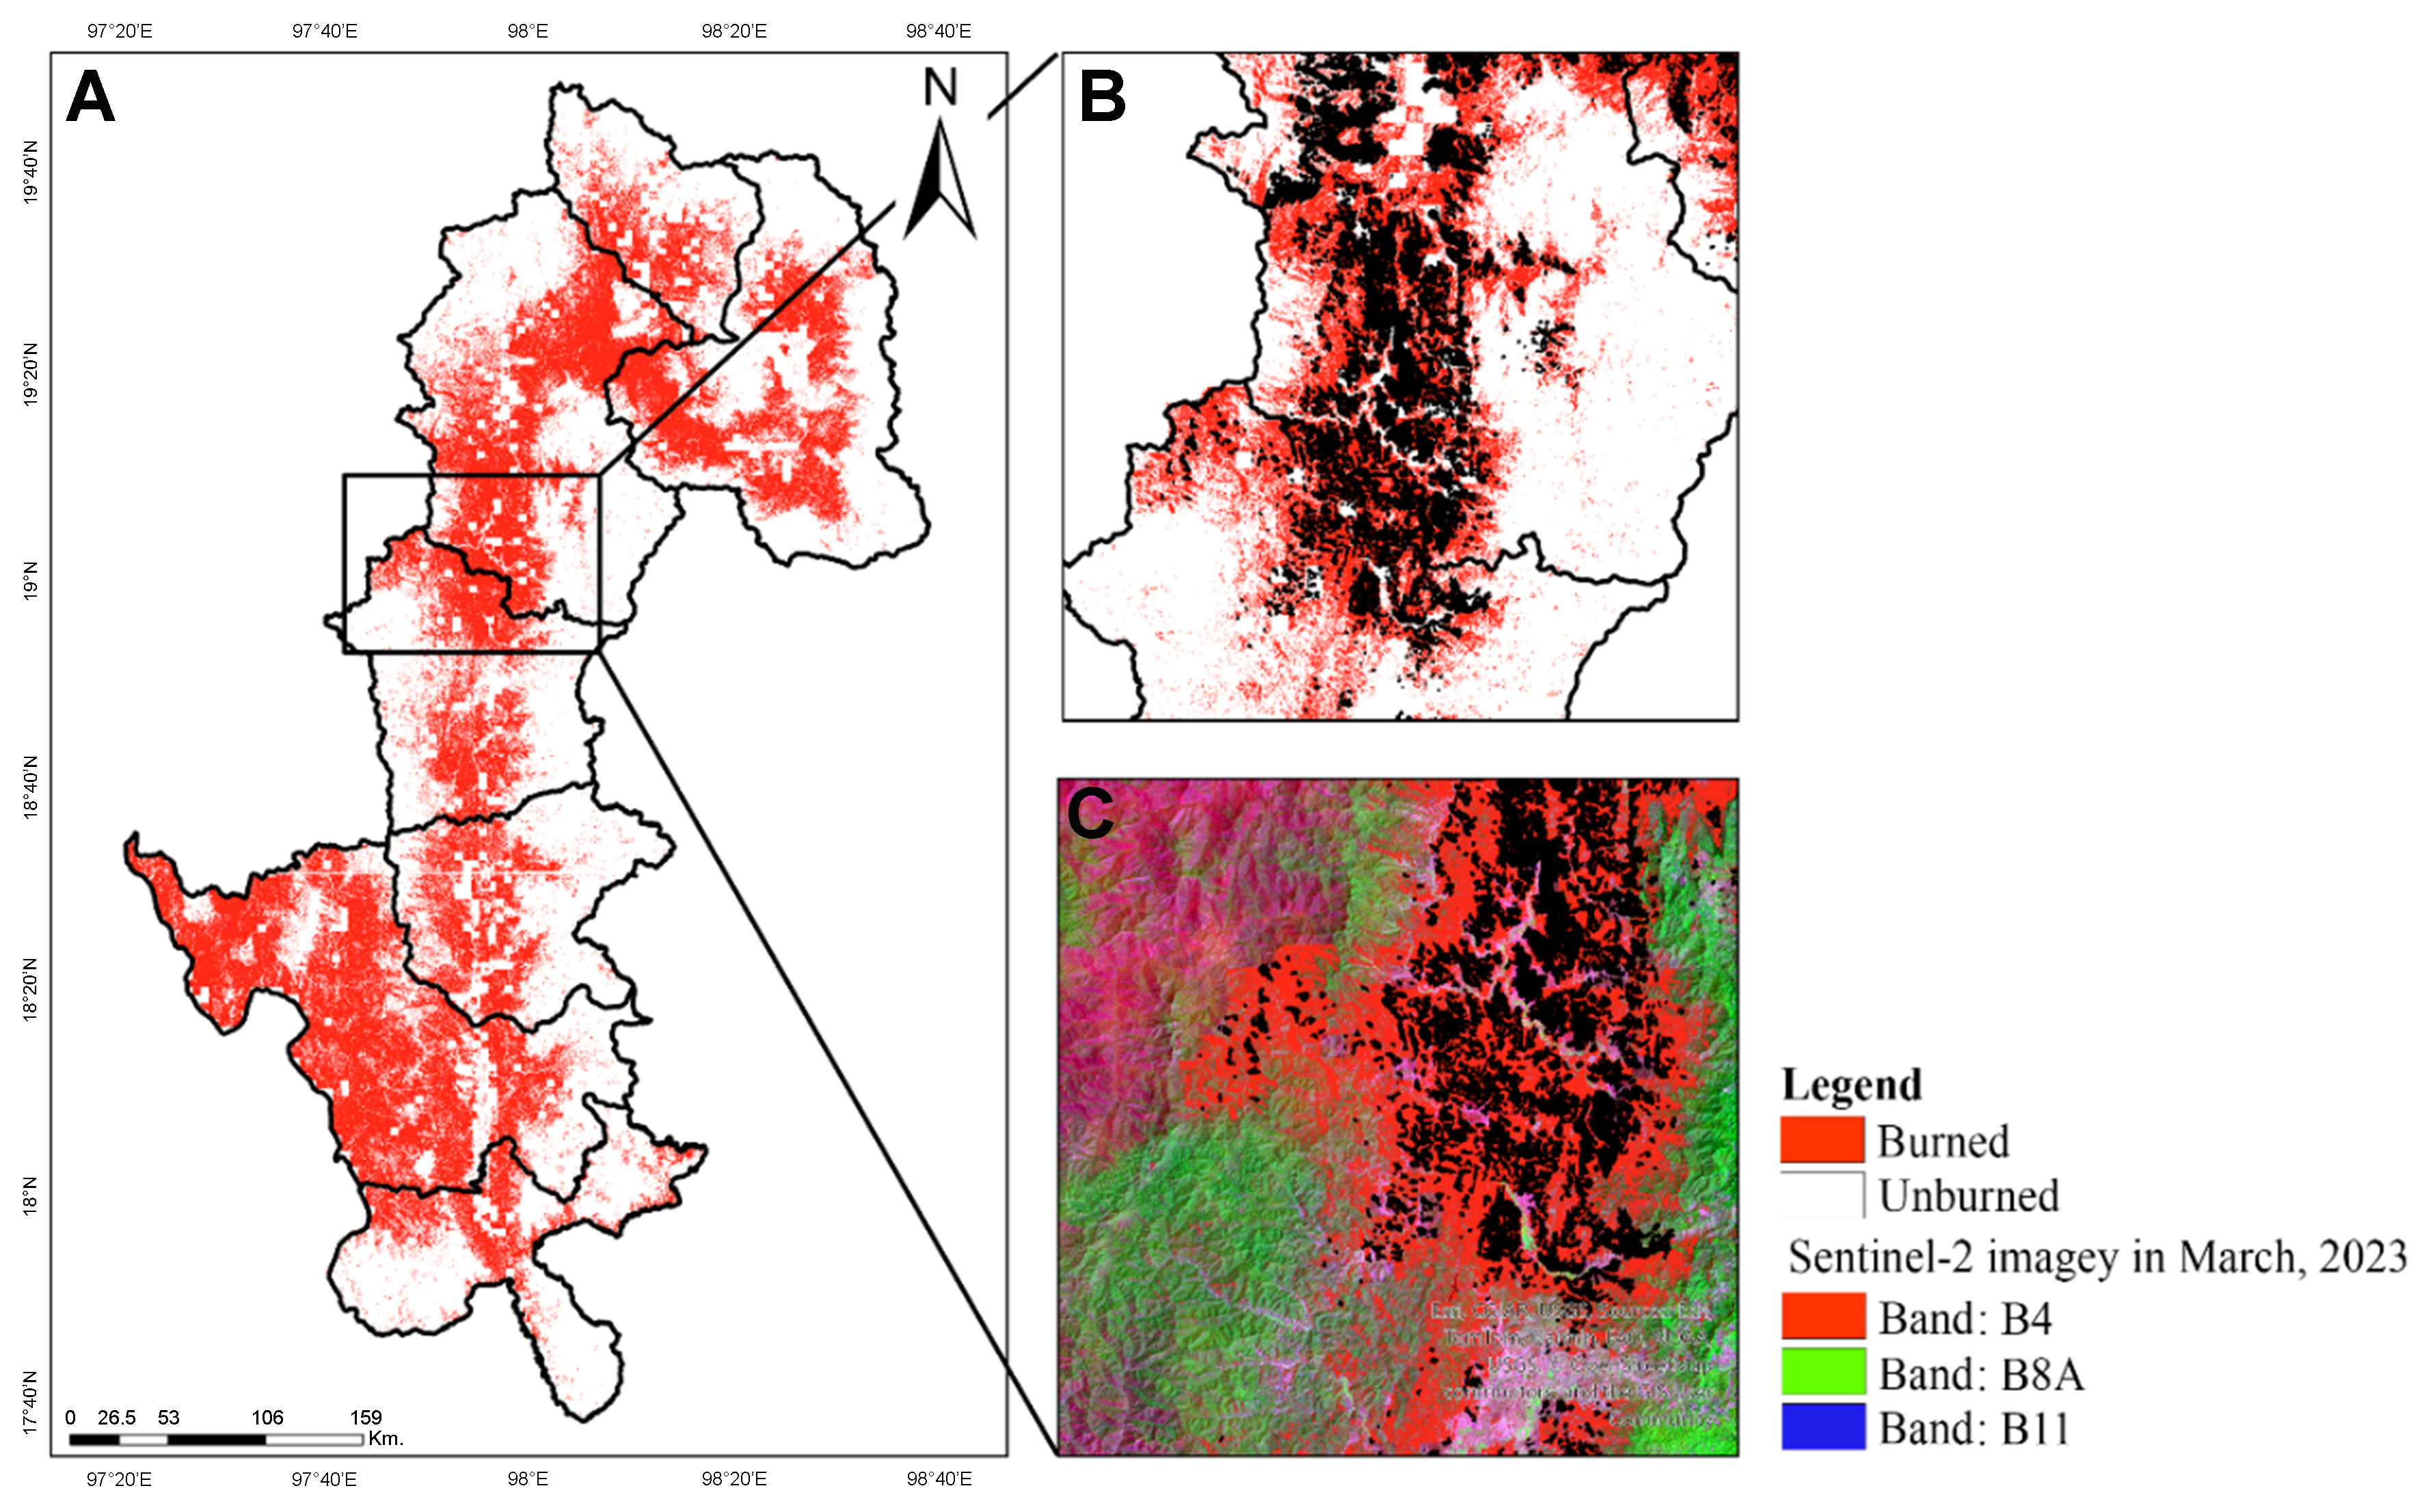
Figure 9. Map of the burned area as of March 2024 in Mae Hong Son: (A) Overall view; (B) Close-up of the area outlined by the black box in (A); and (C) Detailed view of the same area, including reference data and Sentinel-2 imagery.
In addition to visual interpretation, the quantitative accuracy assessment confirms strong performance. The average kappa coefficient values were 0.82 in January, 0.80 in February and March, 0.85 in April, and 0.88 in May, indicating consistently high classification reliability throughout the fire season. The accuracy assessment is further summarized in Table 5, which presents the confusion matrix and corresponding performance metrics.
Confusion matrix and performance metrics for the burned area assessment in Mae Hong Son, Thailand
| Confusion matrix | Predicted | Performance metrics | ||||
| Burned | Not burned | Accuracy | Precision | Recall | F1 score | |
| Actual | ||||||
| Burned | 1534 | 54 | 96.60 | 93.03 | 96.60 | 97.78 |
| Not burned | 115 | 684 | 85.61 | 92.68 | 85.61 | 89.00 |
| Overall accuracy (%) | 92.91 | |||||
| Kappa coefficient | 0.83 | |||||
The PM-bound PAHS emissions
The estimation of PM-bound PAH emissions, presented in Tables 6 and 7, was derived by integrating high-resolution burned area data generated in this study with specific EFs and combustion parameters (e.g., fuel density and combustion completeness) sourced from established literature[34-39]. An assessment of PM-bound PAH emissions from forest fires showed that Chr was the most prevalent PAH across all size-fractionated PM, particularly in PM1.0-2.5 and PM2.5-10. These particle size ranges are critical because they can penetrate deeply into the human respiratory system, increasing the risk of adverse health effects[63,64]. PM10 exhibited a different trend compared with smaller particles, with naphthalene (Nap) identified as the dominant compound. This result indicates that PAH compounds attach differently to particles of varying sizes. It is important to note that PM-bound PAH emissions during the dry seasons from 2020 to 2024 showed similar trends. Consequently, the results from 2023 were used to represent the overall findings, as this year recorded the highest emissions. Detailed information on PM-bound PAH emissions from forest fires during the 2023 dry season is shown in Table 6. The results are categorized into high-molecular-weight (HMW) and low-molecular-weight (LMW) PAHs.
PM-bound PAH emission from forest fires during the dry season in 2023
| Group | Type of PAHs | Chemical mass concentration of each particle size (g) | |||||
| < 0.1 | 0.1-0.5 | 0.5-1.0 | 1.0-2.5 | 2.5-10 | > 10 | ||
| LMW | Nap | 2.77 | 9.17 | 8.30 | 28.20 | 60.55 | 10.90 |
| Act | 4.33 | 4.84 | 3.63 | 24.57 | 86.67 | 6.92 | |
| Ace + Fle | 5.36 | 5.71 | 7.61 | 15.40 | 26.64 | 2.60 | |
| Phe | 10.38 | 13.67 | 24.39 | 19.55 | 58.99 | 6.40 | |
| Ant | 6.57 | 9.86 | 3.46 | 10.21 | 12.63 | 0.87 | |
| HMW | Flu | 6.75 | 5.71 | 5.36 | 32.87 | 24.57 | 0.87 |
| Pyr | 4.33 | 1.90 | 3.98 | 24.74 | 35.81 | 0.87 | |
| BaA | 4.50 | 3.29 | 4.67 | 6.40 | 23.53 | 0.69 | |
| Chr | 26.99 | 28.89 | 56.92 | 184.07 | 275.59 | 2.77 | |
| BbF | 6.23 | 5.88 | 12.11 | 48.09 | 28.72 | 4.33 | |
| BkF | 3.98 | 4.15 | 12.98 | 12.98 | 37.71 | 2.25 | |
| BaP | 1.21 | 1.90 | 0.87 | 2.08 | 1.04 | 0.17 | |
| DBA | 2.08 | 1.04 | 3.81 | 2.94 | 1.04 | 0.17 | |
| BghiPe | 2.94 | 2.25 | 3.63 | 2.25 | 3.63 | - | |
| IDP | 2.77 | 2.60 | 3.98 | 2.25 | 3.29 | 0.69 | |
PM-bound PAH emissions from crop residues during the dry season in 2023
| Group | Type of PAHs | Chemical mass concentration of each particle size (g) | |||||
| < 0.1 | 0.1-0.5 | 0.5-1.0 | 1.0-2.5 | 2.5-10 | > 10 | ||
| LMW | Nap | 0.0285 | 0.0168 | 0.0372 | 0.1181 | 0.1336 | 0.2087 |
| Act | 0.0425 | 0.1229 | 0.0521 | 0.3801 | 0.2979 | 0.2629 | |
| Ace + Fle | 0.0081 | 0.0736 | 0.0575 | 0.0754 | 0.1233 | 0.0189 | |
| Phe | 0.0122 | 0.0200 | 0.0568 | 0.1374 | 0.1918 | 0.0157 | |
| Ant | 0.0359 | 0.0487 | 0.0504 | 0.0614 | 0.0709 | 0.0124 | |
| HMW | Flu | 0.0254 | 0.0396 | 0.0341 | 0.1692 | 0.0929 | 0.0066 |
| Pyr | 0.0286 | 0.0388 | 0.0455 | 0.2197 | 0.2184 | 0.0042 | |
| BaA | 0.0798 | 0.0942 | 0.1430 | 0.2427 | 0.2465 | 0.0023 | |
| Chr | 0.3602 | 0.3156 | 0.6699 | 0.9829 | 0.7627 | 0.0111 | |
| BbF | 0.3424 | 0.0852 | 0.2478 | 0.5966 | 0.6028 | 0.0053 | |
| BkF | 0.1551 | 0.0299 | 0.0795 | 0.3699 | 0.1275 | 0.0025 | |
| BaP | 0.0557 | 0.0631 | 0.0200 | 0.0822 | 0.0358 | 0.0048 | |
| DBA | 0.0252 | 0.0403 | 0.0672 | 0.0385 | 0.0676 | 0.0047 | |
| BghiPe | 0.0242 | 0.0120 | 0.0722 | 0.0525 | 0.0787 | 0.0029 | |
| IDP | 0.0139 | 0.0142 | 0.0660 | 0.0431 | 0.0651 | 0.0030 | |
From Table 6, a significant presence of Chr was observed in both the PM1.0-2.5 and PM2.5-10 fractions. This may be attributed to condensation processes and the absorption behavior of these compounds during combustion. This dominance is primarily driven by volatility distribution and gas-particle partitioning mechanisms. As a HMW semi-volatile PAH, Chr undergoes rapid condensation from the gas phase onto the surfaces of pre-existing particles as the combustion plume cools. This process preferentially occurs on accumulation-mode particles, which provide a large surface area for adsorption and facilitate the adsorption of HMW PAHs such as Chr. In particular, PM2.5 has a relatively large surface area, which enhances its ability to adsorb semi-volatile organic compounds[65]. PM10 was found to contain compounds with HMW and specific chemical properties. In crop residues [Table 7], Chr was also identified as the dominant PAH, although it was released in lower amounts than in forest fires. The highest PAH emissions were recorded in the PM1.0-2.5 fraction (0.9829 g) and the PM0.5-1.0 fraction (0.6699 g). These results indicate that crop residues, particularly rice straw, maize stalks, and sugarcane leaves, released Chr within the PM1.0-2.5 and PM0.5-1.0 fractions. These PM size ranges can remain airborne for extended periods and disperse over large areas, thereby increasing their potential impact on air quality and public health[66]. However, for crop residues, the emission characteristics were consistent with those of forest fires, but the quantities were significantly lower, as shown in Table 7.
From Table 7, Chr exhibited the highest emissions across most size-fractionated PM, except for PM10, where the maximum value was only 0.0111 g. In this fraction, Act was the most abundant compound (0.2629 g). This finding contrasts with forest fire emissions, where PM10 typically shows the highest Nap concentration. In crop residues, however, Act was the dominant compound in this size fraction. This difference is mainly attributed to variations in biomass fuel types and combustion conditions[67]. In forest areas, biomass materials such as wood debris and dry leaves, when burned under variable temperatures, commonly produce PAHs. Although Nap is classified as an LMW PAH, it has been found to associate with larger particles, such as PM10, under specific combustion conditions[68]. Conversely, in crop residues, combustion of different biomass types leads to higher emissions of Chr, including in larger particle sizes. In addition, BaP concentrations were influenced by landscape characteristics, with areas of dense forest cover presenting higher pollution levels[69,70], as shown in Figure 10.
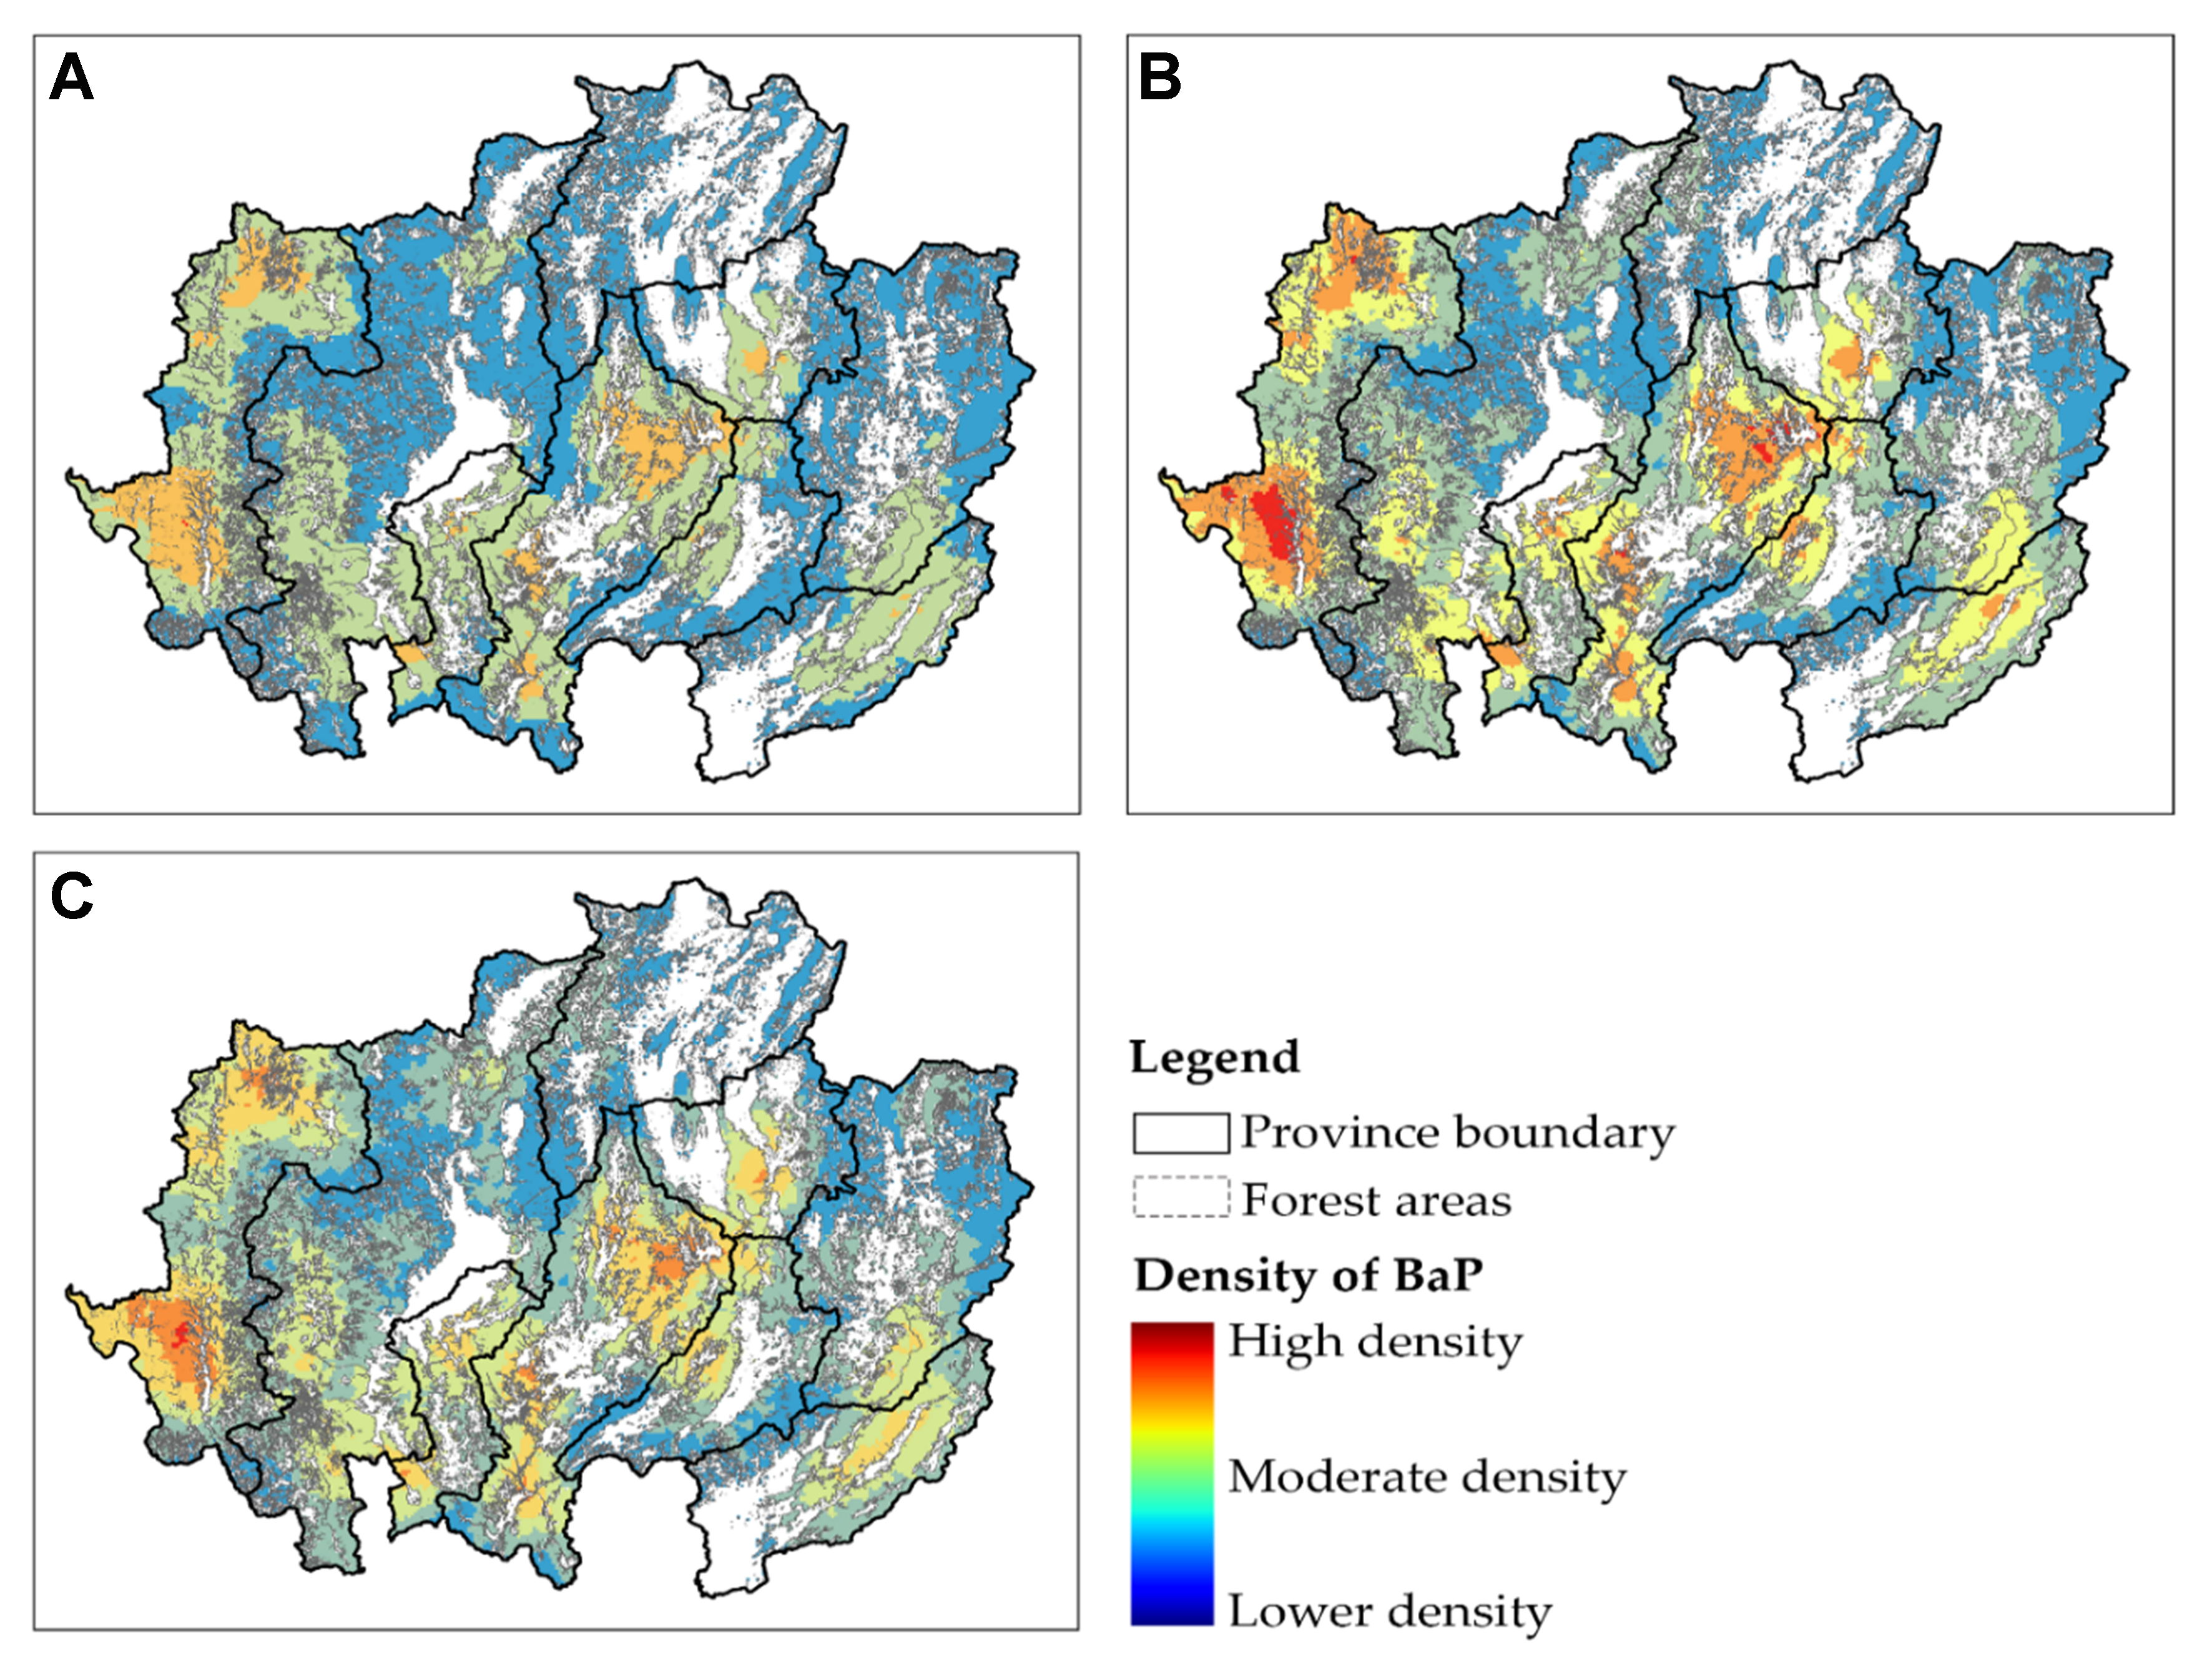
Figure 10. Spatial distribution of BaP from (A) PM<0.1, (B) PM0.1-1.0, and (C) PM1.0-2.5 in 2023 following a forest fire. BaP: Benzo[a]pyrene; PM: particulate matter.
Crop residues were found to release lower levels of carcinogenic PAHs compared with forest fires. Moreover, BaP recorded a maximum emission of only 0.0822 g in the PM1.0-2.5 fraction, compared with 2.08 g emitted by forest fires. While Chr remained the most prevalent PAH within the HMW group resulting from the combustion of crop residues, its concentration in PM1.0-2.5 was only 0.9829 g, which was 180 times lower than that emitted by forest fires. Similarly, BbF, which showed emissions of 48.09 g from forest fires in the PM1.0-2.5 fraction, was detected at only 0.5966 g from crop residues. The analysis indicated that forest fires were the primary source of carcinogenic PAHs, especially in PM2.5, which can penetrate deeply into the human respiratory system and accumulate within the body. Consequently, the management and control of forest fires were identified as critical for reducing public health risks during the dry season. The spatial distribution of these emissions is presented in Figure 11.
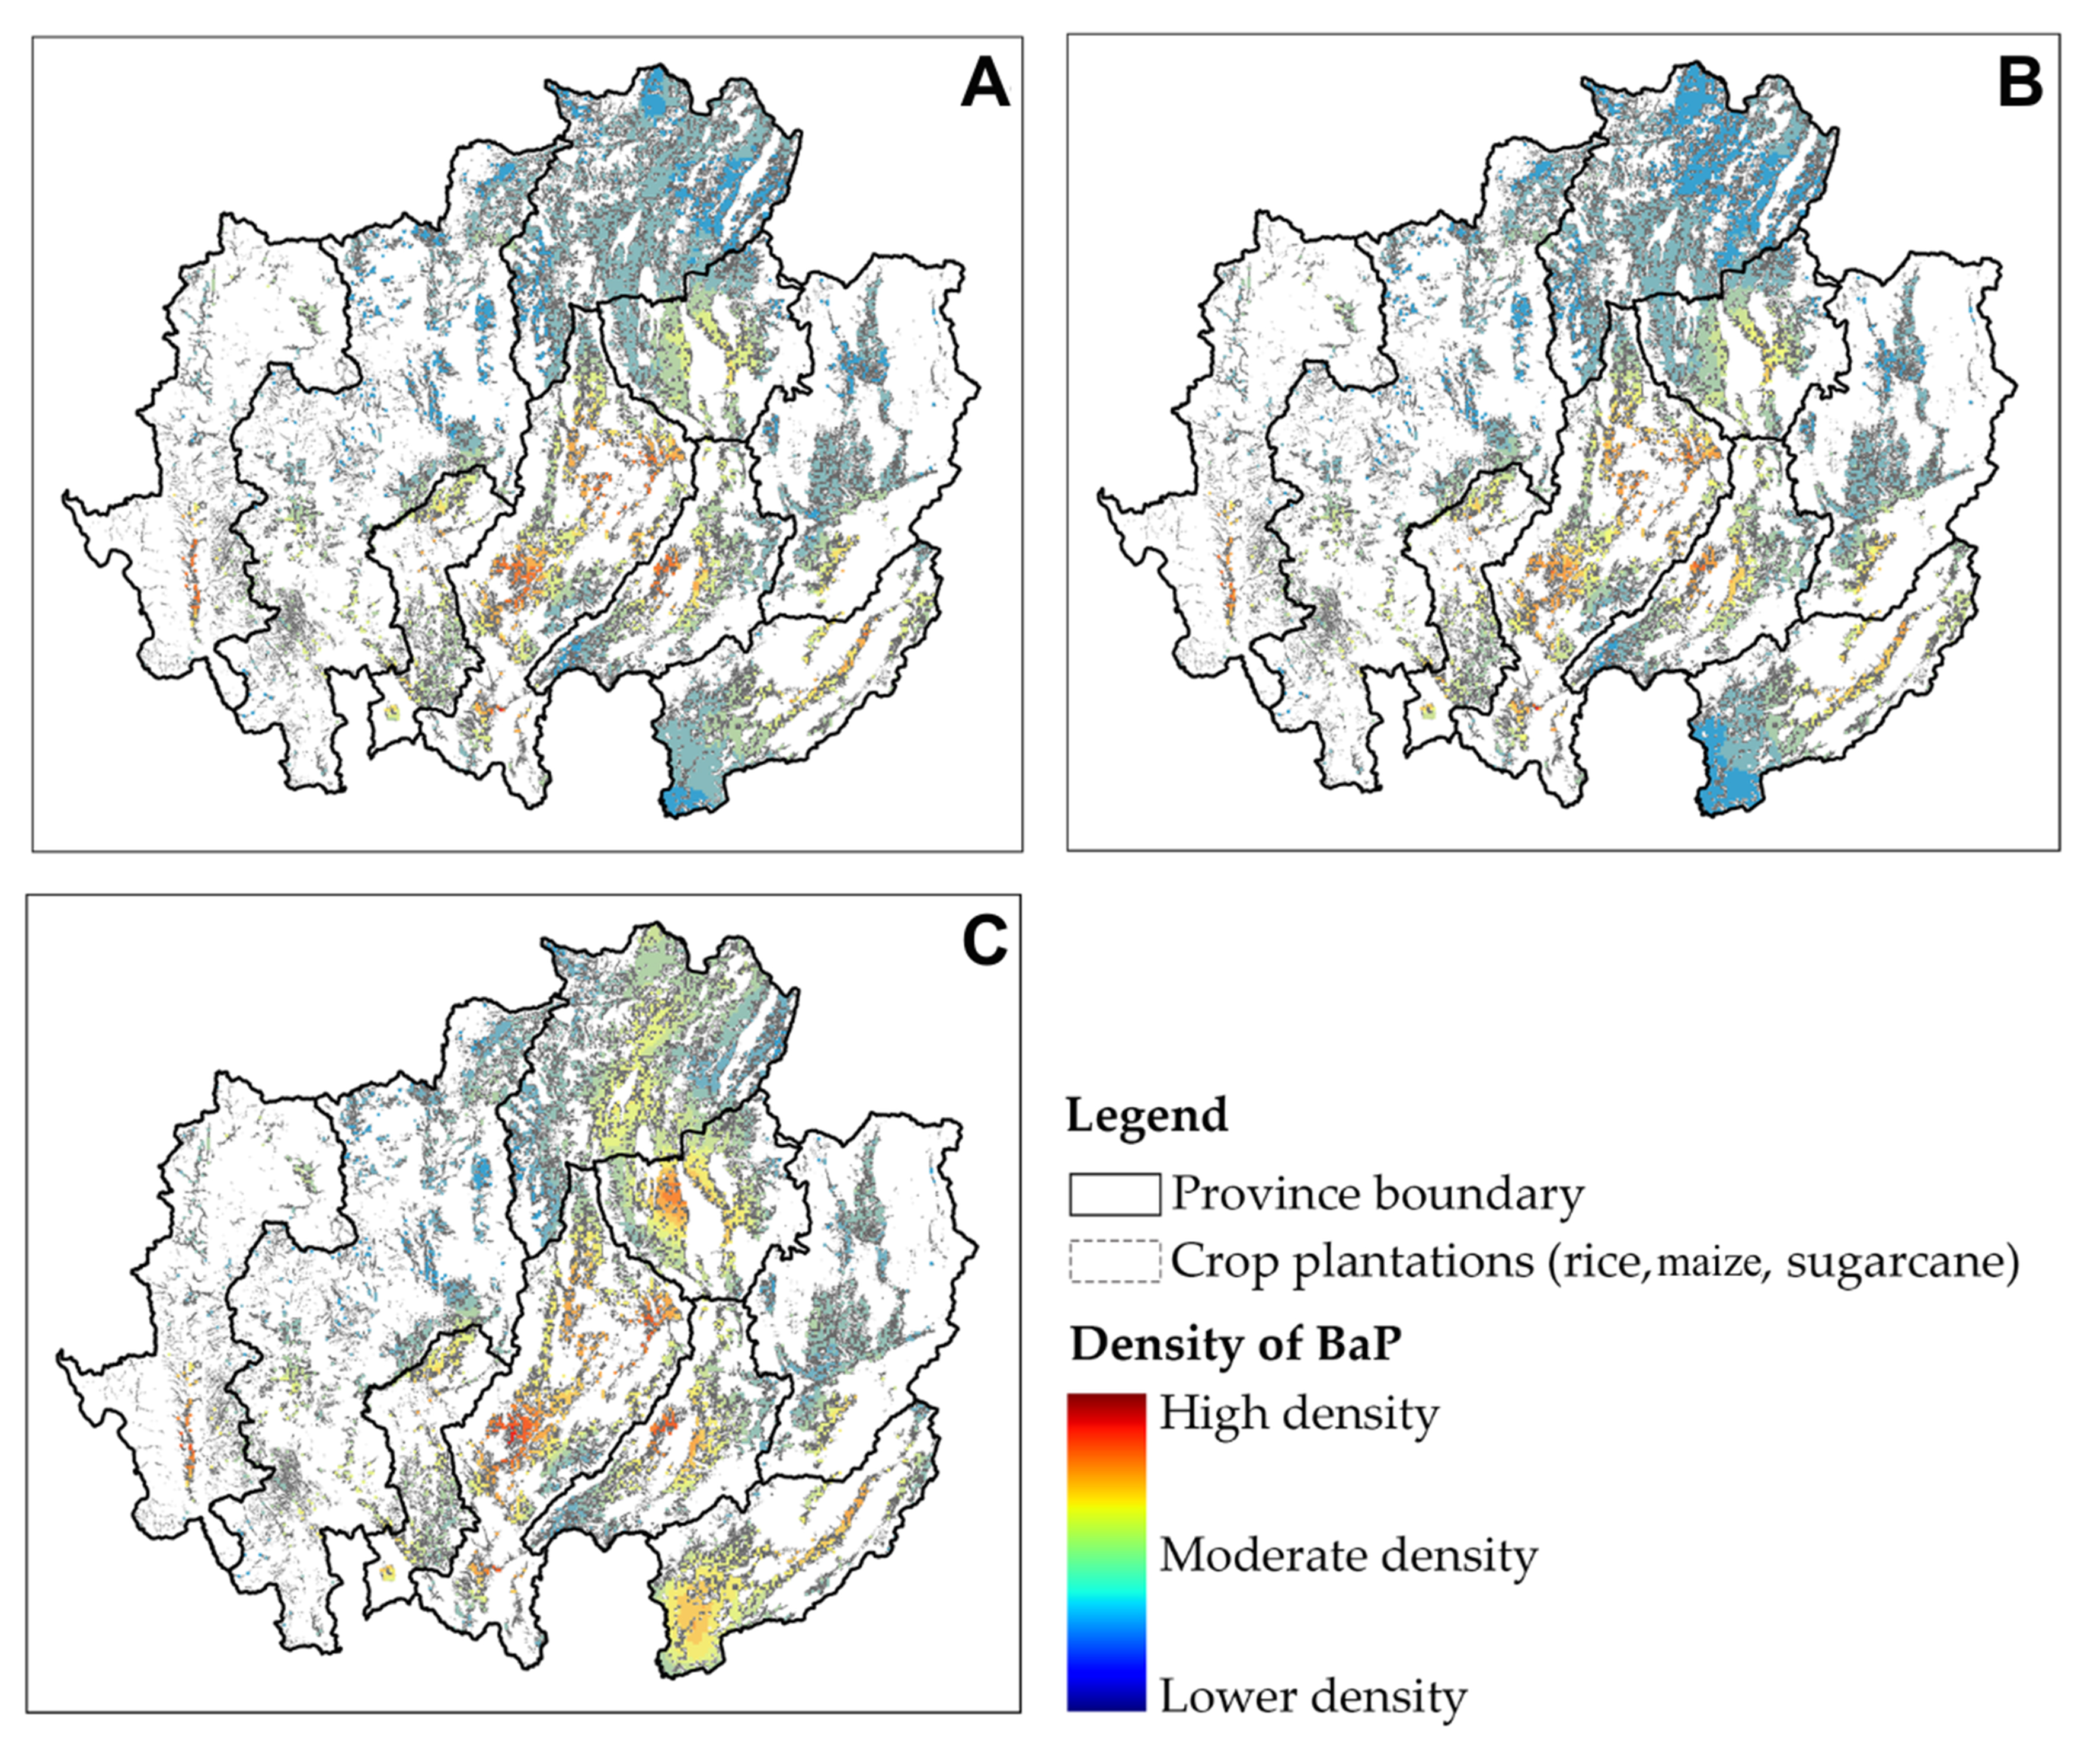
Figure 11. Spatial distribution of BaP from (A) PM<0.1, (B) PM0.1-1.0, and (C) PM1.0-2.5 in 2023 from crop residue burning. BaP: Benzo[a]pyrene; PM: particulate matter.
The analysis of PAH emissions revealed that Chr was the dominant PAH in most particle size fractions, particularly in the PM1.0-2.5 and PM2.5-10 ranges, whereas Nap was the dominant compound in the > 10 μm fraction. This pattern aligns with the combustion characteristics of mixed biomass in the region but differs from those reported in other contexts[71-73]. These differences can be attributed to variations in biomass type, combustion temperature, moisture content, and chemical composition, all of which influence PAH profiles[68,74]. Forest fires released higher amounts of PAHs across almost all compounds and particle size fractions. This is due to the larger biomass fuel load and the higher content of woody material and dry leaves, which are rich sources of HMW PAHs[47]. Chr was identified as the dominant PAH from crop residue burning, such as rice straw and maize stalks, but was released in lower amounts due to the smaller fuel mass and lower carbon density of the biomass[70]. In terms of health impacts, the high levels of Chr and BaP in the PM1.0-2.5 fraction were identified as a significant concern. Their persistence in the atmosphere increases the potential for long-range transport, contributing to both local and transboundary air pollution[75,76]. Emissions and accumulation of PAHs were strongly influenced by landform and meteorological conditions. In northern Thailand, mountainous terrain and valley structures were shown to restrict pollutant dispersion[77]. During the dry season, low relative humidity and high temperatures were found to enhance combustion efficiency, thereby increasing pollutant emissions[78].
To quantitatively assess human exposure, we calculated the TEQ of PAHs using BaP as a reference. During the biomass burning period, the estimated BaP-equivalent concentrations ranged from 0.86 to 2.76 ng/m3 across different size fractions. These values exceeded the WHO air quality guideline for BaP (1 ng/m3, annual average) by approximately 2-3 times. This indicates that during intense burning episodes, populations in the study area are exposed to carcinogenic PAH levels that significantly exceed international health-based thresholds, highlighting substantial inhalation risk. The results indicate that PAHs attach to particles varying from PM>10 to PM0.1. PM>10 particles are larger and more likely to remain in the upper respiratory tract. In contrast, PM2.5 and PM0.1 particles are smaller and can get deeper into the lungs. Some PAHs, such as BaP and DahA, can bind to PM0.1 and enter the bloodstream, where they can induce carcinogenic and mutagenic effects. Therefore, long-term exposure to PAHs attached to PM2.5 and PM0.1 may cause their accumulation in the lungs and bloodstream, leading to oxidative stress, inflammation, and DNA damage. These repeated exposures significantly elevate the risk of non-communicable diseases (such as lung cancer, cardiovascular disease, and COPD), particularly among vulnerable populations, including children, pregnant women, older adults, and individuals with pre-existing health conditions.
CONCLUSIONS
This study investigated the contributions of open biomass burning to the emission of PM-bound PAHs in Northern Thailand through an integrated spatial analysis approach. The compositional profiles of PAHs in this study are consistent with established EFs reported in the literature. However, the main contribution of this work lies in the novel, high-resolution (10 m) spatiotemporal quantification of total emissions from size-resolved PAH-bearing particles. The integration of Sentinel-2 MSI imagery with the RF algorithm on the Google Colab platform, as part of the GSR procedure, proved highly effective for detecting burned areas and accurately estimating emissions. This approach enables detailed spatial and temporal analyses that go beyond the limits of ground-based monitoring. The findings confirm that forest fires are the predominant source of toxic compounds that accumulate in both fine and coarse particulate fractions, posing severe long-term risks to human health. To address these environmental challenges, future management should prioritize rigorous fire prevention strategies and alternative land management practices to reduce biomass combustion and improve regional air quality.
DECLARATIONS
Authors’ contributions
Made substantial contributions to the conception and design of the study: Paluang, P.; Thavorntam, W.; Phairuang, W.
Performed data analysis, modeling, and interpretation of the results: Paluang, P.; Thavorntam, W.; Phairuang, W.; Samae, H.; Sangkham, S.
Contributed to supervision, project administration, and critical revision of the manuscript: Chetiyanukornkul, T.; Suriyawong, P.; Furuuchi, M.; Phairuang, W.
All authors read and approved the final manuscript.
Availability of data and materials
All datasets and materials used in this study are described in the Experimental section. No additional data are available beyond those reported in the manuscript.
AI and AI-assisted tools statement
During the preparation of this manuscript, the AI tool Gemini (version 1.5 Flash, released 2024-05-14) was used solely for language editing. The tool did not influence the study design, data collection, analysis, interpretation, or the scientific content of the work. All authors take full responsibility for the accuracy, integrity, and final content of the manuscript.
Financial support and sponsorship
This work was financially supported by the Office of the Permanent Secretary, Ministry of Higher Education, Science, Research and Innovation, Thailand (Grant No. RGNS 63-253). Additionally, this research was partially supported by JICA-JST SATREPS (Grant No. JPMJSA2102).
Conflicts of interest
Phairuang, W. is a Youth Editorial Board Member of Journal of Environmental Exposure Assessment. He had no involvement in the editorial or peer review process of this manuscript, including reviewer selection, manuscript evaluation, or the final publication decision. The other authors declared that there are no conflicts of interest.
Ethical approval and consent to participate
Not applicable.
Consent for publication
Not applicable.
Copyright
© The Author(s) 2026.
REFERENCES
1. Lee, H.; Bae, M.; Kim, J.; Kim, M. Characteristics and chemical composition of PM2.5 in agricultural regions: a case study in Jeonbuk-do, South Korea. Air. Qual. Atmos. Health. 2025, 18, 3567-80.
2. Bhatta, J.; Laosee, O.; Janmaimool, P.; Strezov, V.; Rattanapan, C. Spatiotemporal analysis of particulate matter (PM10 and PM2.5) and health risks in Thailand’s urban core. Chemosphere 2025, 388, 144687.
3. Regia, R. A.; Oginawati, K.; Suharyanto; Soemarko, D. S.; Amin, M.; Santoso, M. Characterization of size-segregated PM0.1 down to UFP (PM0.1) and its trace and major elemental composition in blacksmith factories, Indonesia. J. Environ. Expo. Assess. 2025, 4, 38.
5. Oberdörster, G.; Oberdörster, E.; Oberdörster, J. Nanotoxicology: an emerging discipline evolving from studies of ultrafine particles. Environ. Health. Perspect. 2005, 113, 823-39.
6. Benabed, A.; Boulbair, A. PM10, PM2.5, PM1, and PM0.1 resuspension due to human walking. Air. Qual. Atmos. Health. 2022, 15, 1547-56.
7. Chauhan, B. V. S.; Corada, K.; Young, C.; Smallbone, K. L.; Wyche, K. P. Review on sampling methods and health impacts of fine (PM2.5, ≤2.5 µm) and ultrafine (UFP, PM0.1, ≤0.1 µm) particles. Atmosphere 2024, 15, 572.
8. Zhang, W.; Gao, M.; Xiao, X.; et al. Long-term PM0.1 exposure and human blood lipid metabolism: new insight from the 33-community study in China. Environ. Pollut. 2022, 303, 119171.
9. Vo, L. T.; Yoneda, M.; Nghiem, T.; et al. Indoor PM0.1 and PM2.5 in Hanoi: chemical characterization, source identification, and health risk assessment. Atmos. Pollut. Res. 2022, 13, 101324.
10. Qu, Y.; Liu, H.; Zhou, Y.; et al. Spectral dependence of light absorption and direct radiative forcing of the TSP, PM10, PM2.5 and PM0.1 in a rural region of northwestern China. Atmos. Environ. 2023, 292, 119417.
11. Usman, F.; Zeb, B.; Alam, K.; et al. In-depth analysis of physicochemical properties of particulate matter (PM10, PM2.5 and PM1) and its characterization through FTIR, XRD and SEM–EDX techniques in the foothills of the Hindu Kush Region of Northern Pakistan. Atmosphere 2022, 13, 124.
12. Liu, X.; Zhou, H.; Yi, X.; et al. Decomposition analysis of lung cancer and COPD mortality attributable to ambient PM2.5 in China (1990-2021). Asia. Pac. J. Oncol. Nurs. 2025, 12, 100653.
13. Sapbamrer, P.; Assavanopakun, P.; Panumasvivat, J. Decadal trends in ambient air pollutants and their association with COPD and lung cancer in upper Northern Thailand: 2013-2022. Toxics 2024, 12, 321.
14. Zhang, T.; Mao, W.; Gao, J.; et al. The effects of PM2.5 on lung cancer-related mortality in different regions and races: a systematic review and meta-analysis of cohort studies. Air. Qual. Atmos. Health. 2022, 15, 1523-32.
15. Wang, Z.; Meng, Q.; Sun, K.; Wen, Z. Spatiotemporal distribution, bioaccumulation, and ecological and human health risks of polycyclic aromatic hydrocarbons in surface water: a comprehensive review. Sustainability 2024, 16, 10346.
16. Feng, Y.; Li, Z.; Li, W. Polycyclic aromatic hydrocarbons (PAHs): environmental persistence and human health risks. Nat. Prod. Commun. 2025, 20.
17. Hensel, A. K.; Hakkarainen, H.; Yang, M.; et al. Optimisation of ultrafine particle exposure in an alveolar tri-culture model at the air-liquid interface. Toxicol. In. Vitro. 2026, 112, 106189.
18. Chen, L.; Yousaf, M.; Xu, J.; et al. Ultrafine particles deposition in human respiratory tract: experimental measurement and modeling. Ecotoxicol. Environ. Saf. 2025, 295, 118123.
19. Gualtieri, M.; Melzi, G.; Costabile, F.; et al. On the dose-response association of fine and ultrafine particles in an urban atmosphere: toxicological outcomes on bronchial cells at realistic doses of exposure at the Air Liquid Interface. Chemosphere 2024, 366, 143417.
20. Pongpiachan, S.; Popattanachai, N. Challenging the fire-centric paradigm: pollution sources and health effects of PM2.5 in Thailand. J. Asian. Public. Policy. 2026.
21. Suwanprasit, C.; Shahnawaz. Mapping burned areas in Thailand using Sentinel-2 imagery and OBIA techniques. Sci. Rep. 2024, 14, 9609.
22. Ogungbuyi, M. G.; Guerschman, J.; Fischer, A. M.; Mohammed, C.; Crabbe, R. A.; Harrison, M. T. Using vegetation indices from nanosatellites for timely prediction of pasture biomass. Total. Environ. Adv. 2025, 15, 200130.
23. Montero, D.; Aybar, C.; Mahecha, M. D.; Martinuzzi, F.; Söchting, M.; Wieneke, S. A standardized catalogue of spectral indices to advance the use of remote sensing in Earth system research. Sci. Data. 2023, 10, 197.
25. Phairuang, W.; Suwattiga, P.; Chetiyanukornkul, T.; et al. The influence of the open burning of agricultural biomass and forest fires in Thailand on the carbonaceous components in size-fractionated particles. Environ. Pollut. 2019, 247, 238-47.
26. Bisong, E. Google Colaboratory. In Building machine learning and deep learning models on Google Cloud Platform: a comprehensive guide for beginners; Apress, Berkeley; 2019. pp. 59-64.
27. Vallejo, W.; Díaz-Uribe, C.; Fajardo, C. Google Colab and virtual simulations: practical e-learning tools to support the teaching of thermodynamics and to introduce coding to students. ACS. Omega. 2022, 7, 7421-9.
28. Rippner, D. A.; Raja, P. V.; Earles, J. M.; et al. A workflow for segmenting soil and plant X-ray computed tomography images with deep learning in Google’s Colaboratory. Front. Plant. Sci. 2022, 13, 893140.
29. Garavagno, A. M.; Leonardis, D.; Frisoli, A. ColabNAS: obtaining lightweight task-specific convolutional neural networks following Occam’s razor. Future. Gener. Comput. Syst. 2024, 152, 152-9.
31. Canty, A. J. Resampling methods in R: the boot package. 2002. https://journal.r-project.org/articles/RN-2002-017/RN-2002-017.pdf. (accessed 2026-05-06).
32. Rodriguez-Galiano, V.; Ghimire, B.; Rogan, J.; Chica-Olmo, M.; Rigol-Sanchez, J. An assessment of the effectiveness of a random forest classifier for land-cover classification. ISPRS. J. Photogramm. Remote. Sens. 2012, 67, 93-104.
33. Giglio, L.; van der Werf, G. R.; Randerson, J. T.; Collatz, G. J.; Kasibhatla, P. Global estimation of burned area using MODIS active fire observations. Atmos. Chem. Phys. 2006, 6, 957-74.
34. Samae, H.; Tekasakul, S.; Tekasakul, P.; Furuuchi, M. Emission factors of ultrafine particulate matter (PM<0.1 μm) and particle-bound polycyclic aromatic hydrocarbons from biomass combustion for source apportionment. Chemosphere 2021, 262, 127846.
35. Sahu, S. K.; Ohara, T.; Beig, G.; Kurokawa, J.; Nagashima, T. Rising critical emission of air pollutants from renewable biomass based cogeneration from the sugar industry in India. Environ. Res. Lett. 2015, 10, 095002.
36. Junpen, A.; Garivait, S.; Bonnet, S.; Pongpullponsak, A. Spatial and temporal distribution of forest fire PM10 emission estimation by using remote sensing information. Int. J. Environ. Sci. Dev. 2011, 2, 156-61.
37. Cheewaphongphan, P.; Garivait, S. Bottom up approach to estimate air pollution of rice residue open burning in Thailand. Asia. Pac. J. Atmos. Sci. 2013, 49, 139-49.
38. Kanokkanjana, K.; Garivait, S. Climate change effect from black carbon emission from open burning of corn residues in Thailand. Eng. Technol. Int. J. Environ. Ecol. Eng. 2011, 5, 567-70. https://www.researchgate.net/publication/304749329_Climate_change_effect_from_black_carbon_emission_Open_burning_of_corn_residues_inThailand. (accessed 2026-05-06).
39. Sornpoon, W.; Bonnet, S.; Kasemsap, P.; Prasertsak, P.; Garivait, S. Estimation of emissions from sugarcane field burning in Thailand using bottom-up country-specific activity data. Atmosphere 2014, 5, 669-85.
40. Patel, A. B.; Shaikh, S.; Jain, K. R.; Desai, C.; Madamwar, D. Polycyclic aromatic hydrocarbons: sources, toxicity, and remediation approaches. Front. Microbiol. 2020, 11, 562813.
41. Montano, L.; Baldini, G. M.; Piscopo, M.; et al. Polycyclic aromatic hydrocarbons (PAHs) in the environment: occupational exposure, health risks and fertility implications. Toxics 2025, 13, 151.
42. International Agency for Research on Cancer. Some non-heterocyclic polycyclic aromatic hydrocarbons and some related exposures. IARC monographs on the evaluation of carcinogenic risks to humans, Volume 92. 2010. https://publications.iarc.who.int/Book-And-Report-Series/Iarc-Monographs-On-The-Identification-Of-Carcinogenic-Hazards-To-Humans/Some-Non-heterocyclic-Polycyclic-Aromatic-Hydrocarbons-And-Some-Related-Exposures-2010. (accessed 2026-05-06).
43. International Agency for Research on Cancer. Chemical agents and related occupations. IARC monographs on the evaluation of carcinogenic risks to humans, Volume 100F. 2012. https://publications.iarc.who.int/Book-And-Report-Series/Iarc-Monographs-On-The-Identification-Of-Carcinogenic-Hazards-To-Humans/Chemical-Agents-And-Related-Occupations-2012. (accessed 2026-05-06).
44. Jameson, C. W. Polycyclic aromatic hydrocarbons and associated occupational exposures. In Tumour site concordance and mechanisms of carcinogenesis; Baan, R. A.; Straif, K.; Stewart, B. W., Eds.; International Agency for Research on Cancer: Lyon, France, 2019.
45. Hellén, H.; Kangas, L.; Kousa, A.; et al. Evaluation of the impact of wood combustion on benzo[a]pyrene (BaP) concentrations; ambient measurements and dispersion modeling in Helsinki, Finland. Atmos. Chem. Phys. 2017, 17, 3475-87.
46. Bukowska, B.; Mokra, K.; Michałowicz, J. Benzo[a]pyrene-environmental occurrence, human exposure, and mechanisms of toxicity. Int. J. Mol. Sci. 2022, 23, 6348.
47. Insian, W.; Yabueng, N.; Wiriya, W.; Chantara, S. Size-fractionated PM-bound PAHs in urban and rural atmospheres of northern Thailand for respiratory health risk assessment. Environ. Pollut. 2022, 293, 118488.
48. Bukowska, B.; Duchnowicz, P. Molecular mechanisms of action of selected substances involved in the reduction of benzo[a]pyrene-induced oxidative stress. Molecules 2022, 27, 1379.
49. Lewandowska, A. U.; Staniszewska, M.; Witkowska, A.; Machuta, M.; Falkowska, L. Benzo(a)pyrene parallel measurements in PM1 and PM2.5 in the coastal zone of the Gulf of Gdansk (Baltic Sea) in the heating and non-heating seasons. Environ. Sci. Pollut. Res. Int. 2018, 25, 19458-69.
50. Liu, K.; Hua, S.; Song, L. PM2.5 exposure and asthma development: the key role of oxidative stress. Oxid. Med. Cell. Longev. 2022, 2022, 3618806.
51. Virapongse, A. Smallholders and forest landscape restoration in upland Northern Thailand. Int. Forest. Rev. 2017, 19, 102-19.
52. Amnuaylojaroen, T.; Chanvichit, P.; Janta, R.; Surapipith, V. Projection of rice and maize productions in Northern Thailand under climate change scenario RCP8.5. Agriculture 2021, 11, 23.
53. Eilittä, M.; Mureithi, J.; Derpsch, R. Green manure/cover crop systems of smallholder farmers: experiences from tropical and subtropical regions. 1st edition. Springer: Dordrecht, Netherlands, 2004.
54. Junpen, A.; Pansuk, J.; Kamnoet, O.; Cheewaphongphan, P.; Garivait, S. Emission of air pollutants from rice residue open burning in Thailand, 2018. Atmosphere 2018, 9, 449.
55. Khongdee, N.; Tongkoom, K.; Iamsaard, K.; et al. Closing yield gap of maize in Southeast Asia by intercropping systems: a review. Aust. J. Crop. Sci. 2022, 16, 1224-33.
56. Makowski, D. Simple random forest classification algorithms for predicting occurrences and sizes of wildfires. Extremes 2023, 26, 331-8.
57. Roteta, E.; Oliva, P. Optimization of a random forest classifier for burned area detection in Chile using Sentinel-2 data. In 2020 IEEE Latin American GRSS & ISPRS Remote Sensing Conference (LAGIRS), Santiago, Chile. Marche 22-26, 2020. IEEE; 2020. pp. 568-73.
58. Weerakul, C.; Charoenpanyanet, A. Developing models to predict areas at risk of burned areas in forests from an effect of the ENSO phenomenon using space technology data in Sam Ngao District, Tak Province. Burapha. Sci. J. 2024, 29, 618-46. https://li05.tci-thaijo.org/index.php/buuscij/article/view/431. (accessed 2026-05-06).
59. Samphutthanont, R. Assessing agricultural burned areas using dNBR index from Sentinel-2 satellite data in Chiang Mai, Thailand. Geogr. Technica. 2024, 19, 46-56.
60. Sawetsuthipan, T.; Wongchaisuwat, P. Forecasting burned areas of wildfires: a case study of Mae Hong Son Province in Thailand. In 2023 4th International Conference on Computers and Artificial Intelligence Technology (CAIT), Macau, Macao. December 13-15, 2023. IEEE; 2023. pp. 52-6.
61. Giddey, B. L.; Baard, J. A.; Kraaij, T. Verification of the differenced Normalised Burn Ratio (dNBR) as an index of fire severity in Afrotemperate Forest. S. Afr. J. Bot. 2022, 146, 348-53.
62. Holden, Z. A.; Evans, J. S. Using fuzzy C-means and local autocorrelation to cluster satellite-inferred burn severity classes. Int. J. Wildland. Fire. 2010, 19, 853-60.
63. Xing, Y. F.; Xu, Y. H.; Shi, M. H.; Lian, Y. X. The impact of PM2.5 on the human respiratory system. J. Thorac. Dis. 2016, 8, E69-74.
64. Arca-Lafuente, S.; Nuñez-Corcuera, B.; Ramis, R.; et al. Effects of urban airborne particulate matter exposure on the human upper respiratory tract microbiome: a systematic review. Respir. Res. 2025, 26, 118.
65. Batista, J. M.; Valenzuela, E. F.; Menezes, H. C.; Cardeal, Z. L. An exploratory study of volatile and semi-volatile organic compounds in PM2.5 atmospheric particles from an outdoor environment in Brazil. Environ. Sci. Pollut. Res. Int. 2025, 32, 657-76.
66. Kwon, H. S.; Ryu, M. H.; Carlsten, C. Ultrafine particles: unique physicochemical properties relevant to health and disease. Exp. Mol. Med. 2020, 52, 318-28.
67. Shen, G.; Tao, S.; Chen, Y.; et al. Emission characteristics for polycyclic aromatic hydrocarbons from solid fuels burned in domestic stoves in rural China. Environ. Sci. Technol. 2013, 47, 14485-94.
68. Zhang, L.; Guo, X.; Zhao, T.; et al. Effect of large topography on atmospheric environment in Sichuan Basin: a climate analysis based on changes in atmospheric visibility. Front. Earth. Sci. 2022, 10, 997586.
69. Syed, J. H.; Iqbal, M.; Zhong, G.; et al. Polycyclic aromatic hydrocarbons (PAHs) in Chinese forest soils: profile composition, spatial variations and source apportionment. Sci. Rep. 2017, 7, 2692.
70. Zosima, A. T.; Tzimou-Tsitouridou, R. D.; Nikolaki, S.; Zikopoulos, D.; Ochsenkühn-Petropoulou, M. T. PM10 emissions and PAHs: the importance of biomass type and combustion conditions. J. Environ. Sci. Health. A. Tox. Hazard. Subst. Environ. Eng. 2016, 51, 341-7.
71. Li, X.; Wang, Z.; Guo, T. Emission of PM2.5-bound polycyclic aromatic hydrocarbons from biomass and coal combustion in China. Atmosphere 2021, 12, 1129.
72. Chiu, J. C.; Shen, Y. H.; Li, H. W.; Chang, S. S.; Wang, L. C.; Chang-Chien, G. P. Effect of biomass open burning on particulate matter and polycyclic aromatic hydrocarbon concentration levels and PAH dry deposition in ambient air. J. Environ. Sci. Health. A. Tox. Hazard. Subst. Environ. Eng. 2011, 46, 188-97.
73. Zhang, H.; Zhang, X.; Wang, Y.; et al. Characteristics and influencing factors of polycyclic aromatic hydrocarbons emitted from open burning and stove burning of biomass: a brief review. Int. J. Environ. Res. Public. Health. 2022, 19, 3944.
74. Zhao, X.; Yang, F.; Li, Z.; Tan, H. Formation and emission characteristics of PAHs during pyrolysis and combustion of coal and biomass. Fuel 2024, 378, 132935.
75. Amnuaylojaroen, T.; Inkom, J.; Janta, R.; Surapipith, V. Long range transport of Southeast Asian PM2.5 pollution to Northern Thailand during high biomass burning episodes. Sustainability 2020, 12, 10049.
76. Pongpiachan, S.; Hattayanone, M.; Cao, J. Effect of agricultural waste burning season on PM2.5-bound polycyclic aromatic hydrocarbon (PAH) levels in Northern Thailand. Atmos. Poll. Res. 2017, 8, 1069-80.
77. Amnuaylojaroen, T.; Kaewkanchanawong, P.; Panpeng, P. Distribution and meteorological control of PM2.5 and its effect on visibility in Northern Thailand. Atmosphere 2023, 14, 538.
Cite This Article
How to Cite
Download Citation
Export Citation File:
Type of Import
Tips on Downloading Citation
Citation Manager File Format
Type of Import
Direct Import: When the Direct Import option is selected (the default state), a dialogue box will give you the option to Save or Open the downloaded citation data. Choosing Open will either launch your citation manager or give you a choice of applications with which to use the metadata. The Save option saves the file locally for later use.
Indirect Import: When the Indirect Import option is selected, the metadata is displayed and may be copied and pasted as needed.
About This Article
Copyright

Data & Comments
Data
0


Comments
Comments must be written in English. Spam, offensive content, impersonation, and private information will not be permitted. If any comment is reported and identified as inappropriate content by OAE staff, the comment will be removed without notice. If you have any queries or need any help, please contact us at support@oaepublish.com.