


The effects of glycated hemoglobin and body mass index on the relationship between the hemoglobin glycation index and the hypoglycemia risk: a moderated mediation analysis
 0
0 Abstract
Aim: To explore the relationship between the hemoglobin glycation index (HGI) and the hypoglycemia risk, and the potential effect of glycosylated hemoglobin (HbA1c) and body mass index (BMI) on this relationship.
Methods: This is a prospective observational study. A total of 1,203 type 2 diabetes mellitus (T2DM) patients were included. Linear regression was used to establish an equation for calculating the HGI. Logistic regression models were employed to explore the association between the HGI and hypoglycemia. A moderated mediation approach was taken to detect the effect of BMI and HbA1c on the association between HGI and hypoglycemia.
Results: During the follow-up period (median 34.73 months), 344 patients developed hypoglycemia. The relationship between the HGI and hypoglycemia was significant [odds ratio (OR), 95% confidence interval (CI): 1.255 (1.089-1.446), P = 0.001] after adjusting for potential confounders. Compared to the low-HGI group, the risk of hypoglycemia in the high-HGI group was significantly elevated [OR (95%CI) = 1.603 (1.167-2.201), P = 0.006]. Trend tests suggested that the risk of hypoglycemia increased significantly from the low- to the high-HGI groups (P = 0.003). A significant mediation effect of HbA1c was observed along the path HGI → Hypoglycemia (coefficient = 0.128, 95%CI: 0.140-0.247, P = 0.008) and a significant moderation effect of BMI was observed along the path HGI → HGI*BMI → HbA1c (coefficient = 0.019, 95%CI: 0.004-0.040, P = 0.022), suggesting that HbA1c served as a mediator and BMI as a moderator of the relationship between the HGI and hypoglycemia.
Conclusion: The HGI was significantly associated with the risk of hypoglycemia in T2DM subjects. Moderated mediation analysis demonstrated that the association between the HGI and hypoglycemia was mediated by HbA1c and moderated by BMI. Interventions targeting HbA1c and BMI may mitigate the risk of hypoglycemia in T2DM patients.
Keywords
INTRODUCTION
Hypoglycemia is a serious acute complication of diabetes[1]. In type 2 diabetes mellitus (T2DM) patients receiving intensive hypoglycemic treatments, hypoglycemia is more common and the symptoms more serious than in other patients[2]. Hypoglycemia not only renders it difficult to control the blood glucose level but is also closely related to diabetic vascular complications. Glycosylated hemoglobin (HbA1c) is an indicator of blood glucose metabolism. However, only about 60%-80% of the variation in HbA1c levels can be explained by the mean blood glucose level[3]. The hemoglobin glycation index (HGI) has emerged as a metric to capture interindividual variation in HbA1c beyond mean glucose levels, reflecting differences in hemoglobin glycation propensity[4,5]. Previous large-scale studies, including ACCORD, ADVANCE, and AleCardio, have linked HGI to both microvascular and macrovascular complications, as well as hypoglycemia risk[6,7]. However, these studies often did not evaluate potential intermediating or moderating metabolic factors in the HGI-hypoglycemia pathway. In particular, insulin resistance - commonly estimated by the homeostatic model assessment for insulin resistance (HOMA-IR) - may influence both HbA1c levels and hypoglycemia susceptibility[8,9], yet few studies have considered its potential confounding or mediating role. In addition, anthropometric indices such as body mass index (BMI) may interact with HGI through their impact on glucose-insulin dynamics, further modifying hypoglycemia risk. Addressing these gaps may improve individualized hypoglycemia risk prediction and inform targeted interventions.
METHODS
Study population
The study design has been described previously[10]. In 2010, Ning et al. initiated a longitudinal, prospective cohort study in China - the Risk Evaluation of Cancers in Chinese Diabetic Individuals (REACTION) study - to investigate relationships between cancer, diabetes, and diabetes-related risk factors[10]. A total of 1,837 T2DM patients from eight Beijing communities (Lugu, Babaoshan, Laoshan, Bajiao, Gucheng, Pingguoyuan, Jinding, and Guangning) were recruited. After excluding 192 individuals with a history of severe hypoglycemia, 1,645 remained under observation until 2011. Subsequently, 265 participants with missing data and 177 lost to follow-up were excluded, leaving 1,203 individuals for the final analysis in 2015 [Figure 1]. All participants provided written informed consent, and the study was approved by the Ethics Committee of Rui Jin Hospital, Shanghai Jiao Tong University School of Medicine. The trial was registered at ClinicalTrials.gov (NCT01506869).
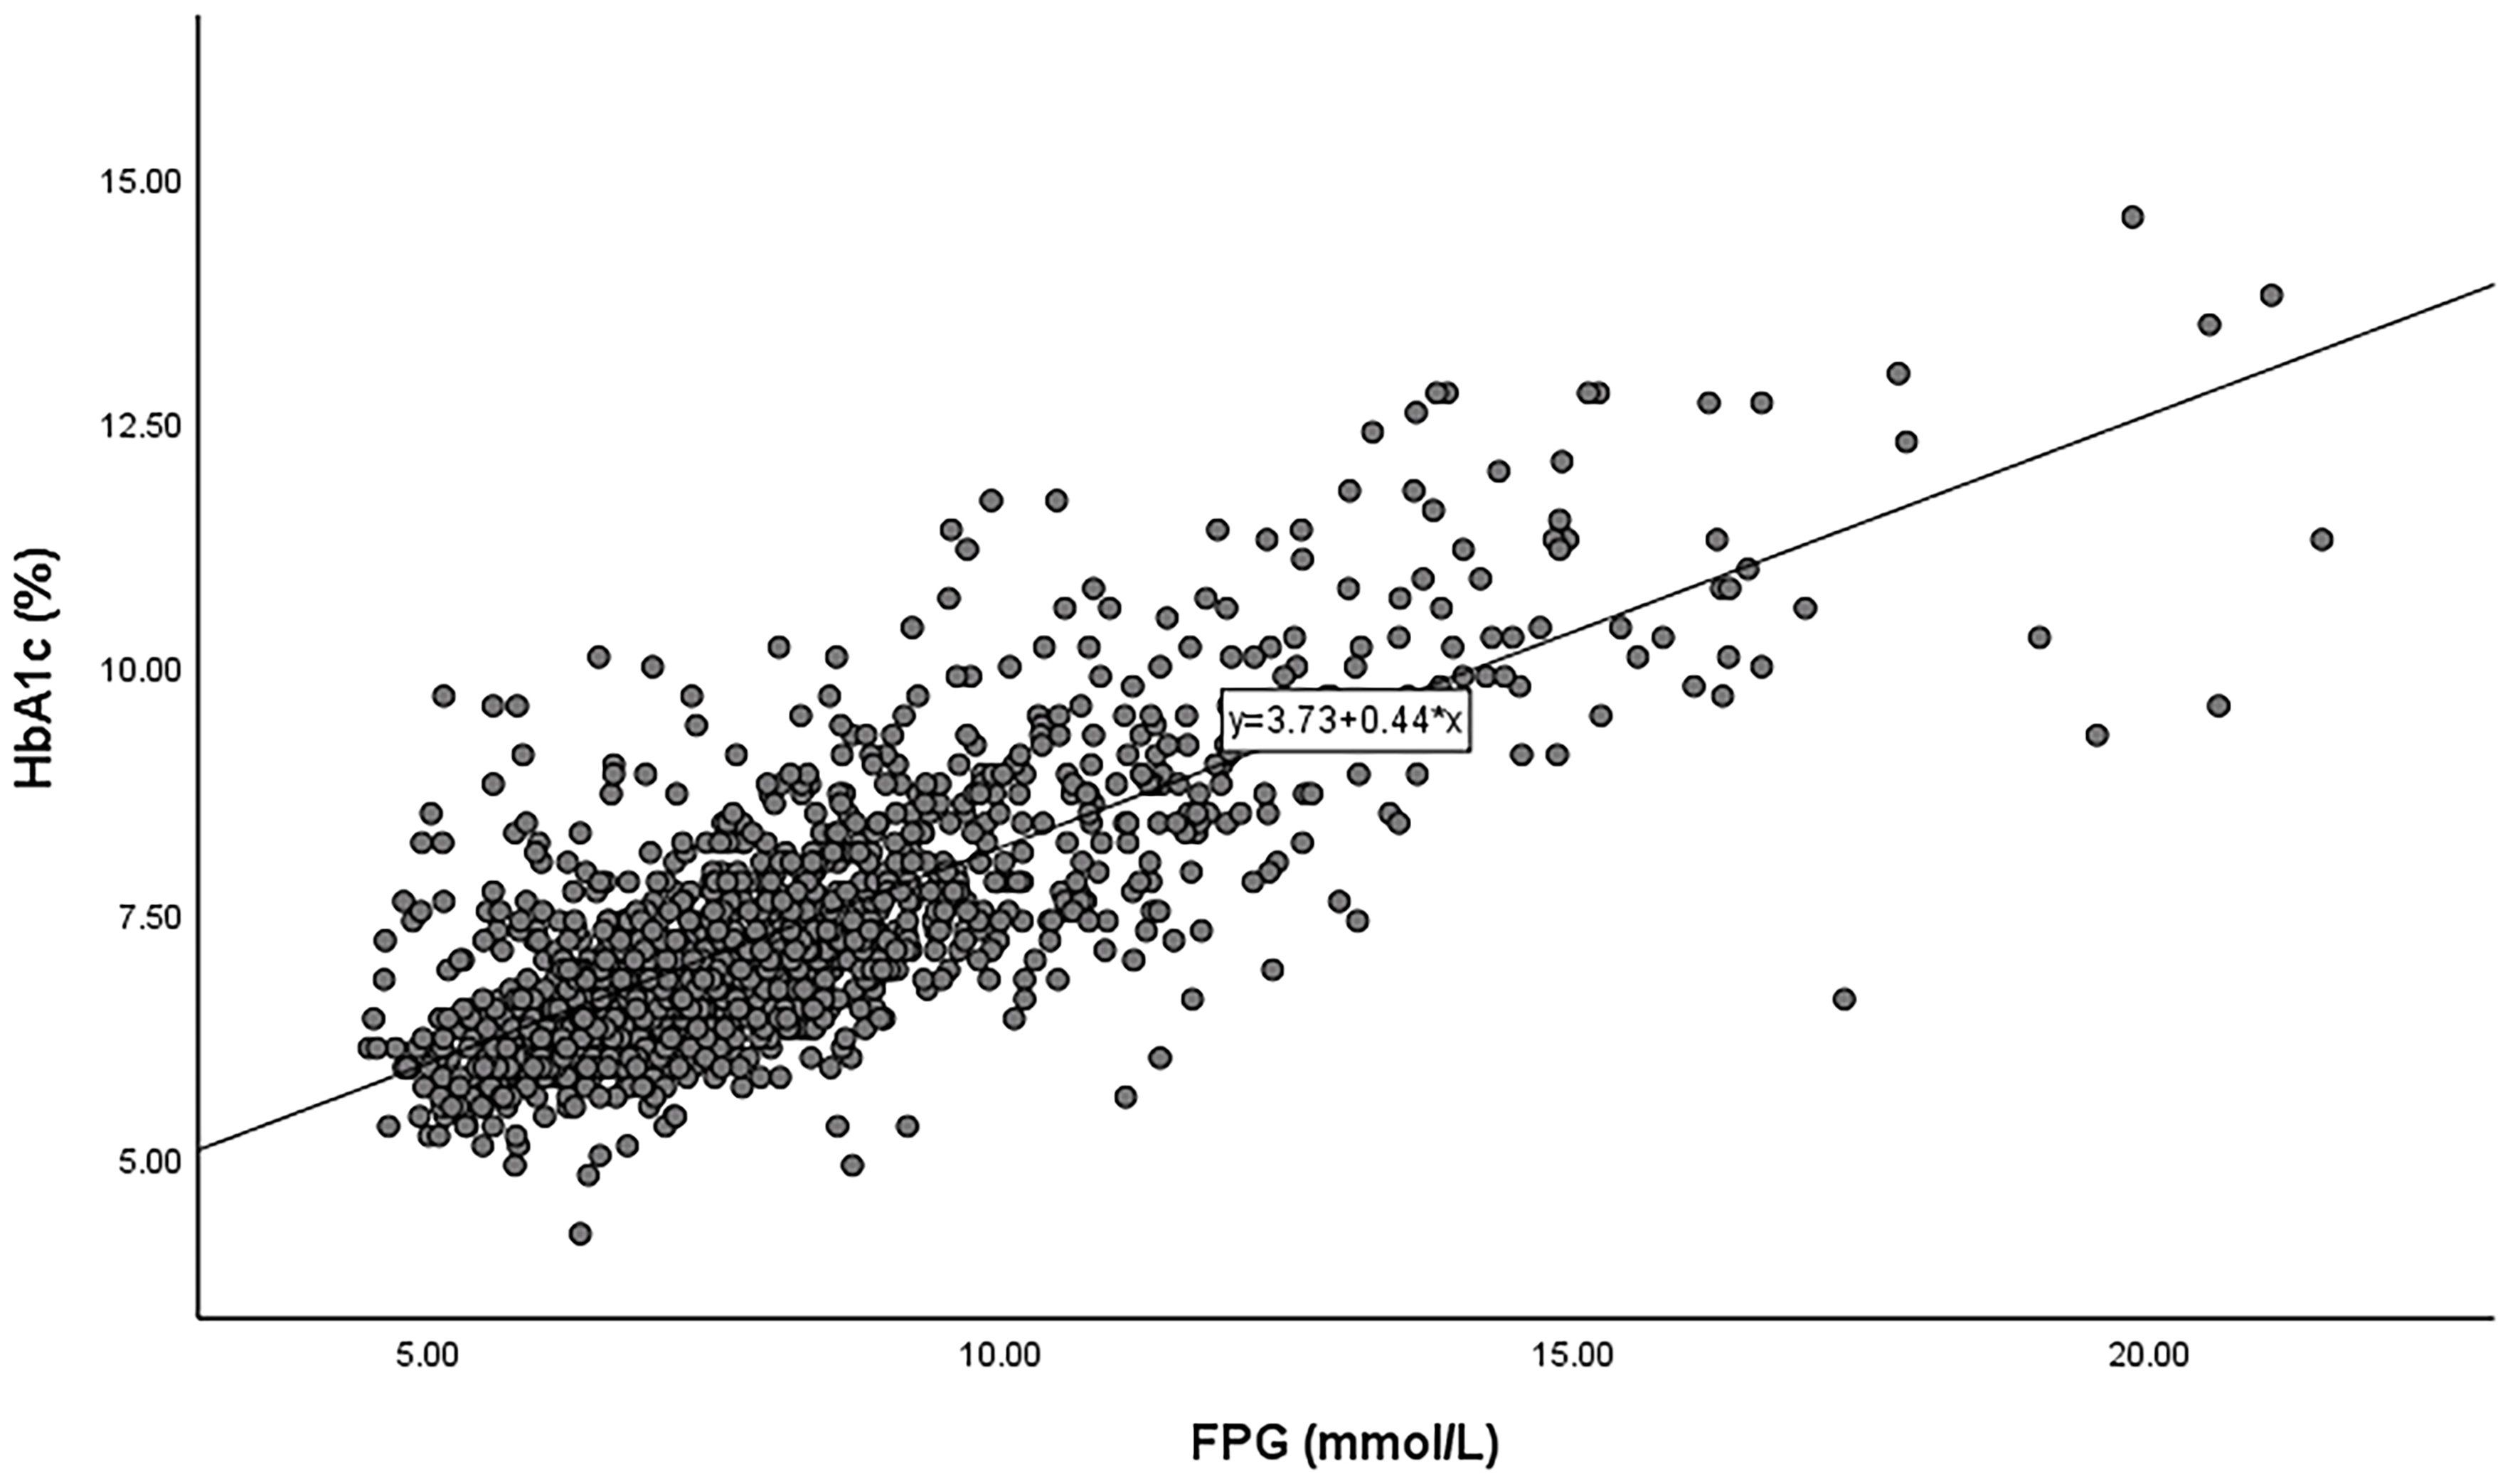
Figure 1. The HGI equation derived via linear regression. Predicted HbA1c level = 0.44 × FBG (mmol/L) + 3.73. The line represents the linear regression. HGI: Hemoglobin glycation index; FBG: fasting blood glucose; HbA1c: glycated hemoglobin.
Questionnaires
All participants completed standardized questionnaires assessing disease history and antidiabetic treatments:
(1) T2DM: Defined as a self-reported history of T2DM, fasting blood glucose (FBG)≥ 7.0 mmol/L, 2-h postprandial glucose (2hPG) ≥ 11.1 mmol/L, or HbA1c ≥ 6.5%[11].
(2) T2DM treatment: Intensive treatment was defined as either short-acting insulin (before meals) combined with long-acting insulin (before sleep) or use of an insulin pump. The use of diet and/or exercise alone was also recorded. Oral antidiabetic drugs included sulfonylureas, metformin, and acarbose.
(3) Hyperlipemia: Defined as serum total cholesterol (TC) > 5.17 mmol/L or triglycerides (TGs) > 2.3 mmol/L[12].
(4) Coronary heart disease (CHD): Diagnosed based on typical symptoms, imaging, electrocardiography, and biochemical markers of myocardial damage[13].
(5) Hypertension: Defined as systolic blood pressure ≥ 140 mmHg and/or diastolic blood pressure (DBP) ≥ 90 mmHg, or a self-reported history of hypertension[14].
(6) Nonalcoholic fatty liver disease (NAFLD): Diagnosed based on serum biomarkers and ultrasonography.
(7) Family history of T2DM: Positive if an immediate family member had been diagnosed with T2DM.
(8) Smoking history: Defined as smoking at least one cigarette daily for ≥ 6 months.
(9) Alcohol consumption: Defined as an average intake ≥ 50 g/day.
Measurements
Height, weight, BMI, and blood pressure were measured. Height was recorded barefoot to the nearest
HGI
The linear regression model for predicting HbA1c included FBG as the sole independent variable, consistent with the definition by Hempe et al.[6]. Other variables were not incorporated, and erythrocyte turnover-related indicators (e.g., ferritin, erythropoietin, reticulocyte count) were unavailable in our dataset.
Baseline FBG and HbA1c were used to establish their linear correlation [Figure 2]. A scatterplot was drawn with FBG on the x-axis and HbA1c on the y-axis. Linear regression yielded the following equation: predicted HbA1c = 0.44 × FBG (mmol/L) + 3.73 (R2 = 0.60; P < 0.001). The HGI for each subject was calculated as: HGI = observed HbA1c - predicted HbA1c[14].
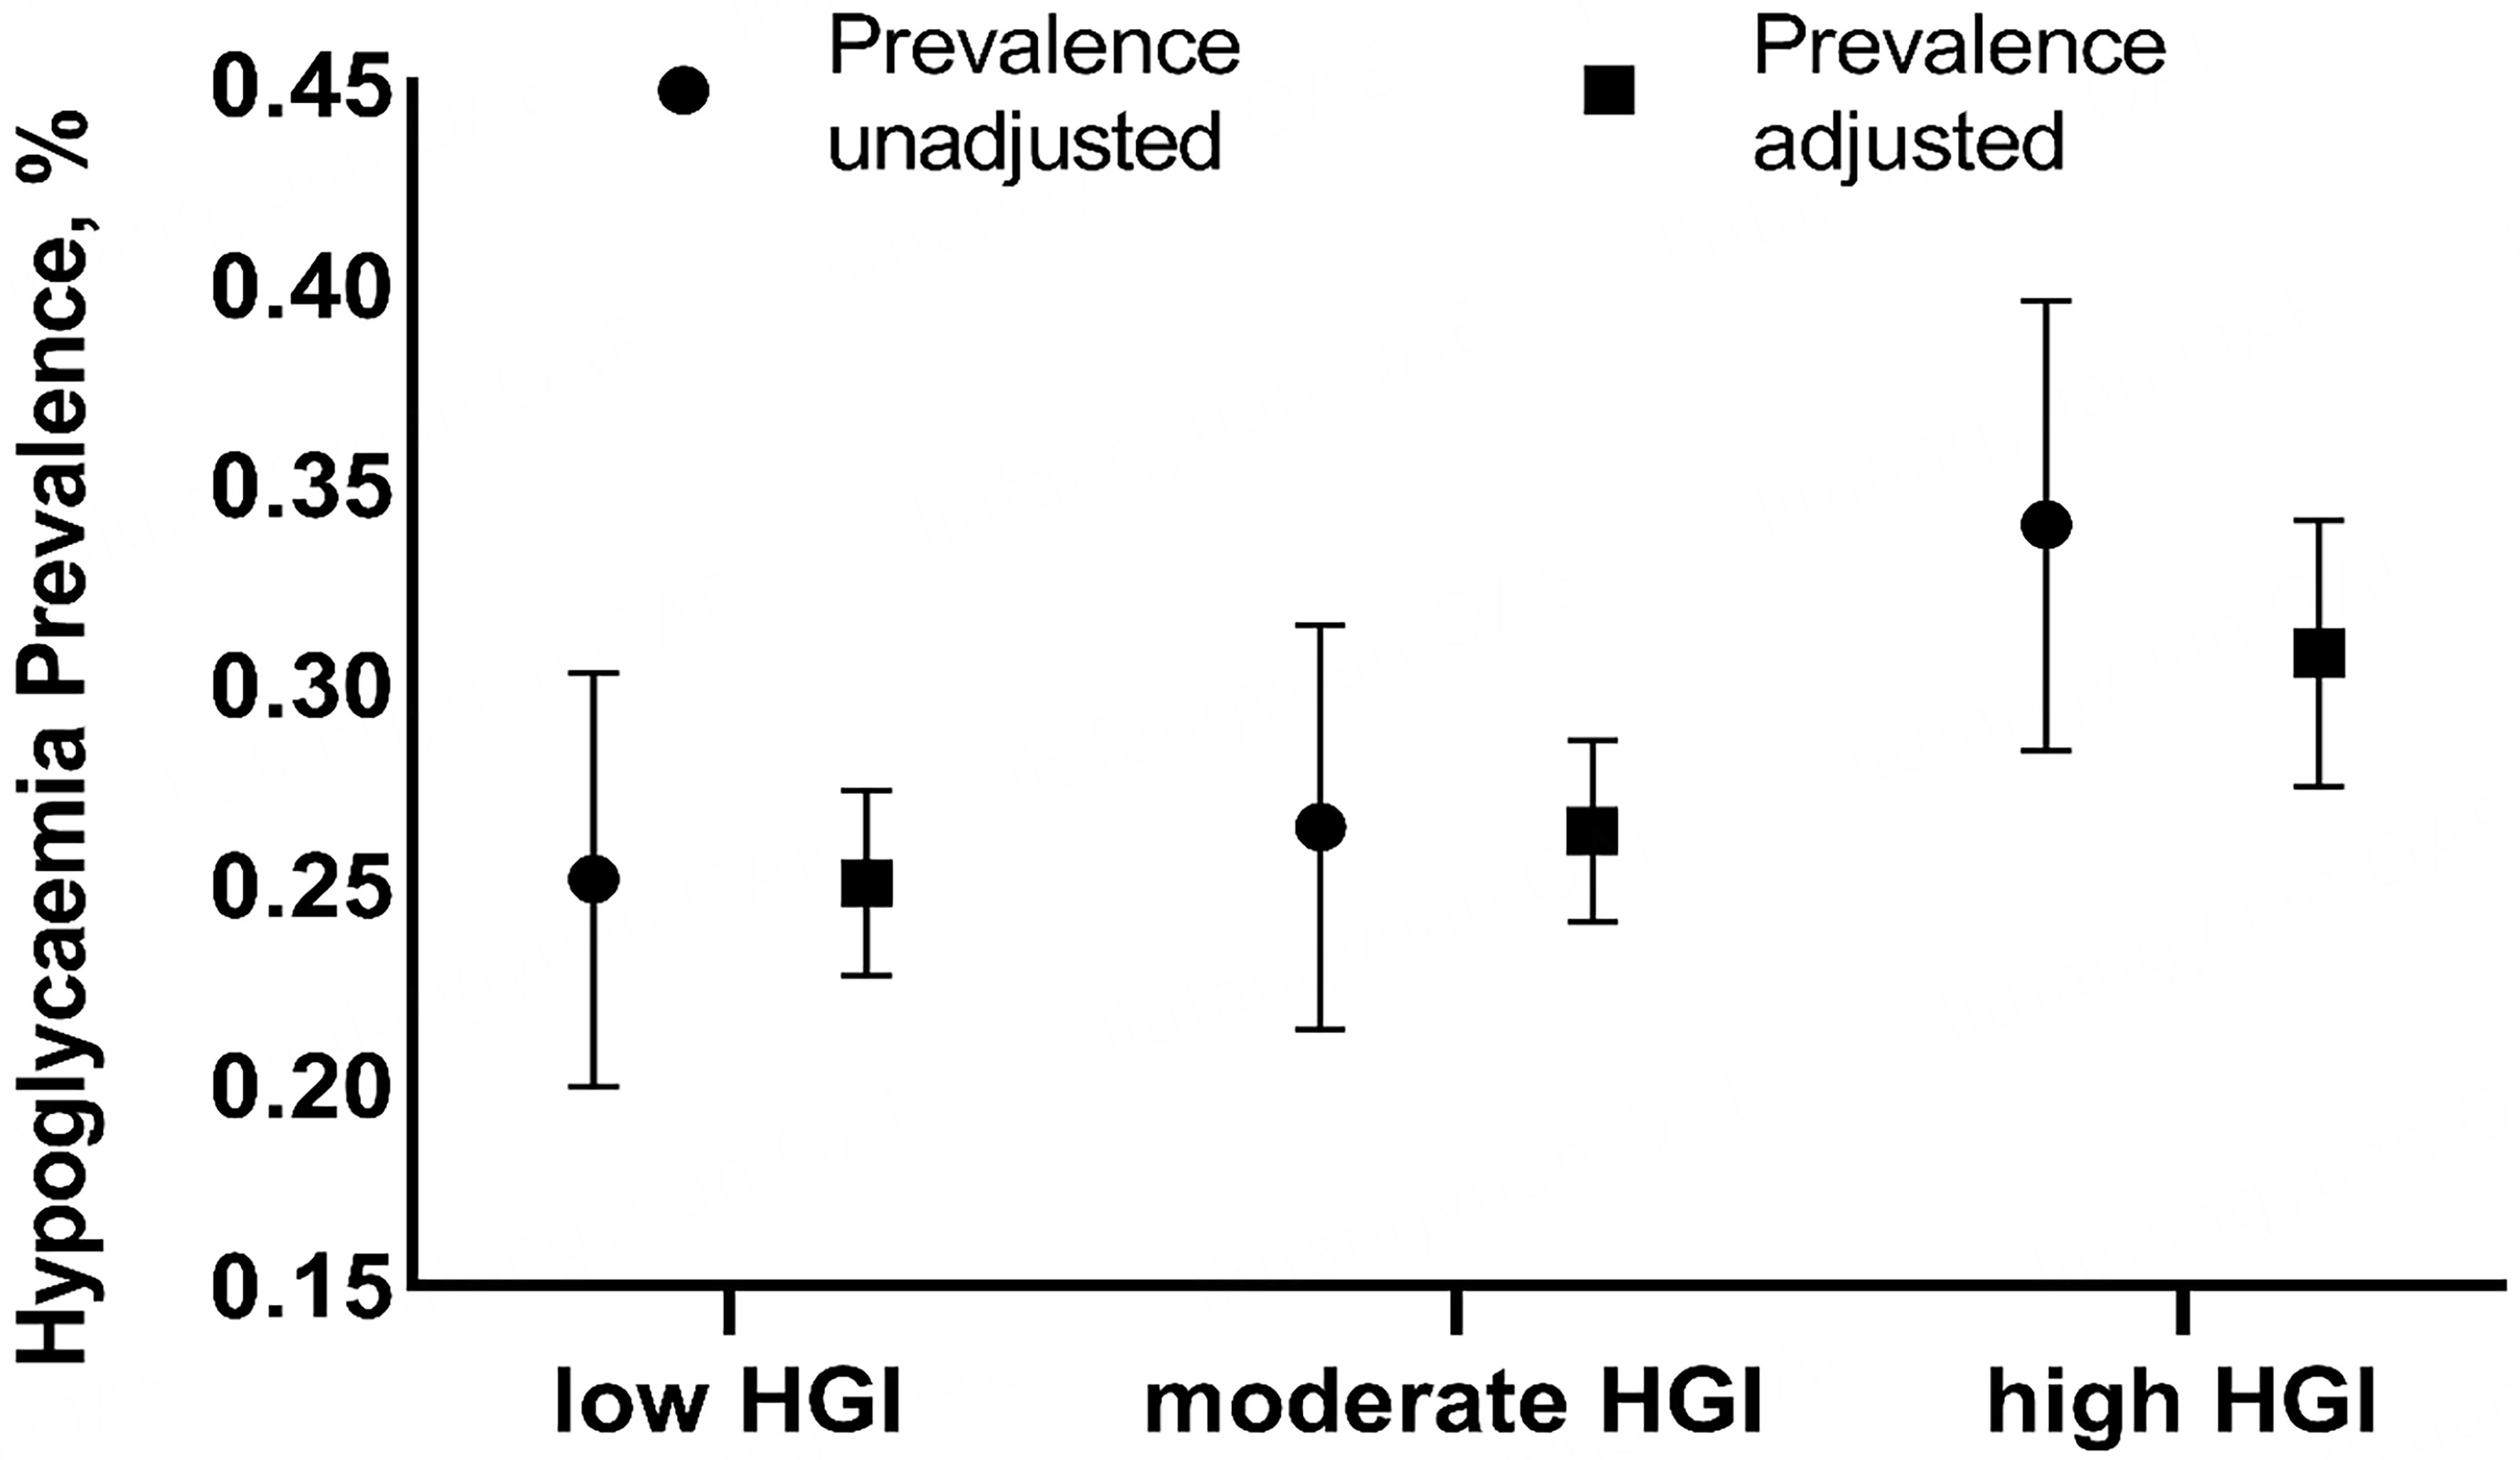
Figure 2. Unadjusted and adjusted prevalence of hypoglycemia. HGI: Hemoglobin glycation index.
Adjusted for Age, sex, Dyslipidemia, Hypertension, family history of T2DM, NAFLD, alanine aminotransferase (ALT), aspartate aminotransferase (AST), gamma-glutamyl transferase (GGT), TC, LDL-C, DBP, and T2DM duration.
Outcome
The primary outcome was the first occurrence of hypoglycemia during follow-up. Hypoglycemia was defined as self-monitored blood glucose ≤ 3.9 mmol/L accompanied by symptoms requiring medical care or assistance from others. Symptoms included:
(1) Autonomic symptoms: Hunger, fatigue, paleness, anxiety, tremor, tachycardia.
(2) Central nervous system symptoms: Sweating, dizziness, blurred vision, impaired consciousness.
Statistical analysis
Continuous variables were presented as means ± SDs or medians with interquartile ranges (25th-75th percentiles). Between-group comparisons were performed using the Student’s t-test or one-way ANOVA for normally distributed variables, and the Mann-Whitney U test or Kruskal-Wallis test otherwise. Categorical variables were expressed as frequencies (percentages) and compared using the chi-squared test. Binary logistic regression was used to assess associations between HGI and hypoglycemia. The multivariate model was adjusted for age, sex, hyperlipemia, hypertension, family history of T2DM, NAFLD, ALT, AST, GGT, TC, LDL-C, DBP, and T2DM duration (Model 1). The fully adjusted model additionally included TG, creatinine, systolic blood pressure (SBP), CAD history, pulse, tumor history, smoking, and alcohol consumption (Model 2). A moderated mediation analysis was performed to test whether the association between HGI and hypoglycemia was mediated by HbA1c and moderated by BMI. This analysis was specified using two regression equations: (1) HbA1c = β1 × HGI + β2 × BMI + β3×(HGI*BMI) + ε1; (2) Hypoglycemia = β4 × HGI + β5 × HbA1c + ε2. If moderation was significant, a simple slope analysis was conducted to analyze the HGI-hyperglycemia association at different BMI levels (Mean - 1 SD, Mean, Mean + 1 SD)[15]. All continuous variables were mean-centered prior to analysis. The moderated mediation analysis was performed using PROCESS v4.0 (Model 7) in SPSS v26.0 (IBM Corp., Armonk, NY, USA). A two-sided P < 0.05 was considered statistically significant.
RESULTS
For the descriptive analysis of baseline characteristics, HGI values were initially divided into quintiles to enable a more detailed comparison of demographic and clinical variables. For the analysis of hypoglycemia risk, tertiles (low, moderate, high HGI) were used to ensure adequate event counts per group and to facilitate interpretation of risk estimates. This approach was chosen a priori to balance statistical power with clinical interpretability.
Baseline characteristics
A total of 1,203 patients with T2DM were included in the analysis. The median follow-up duration was 34.73 months. During this period, 344 patients developed hypoglycemia. Based on HGI values, patients were divided into three groups: low-HGI, moderate-HGI, and high-HGI. Baseline characteristics - including BMI, duration of T2DM, FBG and 2hPG, HbA1c, GGT, creatinine, HDL-C, SBP, pulse, intensive treatment, sulfonylurea and insulin use, and alcohol consumption - differed significantly across groups [Table 1]. Figure 1 shows that the prevalence of hypoglycemia increased progressively from the low- to the high-HGI group. After adjusting for age, sex, hyperlipemia, hypertension, family history of T2DM, NAFLD, ALT, AST, GGT, TC, LDL-C levels, DBP, and duration of T2DM, the prevalence of hypoglycemia was 25.03% [95% confidence interval (CI) 22.73%-27.33%] in the low-HGI group, 26.34% (24.08%-28.61%) in the moderate-HGI group, and 30.78% (27.46%-34.10%) in the high-HGI group.
Baseline characteristics by HGI category
| Low HGI N = 394 | Moderate HGI N = 397 | High HGI N = 412 | P | |
| HGI | -0.13 (0.46) | 0.61 (0.17) | 1.68 (0.73) | < 0.001 |
| Female sex (%) | 215 (54.56) | 209 (52.64) | 243 (58.98) | 0.092 |
| Age (years) | 70.38 (8.17) | 70.77 (7.68) | 70.69 (8.18) | 0.772 |
| Weight (kg) | 66.61 (11.24) | 67.85 (10.83) | 66.96 (10.05) | 0.246 |
| BMI (kg/m2) | 25.21 (3.48) | 25.73 (3.36) | 25.78 (3.63) | 0.030 |
| Duration of T2DM (years) | 18.58 (7.12) | 17.68 (7.01) | 19.68 (7.33) | < 0.001 |
| FBG (mmol/L) | 8.30 (2.50) | 7.79 (2.07) | 8.59 (2.77) | < 0.001 |
| 2hPG (mmol/L) | 12.74 (4.27) | 12.49 (3.91) | 14.61 (4.47) | < 0.001 |
| HbA1c (%) | 6.56 (0.98) | 7.07 (0.91) | 8.49 (1.51) | < 0.001 |
| Predicted HbA1c (%) | 6.68 (1.08) | 6.47 (0.89) | 6.81 (1.20) | < 0.001 |
| ALT (mmol/L) | 20.48 (10.52) | 20.48 (10.52) | 22.12 (12.37) | 0.082 |
| AST (mmol/L) | 19.19 (6.39) | 19.96 (6.44) | 23.66 (78.99) | 0.337 |
| GGT (mmol/L) | 25.21 (16.56) | 28.45 (21.82) | 29.96 (28.57) | 0.010 |
| Creatinine (mmol/L) | 68.28 (16.58) | 68.79 (16.84) | 65.67 (15.41) | 0.014 |
| Total cholesterol (mmol/L) | 4.99 (1.00) | 5.05 (1.06) | 5.08 (1.11) | 0.456 |
| Triglycerides (mmol/L) | 1.59 (1.12) | 1.75 (1.65) | 1.71 (1.20) | 0.188 |
| HDL-C (mmol/L) | 1.37 (0.35) | 1.35 (0.36) | 1.30 (0.32) | 0.011 |
| LDL-C (mmol/L) | 3.02 (0.85) | 3.04 (0.86) | 3.12 (0.87) | 0.225 |
| SBP (mmHg) | 132.31 (16.07) | 132.62 (17.45) | 135.05 (17.67) | 0.044 |
| DBP (mmHg) | 73.65 (9.57) | 74.19 (9.90) | 73.20 (10.66) | 0.383 |
| Pulse | 79.90 (12.57) | 77.64 (11.10) | 78.06 (10.91) | 0.013 |
| Hyperlipemia (%) | 123 (30.1) | 152 (38.9) | 132 (32.4) | 0.024 |
| NAFLD (%) | 94 (23.0) | 106 (27.1) | 97 (23.8) | 0.358 |
| CHD (%) | 75 (18.3) | 72 (18.4) | 90 (22.1) | 0.313 |
| Hypertension (%) | 209 (51.1) | 199 (50.9) | 203 (49.8) | 0.918 |
| Diabetes treatment | ||||
| Intensive therapy (%) | 60 (14.7) | 64 (16.4) | 116 (28.4) | < 0.001 |
| Diet and exercise (%) | 16 (4.06) | 26 (6.54) | 17 (4.12) | 0.142 |
| Oral hypoglycemic drugs (%) | 300 (76.14) | 298 (75.06) | 290 (70.38) | 0.258 |
| Sulfonylureas (%) | 86 (21.83) | 53 (13.35) | 47 (11.40) | < 0.001 |
| Metformin (%) | 123 (31.22) | 112 (28.21) | 132 (32.03) | 0.515 |
| Acarbose (%) | 133 (33.76) | 137 (34.50) | 122 (29.61) | 0.301 |
| Insulin (%) | 74 (18.78) | 73 (18.39) | 139 (33.74) | < 0.001 |
| Family history of T2DM (%) | 199 (50.51) | 175 (44.08) | 183 (44.42) | 0.446 |
| Current smoker (%) | 83 (21.07) | 75 (18.89) | 71 (17.23) | 0.568 |
| Alcohol use (%) | 55 (13.96) | 47 (11.84) | 30 (7.28) | 0.014 |
Relationship between HGI and hypoglycemia risk
Table 2 shows the association between HGI and hypoglycemia. When analyzed as a continuous variable, HGI was significantly associated with hypoglycemia [odds ratio (OR) (95%CI) = 1.242 (1.083-1.425), P = 0.005]. The risk of hypoglycemia in the high-HGI group was significantly higher than in the low-HGI group [OR (95%CI) = 1.534 (1.130-2.082), P = 0.006]. After full adjustment for age, sex, hyperlipemia, hypertension, family history of T2DM, NAFLD, ALT, AST, GGT, TC, LDL-C levels, DBP, duration of T2DM, TG and creatinine levels, SBP, CAD history, pulse, tumor history, and smoking and alcohol consumption, the relationship between HGI and hypoglycemia remained significant [OR (95%CI) = 1.255 (1.089-1.446), P = 0.001]. Similarly, the risk of hypoglycemia in the high-HGI group remained greater than that in the low-HGI group [OR (95%CI) = 1.603 (1.167-2.201), P = 0.006]. Trend analyses indicated that the risk of hypoglycemia increased progressively across HGI categories, from low to high, in both Model 1 (P = 0.004) and Model 2 (P = 0.003).
Relationship between HGI and hypoglycemia risk
| Model | Event (n, %) | HGI | OR (95%CI) | P | P for trend |
| Crude | HGI* | 1.242 (1.083-1.425) | 0.002 | ||
| 99 (25.13%) | Low HGI | Ref | Ref | 0.005 | |
| 105 (26.44%) | Moderate HGI | 1.072 (0.779-1.474) | 0.671 | ||
| 140 (33.98%) | High HGI | 1.534 (1.130-2.082) | 0.006 | ||
| Model 1 | HGI* | 1.264 (1.098-1.454) | 0.001 | ||
| 99 (25.13%) | Low HGI | Ref | Ref | 0.004 | |
| 105 (26.44%) | Moderate HGI | 1.086 (0.786-1.499) | 0.618 | ||
| 140 (33.98%) | High HGI | 1.611 (1.177-2.204) | 0.003 | ||
| Model 2 | HGI* | 1.255 (1.089-1.446) | 0.001 | ||
| 99 (25.13%) | Low HGI | Ref | Ref | 0.003 | |
| 105 (26.44%) | Moderate HGI | 1.086 (0.785-1.504) | 0.617 | ||
| 140 (33.98%) | High HGI | 1.603 (1.167-2.201) | 0.002 |
Mediation by HbA1c in the association between HGI and hypoglycemia
Table 3 presents the results of the mediation analysis. The path HGI → HbA1c indicated a significant direct effect of HGI on HbA1c (coefficient = 1.027, 95%CI 0.960-1.093, P < 0.001). The path HbA1c → Hypoglycemia suggested that HbA1c had a significant direct effect on hypoglycemia (coefficient = 0.125, 95%CI: 0.013-0.236, P = 0.020). The indirect path HGI → HbA1c → Hypoglycemia showed a significant mediation effect of HbA1c on the association between HGI and hypoglycemia (coefficient = 0.140, 95%CI: 0.128-0.247, P = 0.008). This indirect effect remained significant after adjusting for all confounding factors in both Model 1 (P = 0.013) and Model 2 (P = 0.015). In contrast, the direct path HGI → Hypoglycemia was non-significant (coefficient = 0.020, 95%CI: 0.157-0.197, P = 0.828), suggesting that the association between HGI and hypoglycemia is fully mediated by HbA1c [Figure 3].
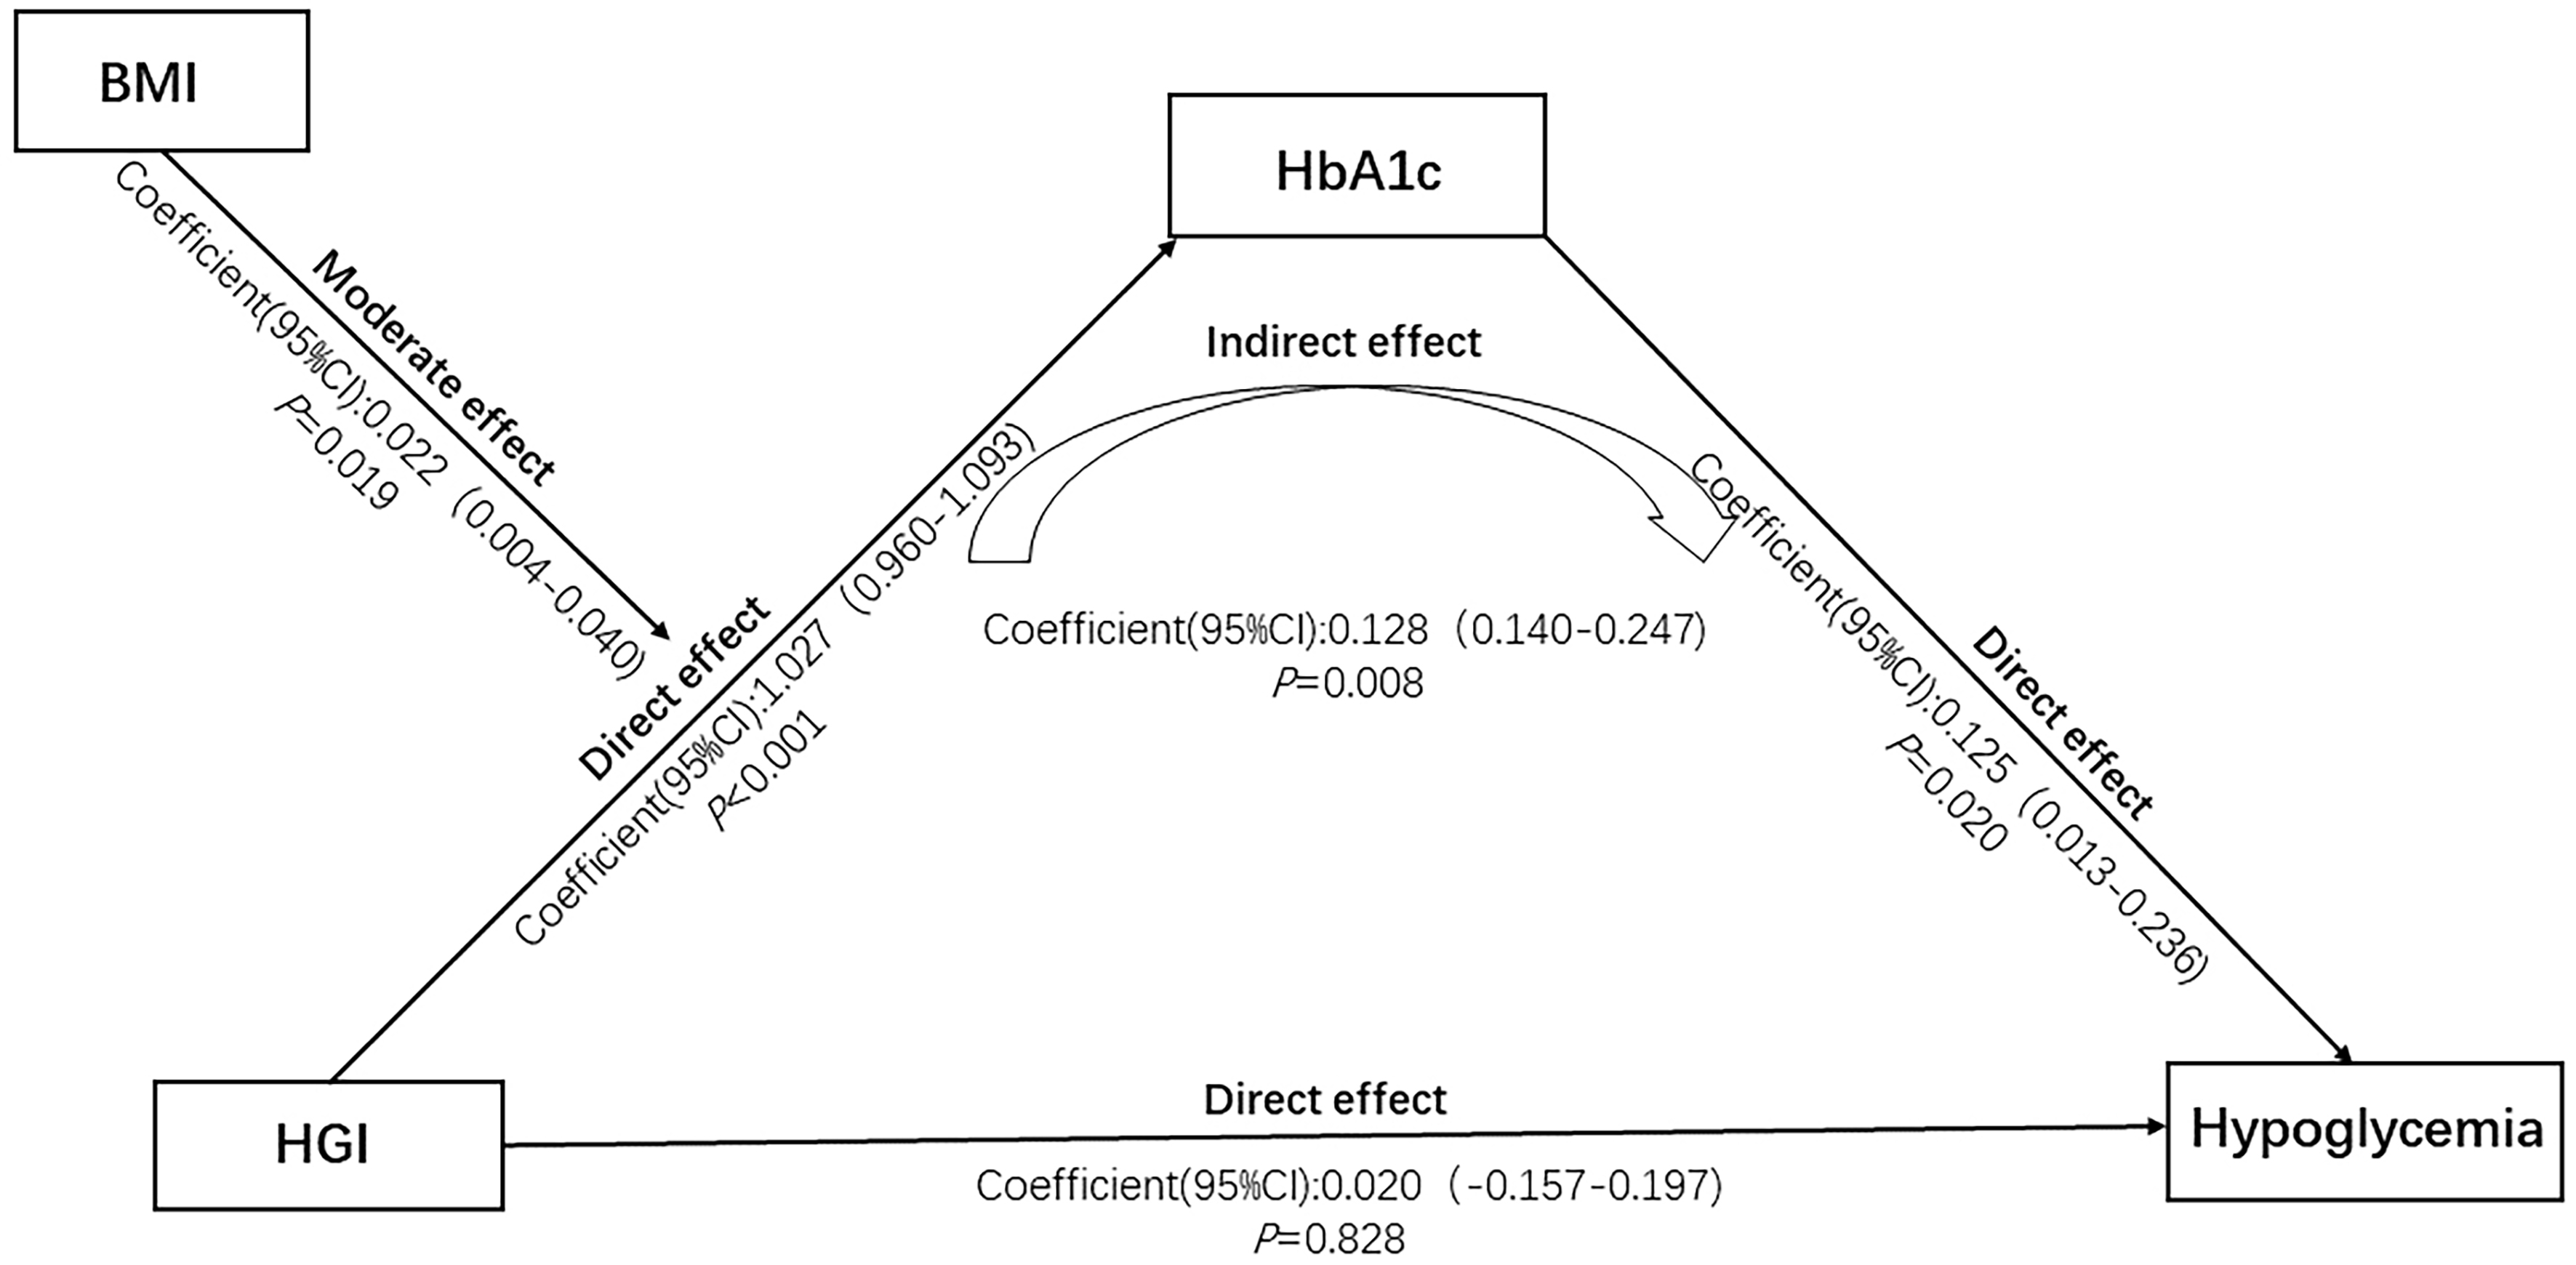
Figure 3. Moderated mediation analysis of the association between HGI and hypoglycemia. HGI: Hemoglobin glycation index; HbA1c: glycated hemoglobin; BMI: body mass index.
Mediation effect of HbA1c on the association between HGI and hypoglycemia
| Path | Crude | Model 1 | Model 2 | ||||||
| OR/Coefficient | 95%CI | P | OR/Coefficient | 95%CI | P | OR/Coefficient | 95%CI | P | |
| HGI → HbA1c | 1.027 | 0.960-1.093 | < 0.001 | 1.027 | 0.960-1.093 | < 0.001 | 1.042 | 0.977-1.11 | < 0.001 |
| HGI → Hypoglycemia | 0.020 | -0.157-0.197 | 0.828 | 0.017 | -0.160-0.195 | 0.847 | 0.031 | -0.153-0.215 | 0.742 |
| HbA1c → Hypoglycemia | 0.125 | 0.013-0.236 | 0.020 | 0.126 | 0.014-0.238 | 0.026 | 0.132 | 0.014-0.249 | 0.028 |
| HGI → HbA1c → Hypoglycemia | 0.140 | 0.128-0.247 | 0.008 | 0.142 | 0.130-0.248 | 0.013 | 0.157 | 0.015-0.265 | 0.015 |
Moderation by BMI in the association between HGI and hypoglycemia
Table 4 shows the moderating effect of BMI on the association between HGI and hypoglycemia. The moderation was significant along the path HGI → HGI × BMI → HbA1c (coefficient = 0.019, 95%CI: 0.004-0.040, P = 0.022). The simple slope analysis showed that the HGI-hypoglycemia association remained significant at BMI values of one standard deviation below the mean (effect size = 0.946, 95%CI: 0.855-1.044), the mean (effect size = 1.026, 95%CI: 0.960-1.093), and one standard deviation above the mean (effect size = 1.104, 95%CI: 1.013-1.194). After adjusting for confounding factors, the moderating effect of BMI remained significant in both Model 1 (P = 0.022) and Model 2 (P = 0.021). Figure 3 illustrates the moderated mediation paths.
Moderating effect of BMI on the association between HGI and HbA1c
| Mediator | Crude | Model 1 | Model 2 | |||||||
| Effect size/Coefficient | 95%CI | P | P | |||||||
| BMI | Mean - 1 SD | 0.946 | 0.855-1.044 | < 0.001 | 0.950 | 0.855-1.044 | < 0.001 | 0.969 | 0.877-1.061 | < 0.001 |
| BMI | Mean | 1.026 | 0.960-1.093 | < 0.001 | 1.027 | 0.960-1.093 | < 0.001 | 1.042 | 0.977-1.107 | < 0.001 |
| BMI | Mean + 1 SD | 1.104 | 1.013-1.194 | < 0.001 | 1.104 | 1.014-1.194 | < 0.001 | 1.116 | 1.028-1.203 | < 0.001 |
| HGI → HGI × BMI → HbA1c | 0.022 | 0.004-0.040 | 0.019 | 0.022 | 0.004-0.041 | 0.019 | 0.021 | 0.003-0.387 | 0.021 | |
DISCUSSION
We explored the association between HGI and hypoglycemia in T2DM patients across eight communities in Beijing and examined the moderating effects of HbA1c and BMI on this association. Our results showed that a higher HGI was significantly associated with an increased risk of hypoglycemia. Moderated mediation analysis confirmed that the link between HGI and hypoglycemia was mediated by HbA1c and moderated by BMI.
HbA1c reflects average blood glucose levels over time but is influenced by individual factors such as erythrocyte turnover, enzyme activity, and intracellular pH[16,17]. Consequently, individuals with the same mean blood glucose may exhibit different HbA1c levels. To account for these differences, Hempe et al. (2002) introduced the HGI, calculated as the difference between observed and predicted HbA1c levels, with predicted HbA1c derived from linear regression of FBG on actual HbA1c[18]. The HGI has been shown to capture variations in glucose metabolism in pediatric type 1 diabetes patients[19], and is associated not only with individual glucose metabolism but also with diabetes complications[20]. Hypoglycemia is a common complication, particularly in patients with longer disease duration or on intensive hypoglycemic treatment. It disrupts glucose homeostasis and increases the risk of vascular complications. Prior studies have demonstrated that HGI predicts severe hypoglycemia and major adverse cardiovascular events in T2DM patients[20]. In our cohort, patients with higher HGI more frequently used insulin and sulfonylureas, both of which are known to cause iatrogenic hypoglycemia[21]. Additional factors affecting severe hypoglycemia include age, diabetes duration, medications, and HbA1c levels[22], with HbA1c being a key predictor. Notably, a nested case-control study reported a U-shaped relationship between HbA1c and the first hypoglycemia-related hospitalization in adults with T2DM, with risk increasing at both low and high HbA1c levels[23]. Higher HbA1c levels may indicate impaired glycemic stability and reduced hypoglycemia defenses[24], whereas lower HbA1c levels can predispose patients on intensive therapy to iatrogenic hypoglycemia[25,26].
Although both HGI and HbA1c are associated with hypoglycemia, few studies have examined the direct pathway linking HGI to hypoglycemia in T2DM patients. Our mediation analysis suggests HbA1c mediates this relationship. Mechanistically, HGI reflects individual glucose metabolism; changes in HGI influence blood glucose and, in turn, HbA1c levels. In patients with impaired islet function, these changes increase the likelihood of hypoglycemia.
Our moderated mediation analysis further indicated that BMI modulates the relationship between HGI and HbA1c, possibly reflecting alterations in individual metabolism. Higher BMI, often associated with overweight or obesity, may induce glucose tolerance or impair insulin sensitivity[27,28], thereby influencing the HGI-HbA1c relationship. Overall, our findings suggest that the association between HGI and hypoglycemia risk is influenced by multiple mechanisms, including HbA1c and BMI. This study provides a theoretical basis for understanding the link between HGI and diabetes complications, although more studies are needed to confirm the relationship.
Limitations
Our study has several limitations. First, the sample included only 1,203 T2DM patients from eight Beijing communities, which may introduce selection bias. Second, HGI was calculated via regression of individual FBG on baseline HbA1c, but demographic factors such as race and sex may influence HGI; standardized calculation methods across populations are required. Third, hypoglycemia was self-reported, introducing potential recall bias. Fourth, we did not measure parameters reflecting erythrocyte turnover (e.g., ferritin, erythropoietin, reticulocyte counts), which may confound HGI calculations. Fifth, direct measures of insulin resistance, such as HOMA-IR, were unavailable; as insulin resistance affects glucose homeostasis and glycation, its absence may contribute to residual confounding. Sixth, despite adjustment for several confounders, others such as glucagon levels and the insulin types were not recorded. Finally, clinical implementation of HGI is limited by the need for both HbA1c and fasting glucose measurements, population variability, lack of standardized calculations and cut-offs, and limited interventional evidence. Addressing these gaps is essential to translate HGI from an epidemiological marker to a practical clinical tool.
Conclusion
Clinically, HGI may serve as a useful adjunctive biomarker for stratifying hypoglycemia risk in T2DM patients, particularly when HbA1c alone does not fully capture individual glycemic patterns. Incorporating HGI into routine assessments could identify patients at higher risk of hypoglycemia despite similar mean glucose levels, facilitating personalized therapy. We found that higher HGI is significantly associated with increased hypoglycemia risk. The path from HGI to hypoglycemia is mediated by HbA1c and moderated by BMI. Interventions targeting HbA1c and BMI may help reduce hypoglycemia risk in T2DM patients.
DECLARATIONS
Authors’ contributions
Wrote the manuscript: Liu H
Performed the statistical analyses: Hu X (Xiaodong Hu), Wang A
Collected the data: Kang S
Administered the questionnaires: Hu X (Xiaona Hu)
Assumed full responsibility for data integrity and the accuracy of the analyses: Mu Y
Revised the manuscript: Wang Y, Lyu Z
Designed the study: Wang Y, Lyu Z
All authors approved the final manuscript.
Availability of data and materials
The data and analytical methods are available from the corresponding author upon reasonable request.
Financial support and sponsorship
None.
Conflicts of interest
All authors declared that there are no conflicts of interest.
Ethical approval and consent to participate
The study protocol was approved by the Ethics Committee of Rui Jin Hospital, Shanghai Jiao Tong University School of Medicine (Approval No.: 2011-14). All participants provided written informed consent prior to enrolment, in accordance with the Declaration of Helsinki.
Consent for publication
Not applicable.
Copyright
© The Author(s) 2025.
REFERENCES
1. González-Vidal T, Rivas-Otero D, Gutiérrez-Hurtado A, et al. Hypoglycemia in patients with type 2 diabetes mellitus during hospitalization: associated factors and prognostic value. Diabetol Metab Syndr. 2023;15:249.
2. Heller SR, Peyrot M, Oates SK, Taylor AD. Hypoglycemia in patient with type 2 diabetes treated with insulin: it can happen. BMJ Open Diabetes Res Care. 2020;8:e001194.
3. Wang Y, Liu H, Hu X, et al. Association between hemoglobin glycation index and 5-year major adverse cardiovascular events: the REACTION cohort study. Chin Med J. 2023;136:2468-75.
4. Pan L, Lu F, Cheng B, Zhang W, Wang B. Association between hemoglobin glycation index and mortality in critically ill patients: a retrospective cohort study. J Health Popul Nutr. 2025;44:249.
5. Zhao M, Sun N, Cheng Y, et al. Hemoglobin glycation index and mortality risk in metabolic dysfunction-associated steatotic liver disease patients: a novel U-shaped association. Sci Rep. 2025;15:1465.
6. Hempe JM, Liu S, Myers L, McCarter RJ, Buse JB, Fonseca V. The hemoglobin glycation index identifies subpopulations with harms or benefits from intensive treatment in the ACCORD trial. Diabetes Care. 2015;38:1067-74.
7. Shi F, Yang Z, Wang Z, Wang L, Fang C. Association of hemoglobin glycation index with all-cause and cardiovascular mortality in patients with diabetes or prediabetes and comorbid cardiovascular disease: a population-based cohort study. Sci Rep. 2025;15:20696.
8. Ernesti I, Massari MC, Cipriani F, et al. Impact of a very low-calorie ketogenic diet on metabolic and microbiota outcomes in post-bariatric patients and bariatric-Naïve individuals: a comparative pilot study. Diabetes Obes Metab. 2025;27:1950-9.
9. Wongwananuruk T, Prasongvej P, Chantrapanichkul P, et al. Measures of serum markers HbA1c, HOMA-IR, HOMA-β, QUICKI and G/I Ratio as predictors of abnormal glucose tolerance among thai women with polycystic ovary syndrome. J Clin Med. 2025;14:1452.
10. Ning G, Bloomgarden Z. Diabetes and cancer: findings from the REACTION study: REACTION. J Diabetes. 2015;7:143-4.
11. American Diabetes Association Professional Practice Committee. 2. Classification and Diagnosis of Diabetes: Standards of Medical Care in Diabetes-2022. Diabetes Care. 2022;45:S17-38.
12. Solnica B, Sygitowicz G, Sitkiewicz D, et al. 2024 Guidelines of the Polish Society of Laboratory Diagnostics and the Polish Lipid Association on laboratory diagnostics of lipid metabolism disorders. Arch Med Sci. 2024;20:357-74.
13. Hitz MP, Dombrowsky G, Melnik N, Vey C. Current and future diagnostics of congenital heart disease (CHD). Med Genet. 2025;37:95-102.
14. Tu Q, Lin S, Hafiz N, et al. Independent and joint associations of hypertension and depression with cardiovascular diseases and all-cause mortality: a population-based cohort study. J Hum Hypertens. 2025;Epub ahead of print.
15. Hayes AF. An index and test of linear moderated mediation. Multivariate Behav Res. 2015;50:1-22.
16. Hempe JM, Hsia DS. Variation in the hemoglobin glycation index. J Diabetes Complications. 2022;36:108223.
17. Hempe JM, Yang S, Liu S, Hsia DS. Standardizing the haemoglobin glycation index. Endocrinol Diabetes Metab. 2021;4:e00299.
18. Hempe JM, Gomez R, McCarter RJ Jr, Chalew SA. High and low hemoglobin glycation phenotypes in type 1 diabetes: a challenge for interpretation of glycemic control. J Diabetes Complications. 2002;16:313-20.
19. Ghazaiean M, Najafi B, Zamanfar D, Alipour MJ. Risk factors for suboptimal glycemic control in pediatrics with type 1 diabetes mellitus: a cross-sectional study. Sci Rep. 2024;14:7492.
20. Klein KR, Franek E, Marso S, et al. Hemoglobin glycation index, calculated from a single fasting glucose value, as a prediction tool for severe hypoglycemia and major adverse cardiovascular events in DEVOTE. BMJ Open Diabetes Res Care. 2021;9:e002339.
21. Lin BS, Liu ZG, Chen DR, et al. Relationship between hemoglobin glycation index and risk of hypoglycemia in type 2 diabetes with time-in-range in target. World J Diabetes. 2024;15:2058-69.
22. Lipska KJ, Warton EM, Huang ES, et al. HbA1c and risk of severe hypoglycemia in type 2 diabetes: the diabetes and aging study. Diabetes Care. 2013;36:3535-42.
23. Zhong VW, Juhaeri J, Cole SR, et al. Proximal HbA1C level and first hypoglycemia hospitalization in adults with incident type 2 diabetes. J Clin Endocrinol Metab. 2019;104:1989-98.
24. Li J, Guo K, Zhang L, et al. Individualized coefficient of variability cut-off values for reducing the risk of hypoglycemia in Chinese type 1 diabetes mellitus (T1DM) patients. Chin Med J. 2024;137:244-6.
25. Shabestari M, Mehrabbeik A, Barbieri S, Marques-Vidal P, Heshmati-Nasab P, Azizi R. Predictive factors of hypoglycemia in type 2 diabetes: a prospective study using machine learning. Sci Rep. 2025;15:18143.
26. Min Ko M, Kit Lee W, Chang Ang L, Goh SY, Mong Bee Y, Ming Teh M. A Cross-Sectional study on risk factors for severe hypoglycemia among Insulin-Treated elderly type 2 diabetes Mellitus (T2DM) patients in Singapore. Diabetes Res Clin Pract. 2022;185:109236.
27. Jiang J, Cai X, Pan Y, et al. Relationship of obesity to adipose tissue insulin resistance. BMJ Open Diabetes Res Care. 2020;8:e000741.
Cite This Article
How to Cite
Download Citation
Export Citation File:
Type of Import
Tips on Downloading Citation
Citation Manager File Format
Type of Import
Direct Import: When the Direct Import option is selected (the default state), a dialogue box will give you the option to Save or Open the downloaded citation data. Choosing Open will either launch your citation manager or give you a choice of applications with which to use the metadata. The Save option saves the file locally for later use.
Indirect Import: When the Indirect Import option is selected, the metadata is displayed and may be copied and pasted as needed.
About This Article
Special Issue
Copyright

Data & Comments
Data
0


Comments
Comments must be written in English. Spam, offensive content, impersonation, and private information will not be permitted. If any comment is reported and identified as inappropriate content by OAE staff, the comment will be removed without notice. If you have any queries or need any help, please contact us at support@oaepublish.com.