

Combined lifestyle and type 2 diabetes mellitus among women with a history of GDM or HDP
 0
0 Graphical Abstract
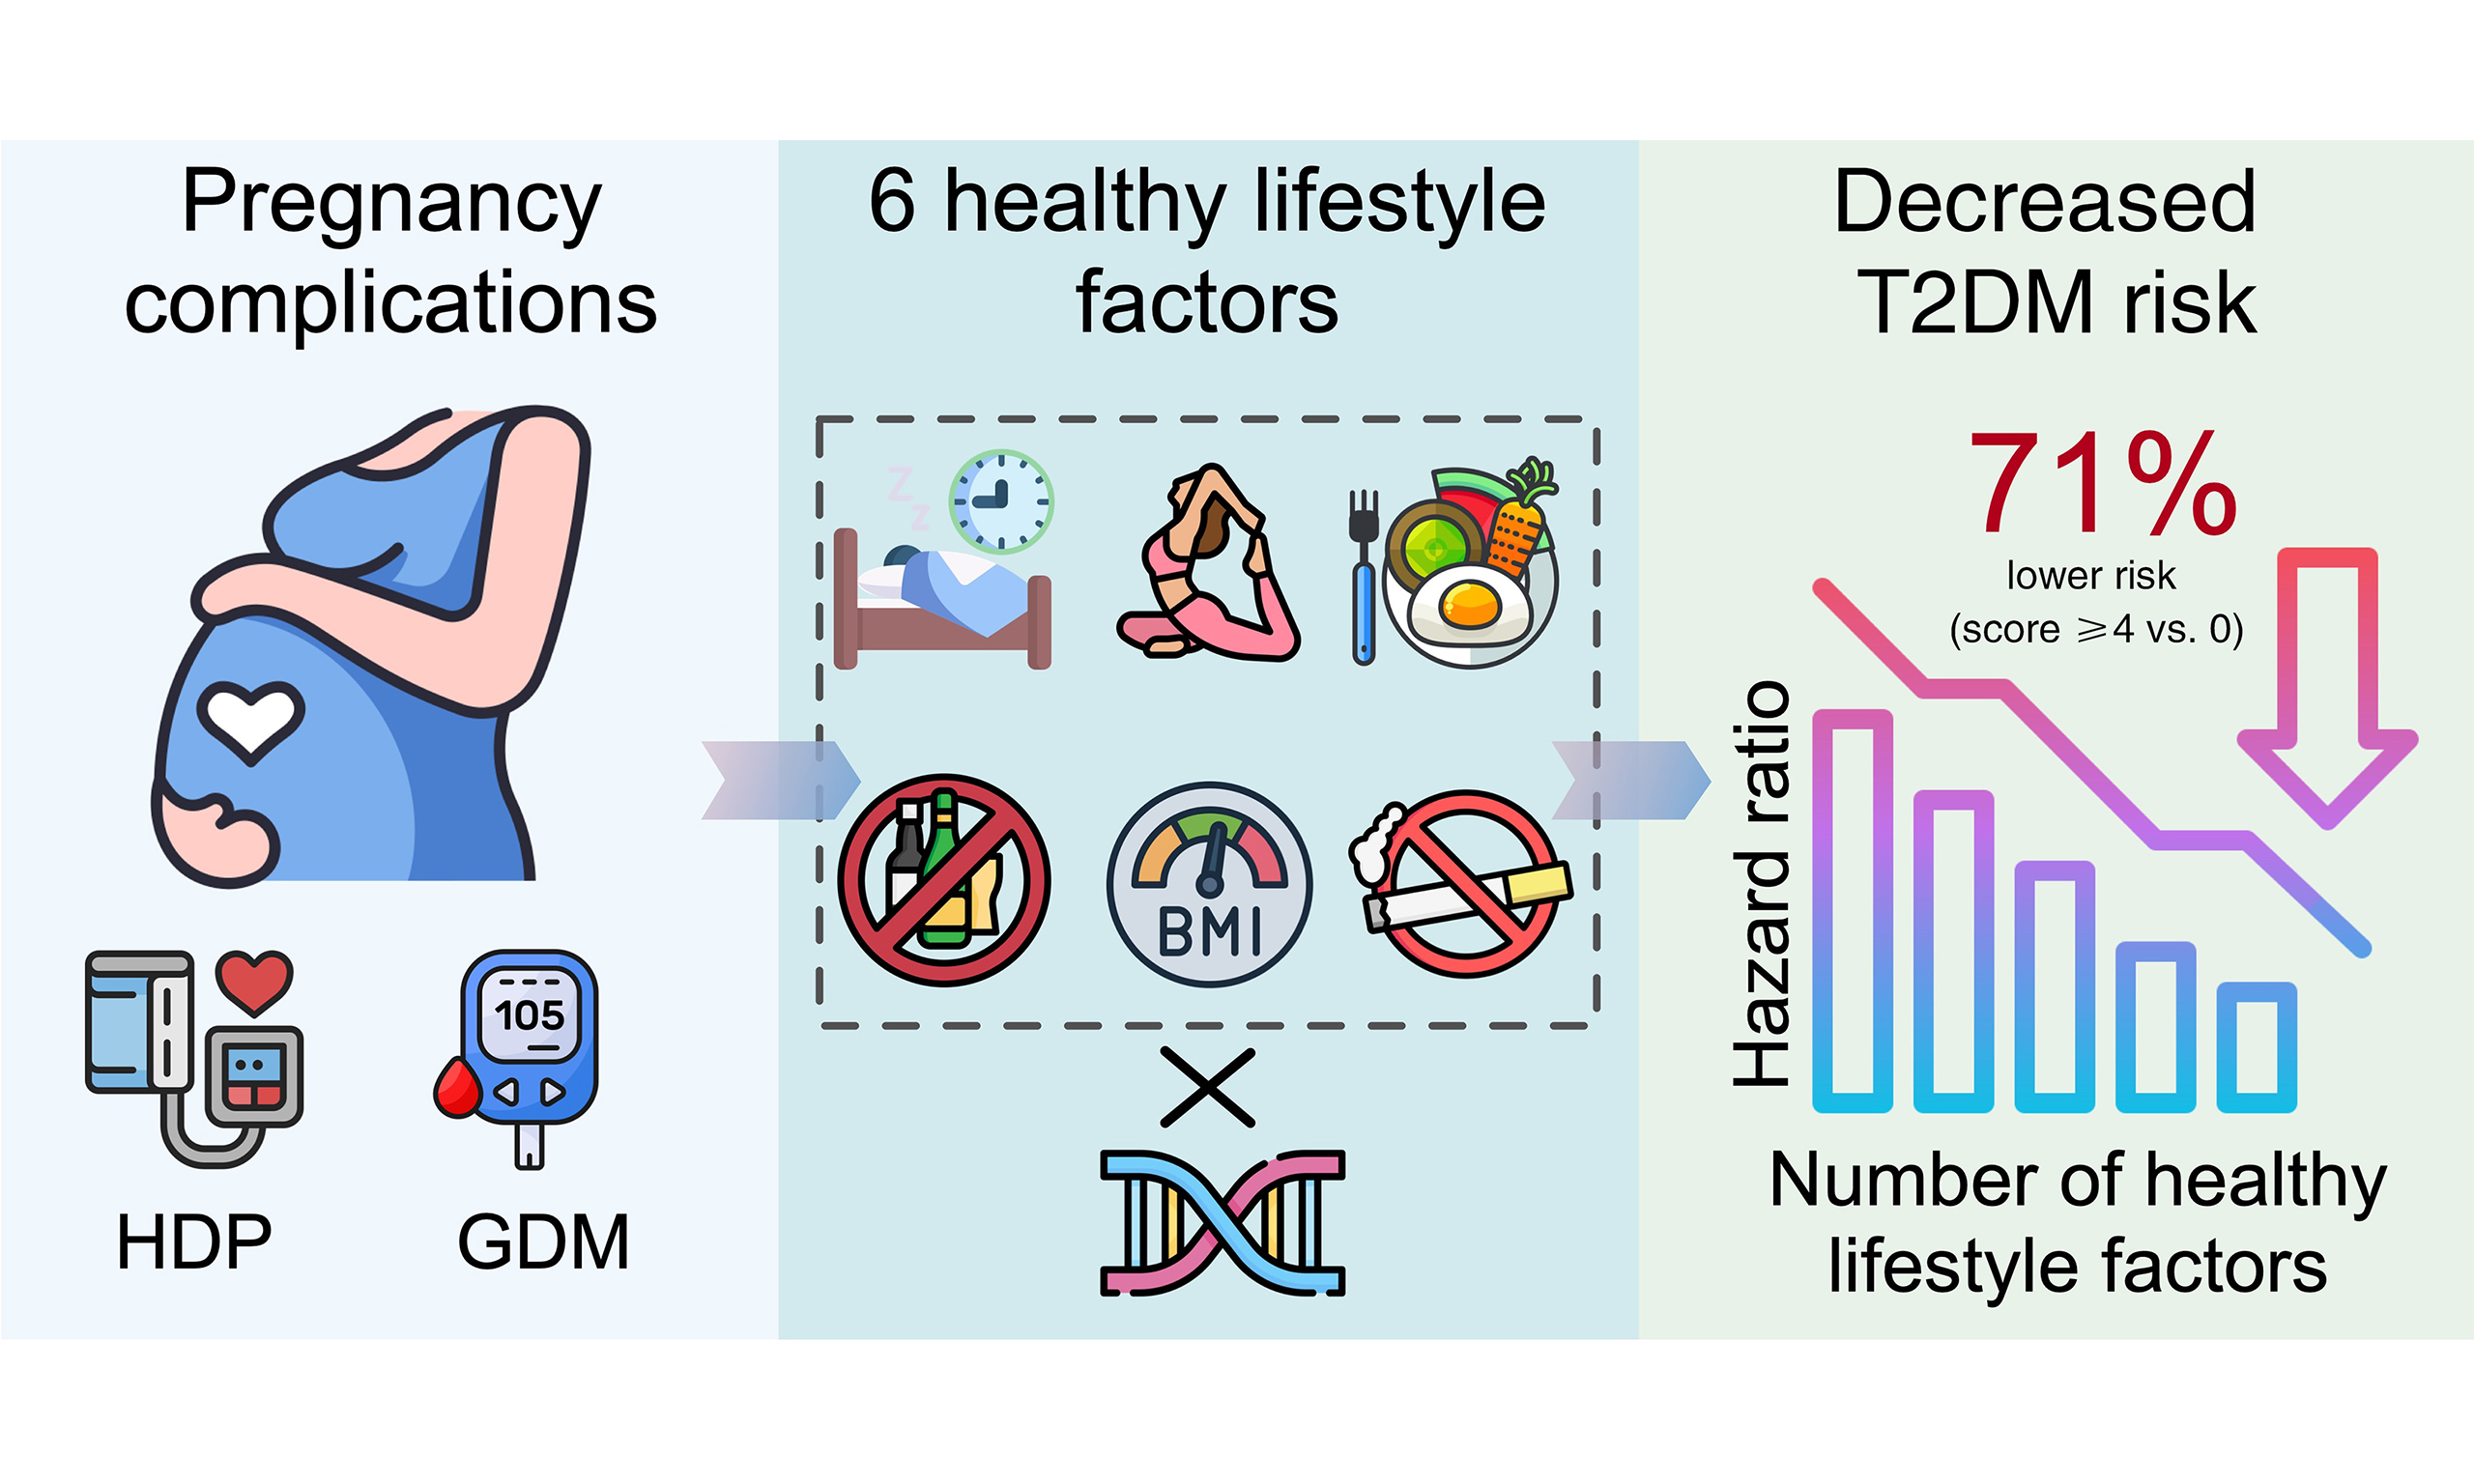
Abstract
Aim: We explored whether adherence to a combined healthy lifestyle was associated with the long-term risk of type 2 diabetes mellitus (T2DM) among women with prior gestational diabetes mellitus (GDM) or hypertensive disorders of pregnancy (HDP) and whether genetic susceptibility modified this association.
Methods: A total of 3,109 women aged 40-69 years with a history of GDM or HDP were included in the present study. All participants were selected from the UK Biobank. We constructed a combined lifestyle score based on six favorable lifestyle factors, including diet, smoking, alcohol consumption, physical activity, sleep, and body mass index. Scores ranged from 0 to 6, with higher scores reflecting a healthier lifestyle. We applied the Cox proportional hazards regression to evaluate the association between the combined lifestyle score and the risk of T2DM. We further examined the interplay between the polygenic risk score (PRS) and the combined lifestyle score regarding the development of T2DM.
Results: Compared with those scoring 0 points, participants with combined lifestyle scores of 2, 3, and ≥ 4 points had significantly lower risks of T2DM, with hazard ratios (95% confidence intervals) of 0.54 (0.32, 0.93), 0.37 (0.22, 0.64), and 0.29 (0.16, 0.53), respectively. A significant dose-response relationship was observed (P for trend < 0.001). However, there was no interaction between the PRS and combined lifestyle score for the risk of T2DM (P for interaction = 0.247).
Conclusions: For those with a history of GDM or HDP, a healthier combined lifestyle was associated with a dose-dependent reduction in T2DM risk. These inverse associations were consistent across strata of genetic susceptibility and other major participant characteristics.
Keywords


 Download PDF
INTRODUCTION
Gestational diabetes mellitus (GDM) and hypertensive disorders of pregnancy (HDP) are two common pregnancy-related complications. Among these, GDM occurs frequently during pregnancy, with a global prevalence of approximately 14%[1]. HDP accounts for an estimated 14% of maternal deaths worldwide[2]. A history of GDM or HDP is associated with a substantially increased risk of developing type 2 diabetes mellitus (T2DM)[3,4]. Accordingly, GDM and HDP are regarded as major indicators of metabolic health in pregnant women[5,6]. Notably, both conditions are characterized by systemic inflammation during pregnancy, which may persist postpartum and lead to long-term metabolic complications[7-9]. With rising global obesity rates and increasing maternal age, the incidence of GDM and HDP continues to rise. Thus, identifying modifiable lifestyle factors and developing intervention strategies are essential to mitigate long-term T2DM risk among those with a history of GDM or HDP.
Recent studies suggest that lifestyle-based approaches are associated with a markedly reduced risk of T2DM in the general population[10-12]. In particular, clinical trials have confirmed that following a healthy lifestyle, including weight control, regular physical activity, balanced nutrition, moderate alcohol consumption, and smoking cessation, significantly reduces T2DM risk among community-dwelling adults[13-15]. Whether this protective effect extends to women with prior GDM or HDP remains uncertain. According to the U.S. Nurses’ Health Study II (NHS-II), women with prior GDM who achieved ideal levels across all five lifestyle components showed a reduction in T2DM risk exceeding 90% compared with those who achieved none[16]. However, this cohort consisted primarily of nurses with relatively high socioeconomic status and health literacy, potentially overestimating the benefit and limiting generalizability. Evidence linking HDP to subsequent T2DM is less common. A Danish nationwide cohort study observed that maintaining a healthy body weight was critical for lowering T2DM risk among women with prior HDP compared with normotensive controls[17], but the analysis was limited to body mass index (BMI) and did not evaluate the synergistic impact of multiple lifestyle components. In addition, although the NHS-II suggested that the benefits of a healthy lifestyle were independent of polygenic risk scores (PRS) for GDM, evidence remains limited among women from diverse ethnic and genetic backgrounds. Thus, it is unclear whether the association between combined lifestyle factors and T2DM differs by genetic predisposition.
To address these knowledge gaps, the present study prospectively evaluated associations between a combined lifestyle (dietary patterns, physical activity, smoking status, alcohol consumption, sleep duration, and BMI) and T2DM risk, and assessed whether the association was modified by PRS. Our findings will provide clues for preventing T2DM in individuals who have experienced pregnancy complications such as GDM or HDP.
METHODS
Data source and study population
This study obtained data from the UK Biobank (UKB), a large-scale prospective cohort that recruited more than 500,000 participants aged 40-69 years from 2006 to 2010. At enrollment, participants completed detailed questionnaires on demographic characteristics, behavioral factors, environmental exposures, and medical history, and underwent physical exams and standardized biological measurements[18]. During follow-up, the UKB was linked to nationwide databases, such as primary care data, hospitalization records, death registries, and disease-specific registers, to identify disease diagnoses. The UK Biobank study received ethical approval from the North West Multi-Centre Research Ethics Committee (REC reference: 21/NW/0157, IRAS project ID: 299116), and all participants provided written informed consent. The present analysis was conducted under UK Biobank Application Number 103011 and required no additional institutional ethical approval because only de-identified data were used.
We conducted both cross-sectional and prospective analyses. For the cross-sectional analyses, we excluded 51,079 women without a history of childbirth and 218,033 women without a prior history of GDM or HDP. GDM was identified using ICD-10 code O24.4 (and corresponding ICD-9 codes 648.0 and 648.8). HDP was considered present if any of the following ICD-10 codes were recorded: O11, O13, O14.0, O14.1, O14.9, O15.0, O15.1, O15.2, and O15.9 (and corresponding ICD-9 codes 642.3, 642.4, 642.5, 642.6, and 642.7). We also excluded 672 women with missing data on lifestyle factors, 86 women with missing genetic data, and 177 women lacking information on major covariates. Consequently, data from 3,251 women were used for the cross-sectional analyses [Figure 1]. For the prospective analyses, we further excluded 142 women with prevalent diabetes at recruitment, resulting in a final sample of 3,109 women.
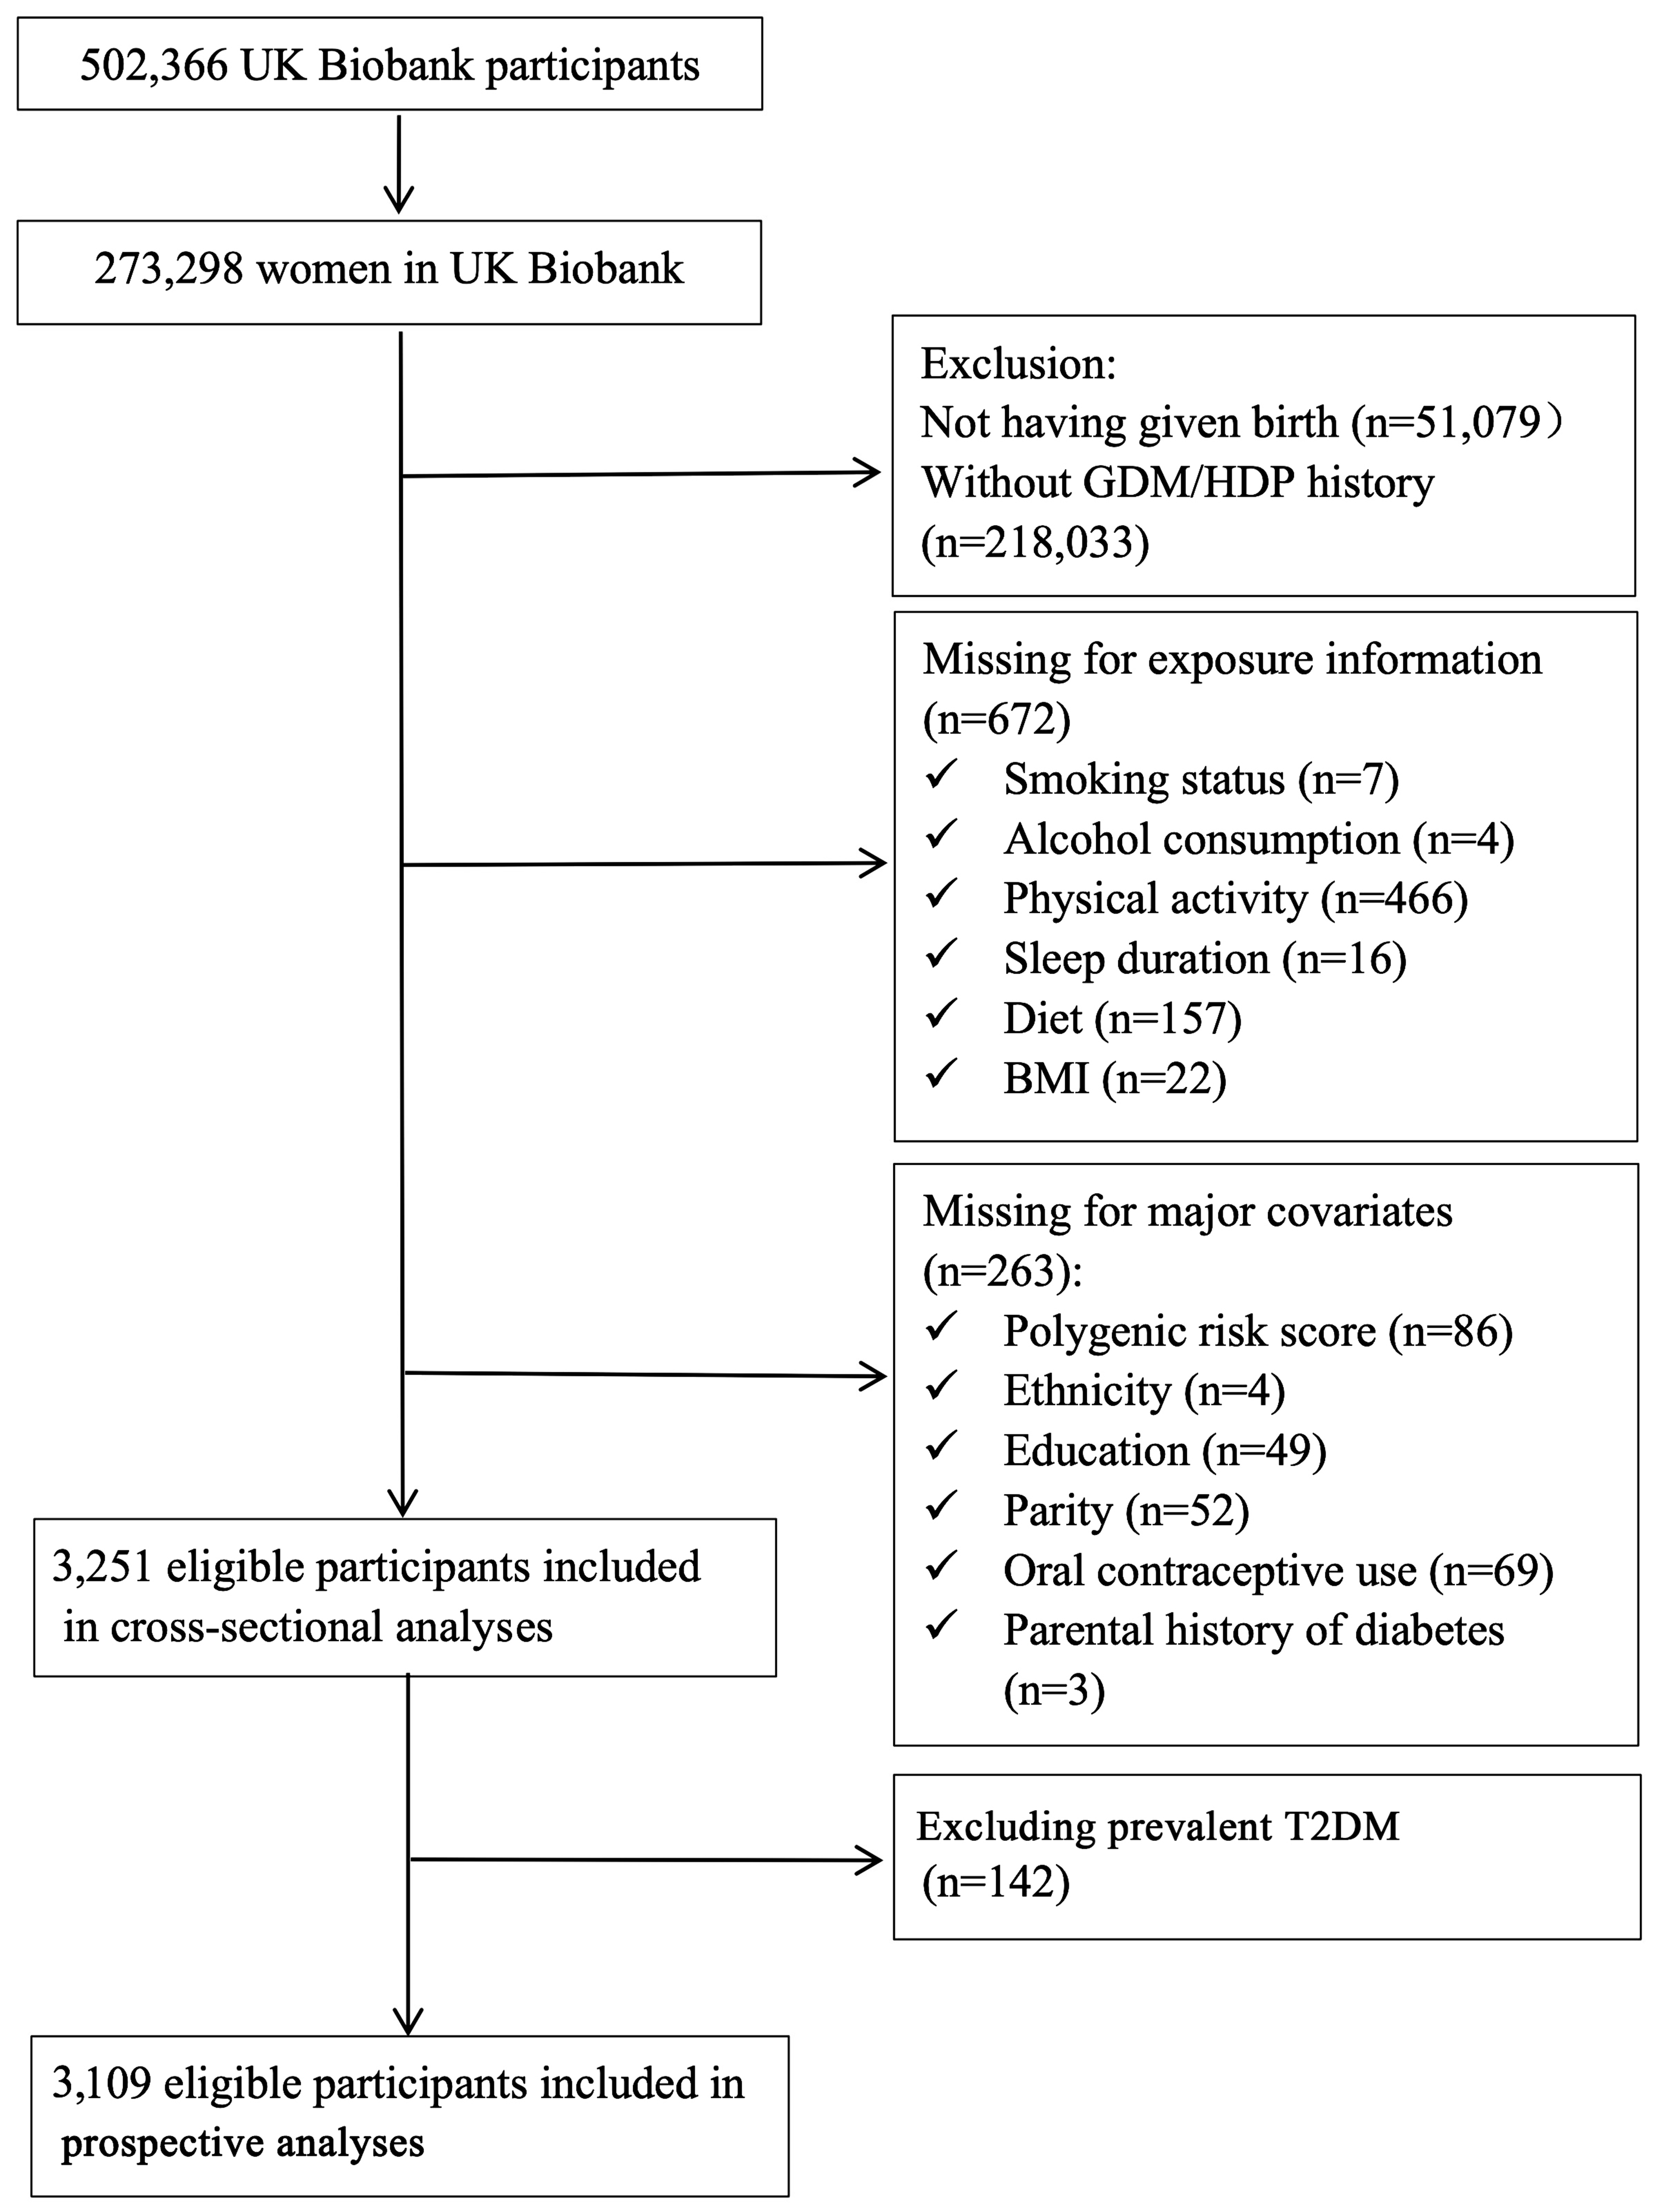
Figure 1. Flowchart of inclusion and exclusion procedures. BMI: Body mass index; GDM: gestational diabetes mellitus; HDP: hypertensive disorders of pregnancy; T2DM: type 2 diabetes mellitus.
Exposure assessment
A combined lifestyle score was constructed using six behavioral indicators [Supplementary Tables 1 and 2]. Following a published approach[19], each indicator was initially classified into three categories and then dichotomized as healthy (1) or unhealthy (0). The combined lifestyle score (range: 0-6) was derived by summing the six dichotomized items, with higher scores indicating a healthier lifestyle. For diet, we assessed adherence to the dietary priorities for cardiovascular health[20] across seven core food groups: fruits, vegetables, fish, refined grains, whole grains, processed red meat, and unprocessed red meat. Participants were classified as having a healthy diet if they met ≥ 6 categories, a moderate diet if they met 2-5 categories, and a poor diet if they met ≤ 1 category; only the healthy category contributed 1 point. Physical activity was evaluated based on World Health Organization recommendations[21] and categorized as active (≥ 150 min of moderate or ≥ 75 min of vigorous activity/week), moderate (partial compliance), or inactive (no compliance); only the active category contributed 1 point. Smoking status was categorized as never, former, or current smoker; only never smoking contributed 1 point. For alcohol consumption, never drinkers were assigned 1 point, whereas low-risk drinkers (≤ 7 standard drinks/week; 1 drink = 14 g ethanol) and high-risk drinkers (> 7 drinks/week or daily)[22] were grouped into unhealthy. Sleep duration was categorized as healthy (7-8 h/night), moderate (6 or 9 h), and poor (≤ 5 or ≥ 10 h/night), with healthy sleepers assigned 1 point[23]. BMI, calculated as weight (kg)/height2(m2), was categorized as healthy (< 25.0 kg/m2; 1 point) or unhealthy (≥ 25.0 kg/m2)[24]. To ensure adequate statistical power, we divided the combined lifestyle score into five categories (0, 1, 2, 3, and 4-6 points) in the main analyses and further classified it into three groups: unhealthy (0-1 points), intermediate (2-3 points), or healthy (4-6 points). In addition, we constructed an alternative combined lifestyle score excluding BMI. Comparing effect estimates between the two scores allowed us to indirectly examine whether BMI mediated the association between the combined lifestyle score and T2DM risk.
The PRS for T2DM quantifies genetic susceptibility using a standardized metric available in the UKB (Field ID: 26285). The PRS was calculated as the weighted sum of allele dosages across genome-wide risk variants, with weights defined by posterior effect sizes estimated from independent genome-wide association study summary statistics[25]. Previous studies have validated the clinical utility of this standardized PRS within the UKB[26,27]. In this study, the PRS was categorized into quartiles: Q1 (lowest genetic risk), Q2, Q3, and Q4 (highest genetic risk). To increase statistical power for the joint analysis of combined lifestyle and genetic susceptibility, the cohort was stratified into a low genetic risk group (PRS quartiles Q1-Q2) and a high genetic risk group (PRS in quartiles Q3-Q4).
Outcomes
Prevalent T2DM at baseline was defined as meeting one or more of the following criteria: (1) self-reported diabetes at the baseline assessment (field 20002); (2) linked historical hospital records indicating diabetes (ICD-9/ICD-10 codes); or (3) baseline HbA1c ≥ 48 mmol/mol in accordance with the American Diabetes Association guidelines[28]. Incident T2DM cases during follow-up were ascertained from linked inpatient hospital records and death registries using ICD-10 codes (E11) [Supplementary Table 3]. For each participant, follow-up was calculated from the baseline assessment to the first occurrence of T2DM, death, loss to follow-up, or the end of follow-up (December 2021), whichever occurred first.
Covariates
Major covariates were collected through the UKB baseline assessment system [Supplementary Table 2]. Demographic characteristics included age (continuous), race/ethnicity (White/non-White), and education level (high: university degree or professional qualification; low: other qualifications). Reproductive history variables included parity (categorized as 0, 1, 2, or ≥ 3 live births) and oral contraceptive use (never/ever). Family history of diabetes was defined as self-reported diabetes in parents or siblings (binary: yes/no). Other covariates used in sensitivity analyses included the Townsend deprivation index, social support, postmenopausal status, and medication use. The Townsend deprivation index, derived from participants’ residential postcode at baseline, was included as a continuous measure of socioeconomic deprivation, with higher values indicating greater deprivation[29]. Social support was derived from baseline questionnaire data[30]. Postmenopausal status was coded as yes or no based on self-reported menopausal status at baseline. Medication use for metabolic diseases was categorized as self-reported regular intake of antihypertensive, lipid-lowering, or antidiabetic medications at baseline.
Statistical analysis
Baseline characteristics of women with prior GDM or HDP were compared across combined lifestyle score categories (0, 1, 2, 3, and ≥ 4). Continuous variables were compared across groups using analysis of variance, and categorical variables were compared using the chi-square test or Fisher’s exact test, as appropriate.
In the cross-sectional analyses, we used logistic regression models to assess associations between the combined lifestyle score and prevalent T2DM. Odds ratios (ORs) with 95% confidence intervals (CIs) were computed. We adjusted for covariates sequentially. In Model 1, we accounted for age (continuous) and race/ethnicity (White or non-White). Model 2 additionally included educational level (categorical), parity (1, 2, or ≥ 3), oral contraceptive use (binary: yes/no), and family history of diabetes (yes/no). When analyzing individual lifestyle factors, Model 2 was additionally adjusted for other lifestyle factors (excluding BMI).
In the prospective analyses, we used Cox proportional hazards regression models to evaluate associations of individual lifestyle factors, the combined lifestyle score, and the PRS with new-onset T2DM, following the same analytical strategy as in the cross-sectional analyses. The proportional hazards assumption of the Cox models was assessed using Schoenfeld residuals. No significant violations were detected (all global P > 0.05), indicating that the assumption was satisfied. Hazard ratios (HRs) and corresponding 95%CIs were reported. We examined whether the relationship between lifestyle factors and T2DM varied across population subgroups using stratified analyses. Participants were stratified by PRS (low vs. high), age (< 55 years vs. ≥ 55 years), BMI (< 30 kg/m2 vs. ≥ 30 kg/m2), and family history of diabetes (yes vs. no). To assess effect modification (interaction), we added interaction terms to our Cox models and tested their statistical significance using the likelihood ratio test. To evaluate the joint effect of PRS and lifestyle, we conducted a joint association analysis. The previously defined dichotomous genetic risk variable (low vs. high) was cross-classified with the three-category lifestyle variable (unhealthy, intermediate, and healthy), generating six combined exposure groups.
Five sensitivity analyses were conducted to assess the robustness of the association between the combined lifestyle score and incident T2DM. First, to evaluate the contribution of lifestyle factors independent of body weight, we reconstructed an alternative lifestyle score excluding BMI (score range: 0-5). Second, to minimize reverse causality, we excluded participants diagnosed with T2DM during the first two years of follow-up. Third, we handled missing covariate data using multiple imputation via the mice package in R to avoid potential bias[31], generating 10 imputed datasets. Continuous covariates were imputed using predictive mean matching (pmm), and categorical covariates using logistic regression (logreg). Analyses were repeated in each imputed dataset, and estimates were pooled according to Rubin’s rules[32]. Fourth, based on Model 2 in the prospective analyses, further adjustments were made for the Townsend deprivation index (continuous), menopausal status (yes/no), social support (high/low), and medication use for metabolic diseases (yes/no). Fifth, to assess the robustness of our findings, we performed sensitivity analyses separately among women with a history of GDM and those with a history of HDP.
All analyses were conducted with R software (version 4.3; R Foundation for Statistical Computing). A P value < 0.05 (two-sided) was regarded as indicating statistical significance.
RESULTS
Basic characteristics of study participants
The cross-sectional analyses included 3,251 women [Figure 1], of whom 3,109 were eligible for prospective analyses. Within the prospective cohort, 1,017 (32.7%) had a history of GDM only, 2,081 (66.9%) had HDP only, and 11 (0.4%) had a history of both conditions. Five groups were created according to the combined lifestyle scores among the 3,109 participants: 0 (n = 111), 1 (n = 585), 2 (n = 1,087), 3 (n = 956), and ≥ 4 (n = 370). No participants achieved the maximum score of 6. Compared with those in the lower score groups, participants with higher combined lifestyle scores were mostly younger and had higher education levels [Table 1]. They also had lower BMI and were more likely to have healthier lifestyle behaviors, including diet, smoking status, alcohol consumption, physical activity, and sleep duration (all P < 0.05). Similar findings were observed when the combined lifestyle score (range 0-6) was recategorized into healthy, intermediate, and unhealthy categories [Supplementary Table 4].
Baseline characteristics by the combined lifestyle score among women with a history of GDM or HDP
| Characteristics | Combined lifestyle score | ||||||
| Overall (N = 3,109) | 0 (N = 111) | 1 (N = 585) | 2 (N = 1087) | 3 (N = 956) | ≥ 4 (N = 370) | P valuea | |
| Age at enrollment, mean (SD), years | 51.9 (8.5) | 53.4 (8.8) | 52.6 (8.5) | 51.7 (8.5) | 51.6 (8.5) | 51.3 (8.4) | 0.027 |
| Race/ethnicity, n (%) | |||||||
| White | 2,858 (91.9%) | 101 (91.0%) | 560 (95.7%) | 1,015 (93.4%) | 856 (89.5%) | 326 (88.1%) | < 0.001 |
| Non-White | 251 (8.1%) | 10 (9.0%) | 25 (4.3%) | 72 (6.6%) | 100 (10.5%) | 44 (11.9%) | |
| Education, n (%) | |||||||
| Low | 1,197 (38.5%) | 42 (37.8%) | 250 (42.7%) | 431 (39.7%) | 348 (36.4%) | 126 (34.1%) | 0.041 |
| High | 1,912 (61.5%) | 69 (62.2%) | 335 (57.3%) | 656 (60.3%) | 608 (63.6%) | 244 (65.9%) | |
| BMI, mean (SD), kg/m2 | 27.7 (5.2) | 30.5 (4.7) | 29.8 (4.9) | 28.4 (5.0) | 26.5 (5.0) | 24.3 (4.3) | < 0.001 |
| Family history of diabetes, n (%) | |||||||
| Yes | 753 (24.2%) | 23 (20.7%) | 136 (23.2%) | 283 (26.0%) | 220 (23.0%) | 91 (24.6%) | 0.436 |
| No | 2,356 (75.8%) | 88 (79.3%) | 449 (76.8%) | 804 (74.0%) | 736 (77.0%) | 279 (75.4%) | |
| Parity, n (%) | |||||||
| 1 | 602 (19.6%) | 20 (18.0%) | 114 (19.5%) | 215 (19.8%) | 177 (18.5%) | 76 (20.5%) | 0.577 |
| 2 | 1,626 (52.3%) | 58 (52.3%) | 317 (54.2%) | 576 (53.0%) | 500 (52.3%) | 175 (47.3%) | |
| ≥ 3 | 881 (28.3%) | 33 (29.7%) | 154 (26.3%) | 296 (27.2%) | 279 (29.2%) | 119 (32.2%) | |
| Contraceptive use, n (%) | |||||||
| Yes | 2,653 (85.1%) | 101 (91.0%) | 522 (89.2%) | 941 (86.6%) | 808 (84.5%) | 281 (75.9%) | < 0.001 |
| No | 456 (14.9%) | 10 (9.0%) | 63 (10.8%) | 146 (13.4%) | 148 (15.5%) | 89 (24.1%) | |
| Diet quality, n (%) | |||||||
| Healthy | 708 (22.8%) | 24 (21.6%) | 115 (19.7%) | 221 (20.3%) | 236 (24.7%) | 112 (30.3%) | < 0.001 |
| Moderate | 1,600 (51.5%) | 50 (45.0%) | 307 (52.5%) | 545 (50.1%) | 504 (52.7%) | 194 (52.4%) | |
| Poor | 801 (25.8%) | 37 (33.3%) | 163 (27.9%) | 321 (29.5%) | 216 (22.6%) | 64 (17.3%) | |
| Smoking status, n (%) | |||||||
| Never | 2,037 (65.5%) | 0 (0.0%) | 179 (30.6%) | 709 (65.2%) | 790 (82.6%) | 359 (97.0%) | < 0.001 |
| Former | 851 (27.4%) | 87 (78.4%) | 326 (55.7%) | 301 (27.7%) | 131 (13.7%) | 6 (1.6%) | |
| Current | 221 (7.1%) | 24 (21.6%) | 80 (13.7%) | 77 (7.1%) | 35 (3.7%) | 5 (1.4%) | |
| Alcohol consumption, n (%) | |||||||
| Never/special occasions only | 746 (24.0%) | 0 (0.0%) | 40 (6.8%) | 187 (17.2%) | 317 (33.2%) | 202 (54.6%) | < 0.001 |
| ≤ 7 standard drinks/week | 1,954 (62.8%) | 89 (80.2%) | 451 (77.1%) | 745 (68.5%) | 531 (55.5%) | 138 (37.3%) | |
| > 7 drinks/week or daily | 409 (13.2%) | 22 (19.8%) | 94 (16.1%) | 155 (14.3%) | 108 (11.3%) | 30 (8.1%) | |
| Physical activity, n (%) | |||||||
| Active (≥ 150 min/week) | 1,108 (35.6%) | 0 (0.0%) | 53 (9.1%) | 269 (24.7%) | 480 (50.2%) | 306 (82.7%) | < 0.001 |
| Moderate (1-149 min/week) | 1,365 (43.9%) | 64 (57.7%) | 356 (60.9%) | 548 (50.4%) | 345 (36.1%) | 52 (14.1%) | |
| Inactive (0 min/week) | 636 (20.5%) | 47 (42.3%) | 176 (30.1%) | 270 (24.8%) | 131 (13.7%) | 12 (3.2%) | |
| Sleep duration, n (%) | |||||||
| Healthy (7-8h/night) | 2,172 (69.9%) | 0 (0.0%) | 268 (45.8%) | 747 (68.7%) | 796 (83.3%) | 361 (97.6%) | < 0.001 |
| Moderate (6 or 9 h/night) | 784 (25.2%) | 92 (82.9%) | 267 (45.6%) | 286 (26.3%) | 131 (13.7%) | 8 (2.2%) | |
| Poor (≤ 5 or ≥ 10 h/night) | 153 (4.9%) | 19 (17.1%) | 50 (8.5%) | 54 (5.0%) | 29 (3.0%) | 1 (0.3%) | |
| Townsend deprivation index, mean (SD) | -1.4 (3.0) | -1.0 (3.1) | -1.4 (3.0) | -1.6 (2.9) | -1.4 (3.0) | -1.4 (3.1) | 0.214 |
| Social support, n (%) | |||||||
| High | 2,592 (83.4%) | 85 (76.6%) | 474 (81.0%) | 915 (84.2%) | 803 (84.0%) | 315 (85.1%) | 0.106 |
| Low | 517 (16.6%) | 26 (23.4%) | 111 (19.0%) | 172 (15.8%) | 153 (16.0%) | 55 (14.9%) | |
| Menopausal status, n (%) | |||||||
| Yes | 1,518 (48.8%) | 67 (60.4%) | 310 (53.0%) | 518 (47.7%) | 447 (46.8%) | 176 (47.6%) | 0.014 |
| No | 1,591 (51.2%) | 44 (39.6%) | 275 (47.0%) | 569 (52.3%) | 509 (53.2%) | 194 (52.4%) | |
| Medication use, n (%) | |||||||
| Yes | 345 (11.1%) | 15 (13.5%) | 84 (14.4%) | 125 (11.5%) | 90 (9.4%) | 31 (8.4%) | 0.013 |
| No | 2,764 (88.9%) | 96 (86.5%) | 501 (85.6%) | 962 (88.5%) | 866 (90.6%) | 339 (91.6%) | |
Cross-sectional analyses
In the logistic regression, after adjusting for age, race/ethnicity, education, parity, oral contraceptive use, and family history of diabetes, we observed a significant inverse dose-response relationship (P for trend < 0.01; Table 2). Compared with participants with a combined lifestyle score of 0, the adjusted ORs (95%CIs) for those with scores of 1, 2, 3, and ≥ 4 were 0.82 (0.49, 1.38), 0.49 (0.29, 0.83), 0.31 (0.17, 0.55), and 0.36 (0.19, 0.69), respectively.
Association between the combined lifestyle score and T2DM in women with a history of GDM and HDP
| Combined lifestyle score | ||||||
| 0 | 1 | 2 | 3 | ≥ 4 | P for trendc | |
| Cross-sectional analysis | ||||||
| Cases/No. of participants | 11/122 | 39/624 | 43/1,130 | 28/984 | 21/391 | - |
| Model 1: OR (95%CI)a | Reference | 0.77 (0.47, 1.26) | 0.47 (0.29, 0.76) | 0.30 (0.18, 0.49) | 0.38 (0.22, 0.66) | < 0.001 |
| Model 2: OR (95%CI)b | Reference | 0.82 (0.49, 1.38) | 0.49 (0.29, 0.83) | 0.31 (0.17, 0.55) | 0.36 (0.19, 0.69) | 0.002 |
| Prospective analysis | ||||||
| Cases/person-years | 17/1,480.7 | 69/8,023.2 | 88/15,140.4 | 54/13,471.6 | 19/5,271.7 | - |
| Model 1: HR (95%CI)a | Reference | 0.81 (0.48, 1.38) | 0.59 (0.34, 1.04) | 0.42 (0.24, 0.73) | 0.34 (0.19, 0.63) | < 0.001 |
| Model 2: HR (95%CI)b | Reference | 0.83 (0.49, 1.39) | 0.54 (0.32, 0.93) | 0.37 (0.22, 0.64) | 0.29 (0.16, 0.53) | < 0.001 |
Prospective analyses
In prospective analyses of 3,109 women with a history of GDM or HDP (median follow-up 14.5 years), 247 incident T2DM cases were documented. Cox proportional hazards models, adjusted for age, race/ethnicity, education, parity, oral contraceptive use, and family history of diabetes, showed that most modifiable lifestyle factors were independently associated with T2DM [Table 3]. Compared with participants with a combined lifestyle score of 0, the multivariable-adjusted HRs (95%CIs) for incident T2DM were 0.83 (0.49, 1.39) for 1 point, 0.54 (0.32, 0.93) for 2 points, 0.37 (0.22, 0.64) for 3 points, and 0.29 (0.16, 0.53) for ≥ 4 points (P for trend < 0.001), indicating a pronounced inverse association between the combined lifestyle score and T2DM risk [Table 2 and Figure 2].
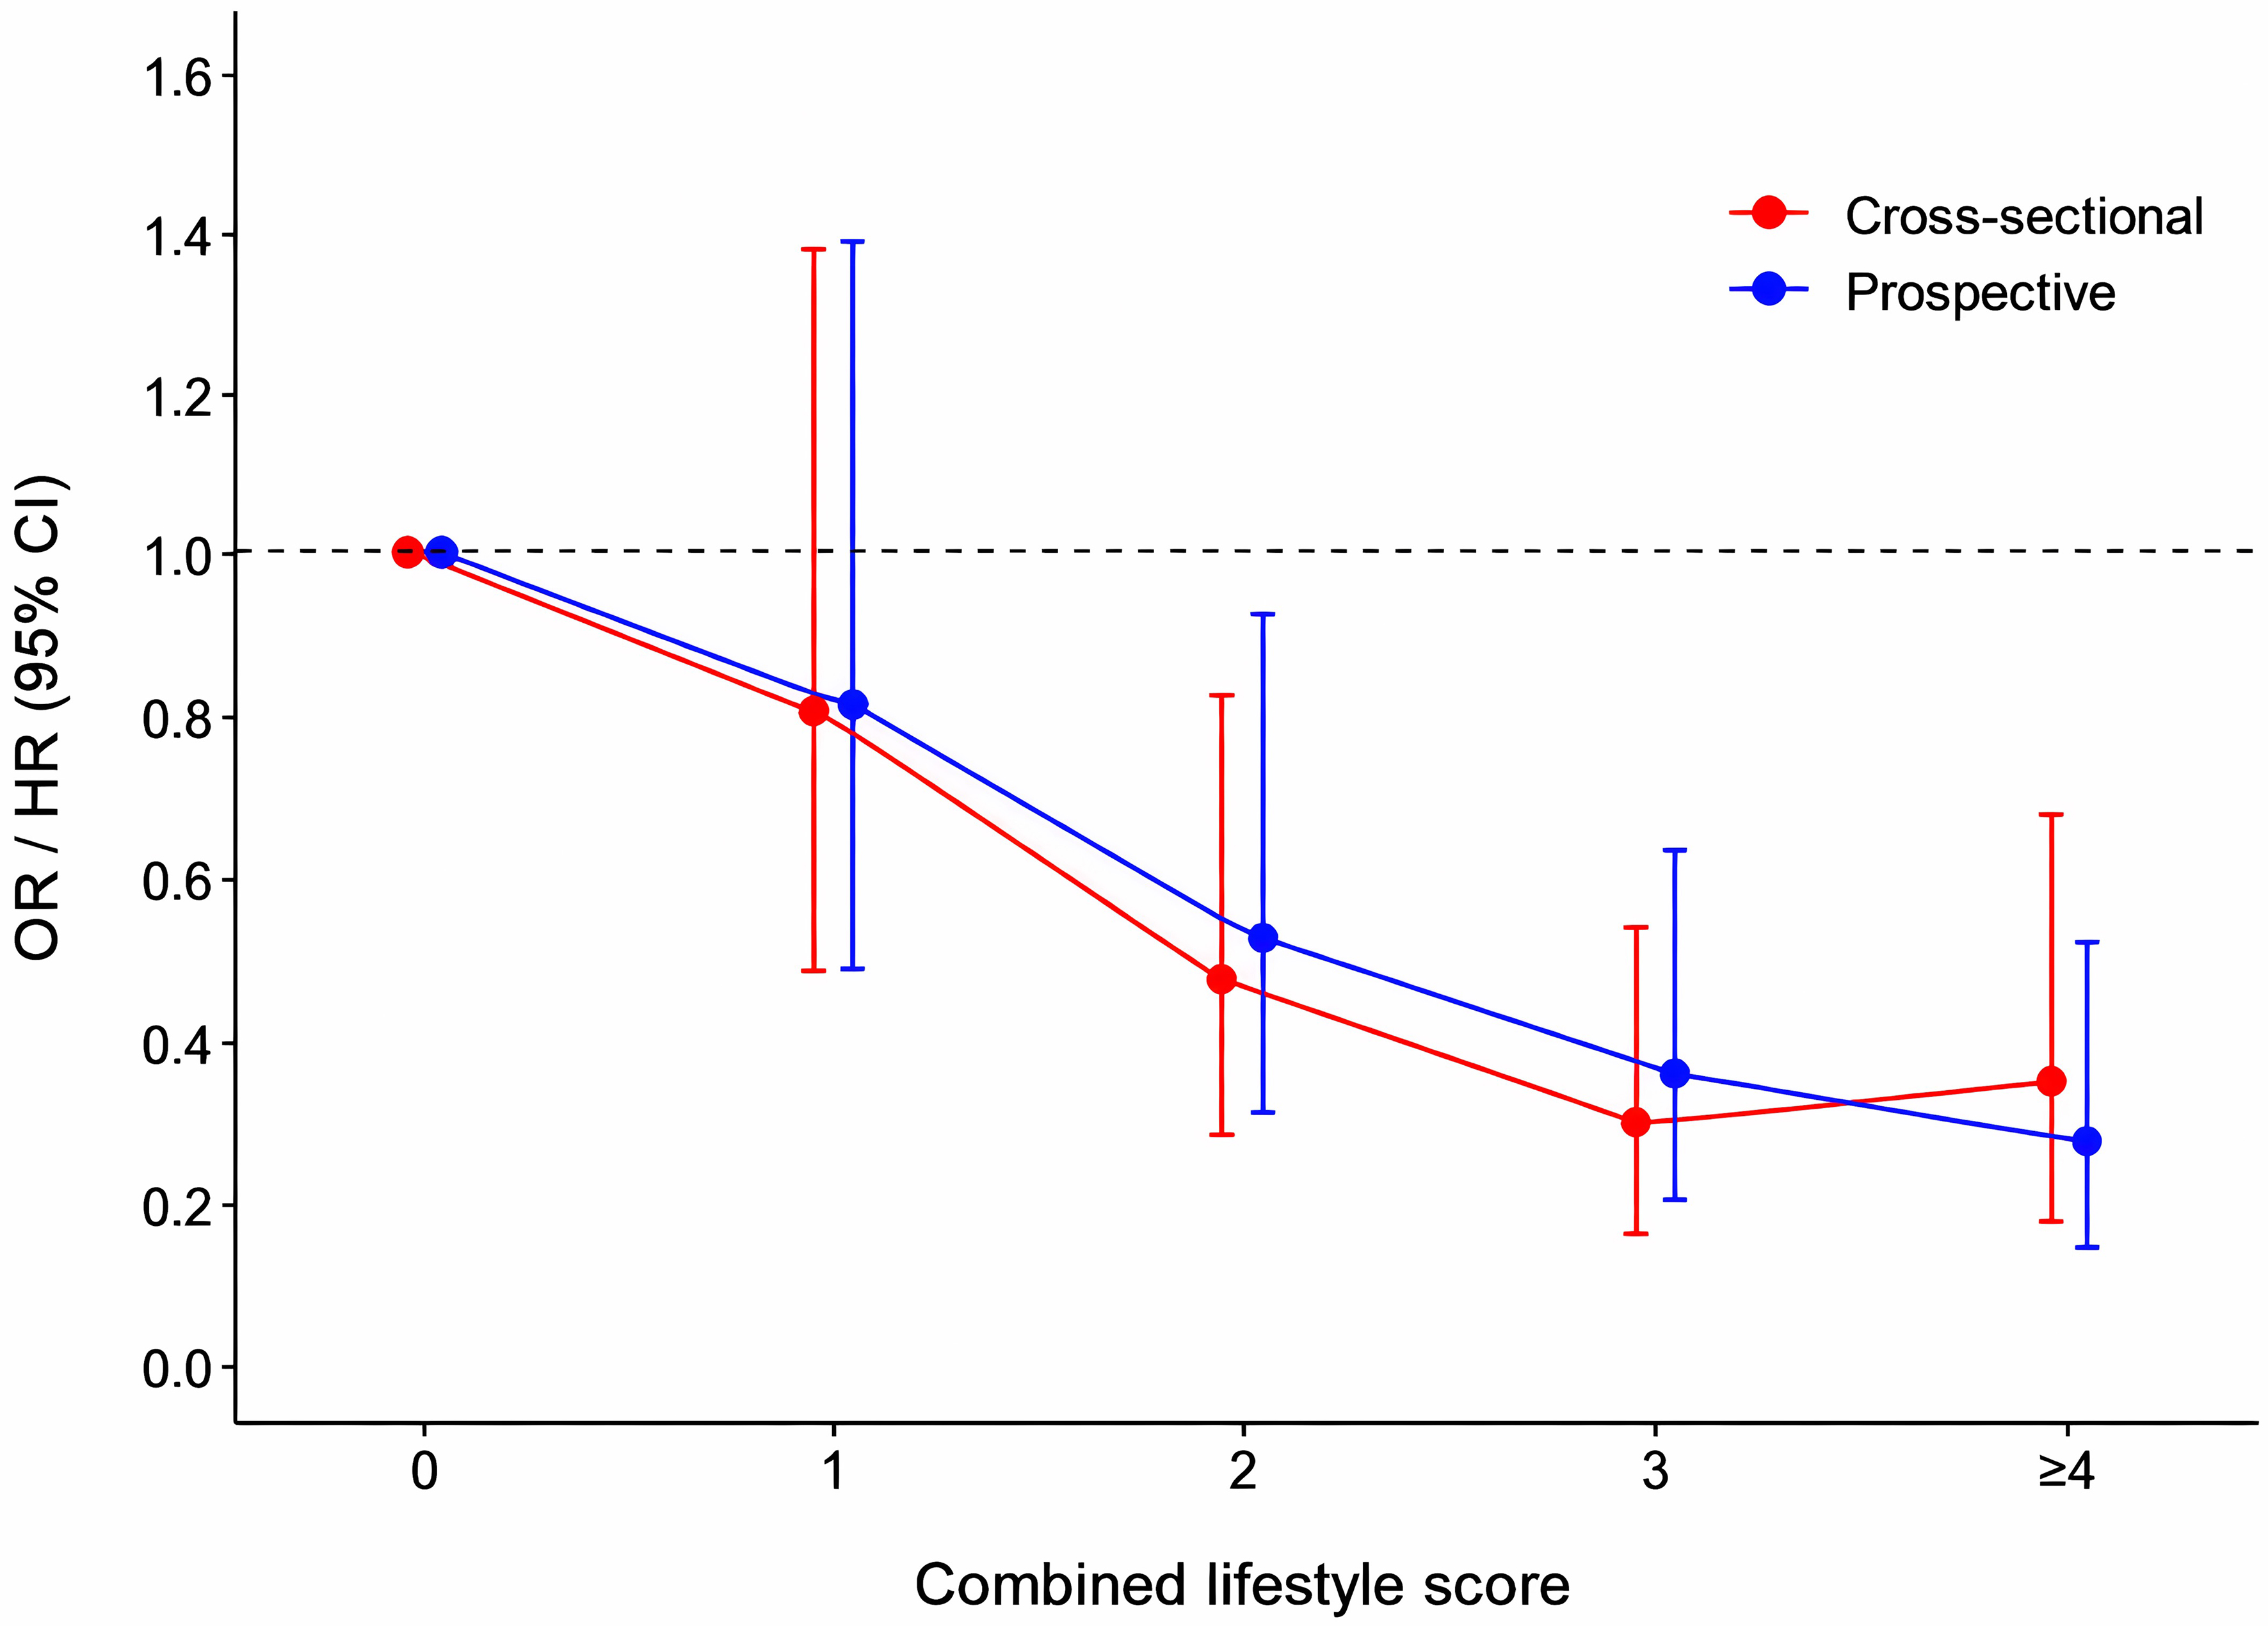
Figure 2. Dose-response relationship between the combined lifestyle score and risk of T2DM. The red line denotes the OR (95%CI) for the cross-sectional association between the combined lifestyle score and T2DM, whereas the blue line denotes the HR (95%CI) for the prospective association. Higher lifestyle scores were linearly associated with T2DM in a dose-response manner (P for trend < 0.01 for both analyses). CI: Confidence interval; HR: hazard ratio; OR: odds ratio; T2DM: type 2 diabetes mellitus.
Prospective association of individual lifestyle factors with risk of T2DM in women with a history of GDM or HDP
| Cases/person years | Model 1 | Model 2 | Model 3 | |
| HR (95%CI)a | HR (95%CI)b | HR (95%CI)c | ||
| BMI, kg/m2 | ||||
| < 25.0 | 36/15,470.9 | Reference | Reference | |
| 25.0-29.9 | 158/19,548.4 | 3.36 (2.34, 4.82) | 2.88 (2.00, 4.15) | |
| 30.0+ | 53/8,368.3 | 2.66 (1.74, 4.06) | 2.43 (1.59, 3.71) | |
| P trendd | < 0.001 | < 0.001 | ||
| Physical activity | ||||
| Active | 69/15,617.7 | Reference | Reference | Reference |
| Moderate | 102/19,045.6 | 1.23 (0.91, 1.67) | 1.24 (0.92, 1.69) | 1.20 (0.88, 1.63) |
| Inactive | 76/8,724.3 | 2.01 (1.45, 2.79) | 1.87 (1.35, 2.59) | 1.73 (1.25, 2.40) |
| P trendd | < 0.001 | < 0.001 | 0.001 | |
| Diet quality | ||||
| Healthy | 56/9,880.2 | Reference | Reference | Reference |
| Moderate | 126/22,317.7 | 1.07 (0.78, 1.46) | 0.98 (0.72, 1.35) | 0.94 (0.68, 1.28) |
| Poor | 65/11,189.7 | 1.16 (0.81, 1.66) | 0.98 (0.68, 1.40) | 0.91 (0.64, 1.31) |
| P trendd | 0.424 | 0.901 | 0.614 | |
| Alcohol intake | ||||
| Never | 95/10,146.8 | Reference | Reference | Reference |
| ≤ 7 standard drinks/week | 123/27,542.0 | 0.86 (0.56, 1.32) | 0.67 (0.50, 0.89) | 0.69 (0.52, 0.92) |
| > 7 drinks/week or daily | 29/5,698.8 | 0.98 (0.49, 1.97) | 0.91 (0.59, 1.41) | 1.06 (0.68, 1.64) |
| P trendd | < 0.001 | 0.006 | 0.012 | |
| Smoking | ||||
| Never | 141/28,633.3 | Reference | Reference | Reference |
| Former/current | 106/14,754.4 | 1.43 (1.11, 1.84) | 1.63 (1.26, 2.11) | 1.67 (1.29, 2.16) |
| P value | 0.005 | < 0.001 | < 0.001 | |
| Sleep duration | ||||
| Healthy | 145/30,488.4 | Reference | Reference | Reference |
| Moderate/poor | 102/12,899.2 | 1.61 (1.25, 2.08) | 1.45 (1.12, 1.87) | 1.41 (1.10, 1.83) |
| P value | < 0.001 | 0.005 | 0.008 | |
Subgroup and sensitivity analyses
No significant interaction was observed between PRS and lifestyle (P for interaction = 0.247, Supplementary Table 5). In the high-PRS group, compared with the unhealthy reference category, the adjusted HR for participants in the healthy category (≥ 4 points) was 0.32 (0.16, 0.65). The joint analysis of PRS and the combined lifestyle score showed that all PRS-lifestyle combined groups exhibited a markedly reduced T2DM risk compared with the reference group (unhealthy lifestyle/high PRS) [Figure 3]. In addition, a combined healthy lifestyle was similarly associated with lower T2DM risk across subgroups defined by BMI, age, and family history of diabetes, with no statistical heterogeneity detected [Supplementary Table 5]. For instance, the adjusted HRs were 0.42 (95%CI: 0.22, 0.78) among individuals with BMI < 30 kg/m2 and 0.61 (95%CI: 0.24, 1.54) among those with BMI ≥ 30 kg/m2 (P for interaction = 0.704). Similarly, the association was observed in both age groups: HR was 0.32 (95%CI: 0.16, 0.65) for age < 55 years and 0.44 (95%CI: 0.21, 0.90) for age ≥ 55 years (P for interaction = 0.780).
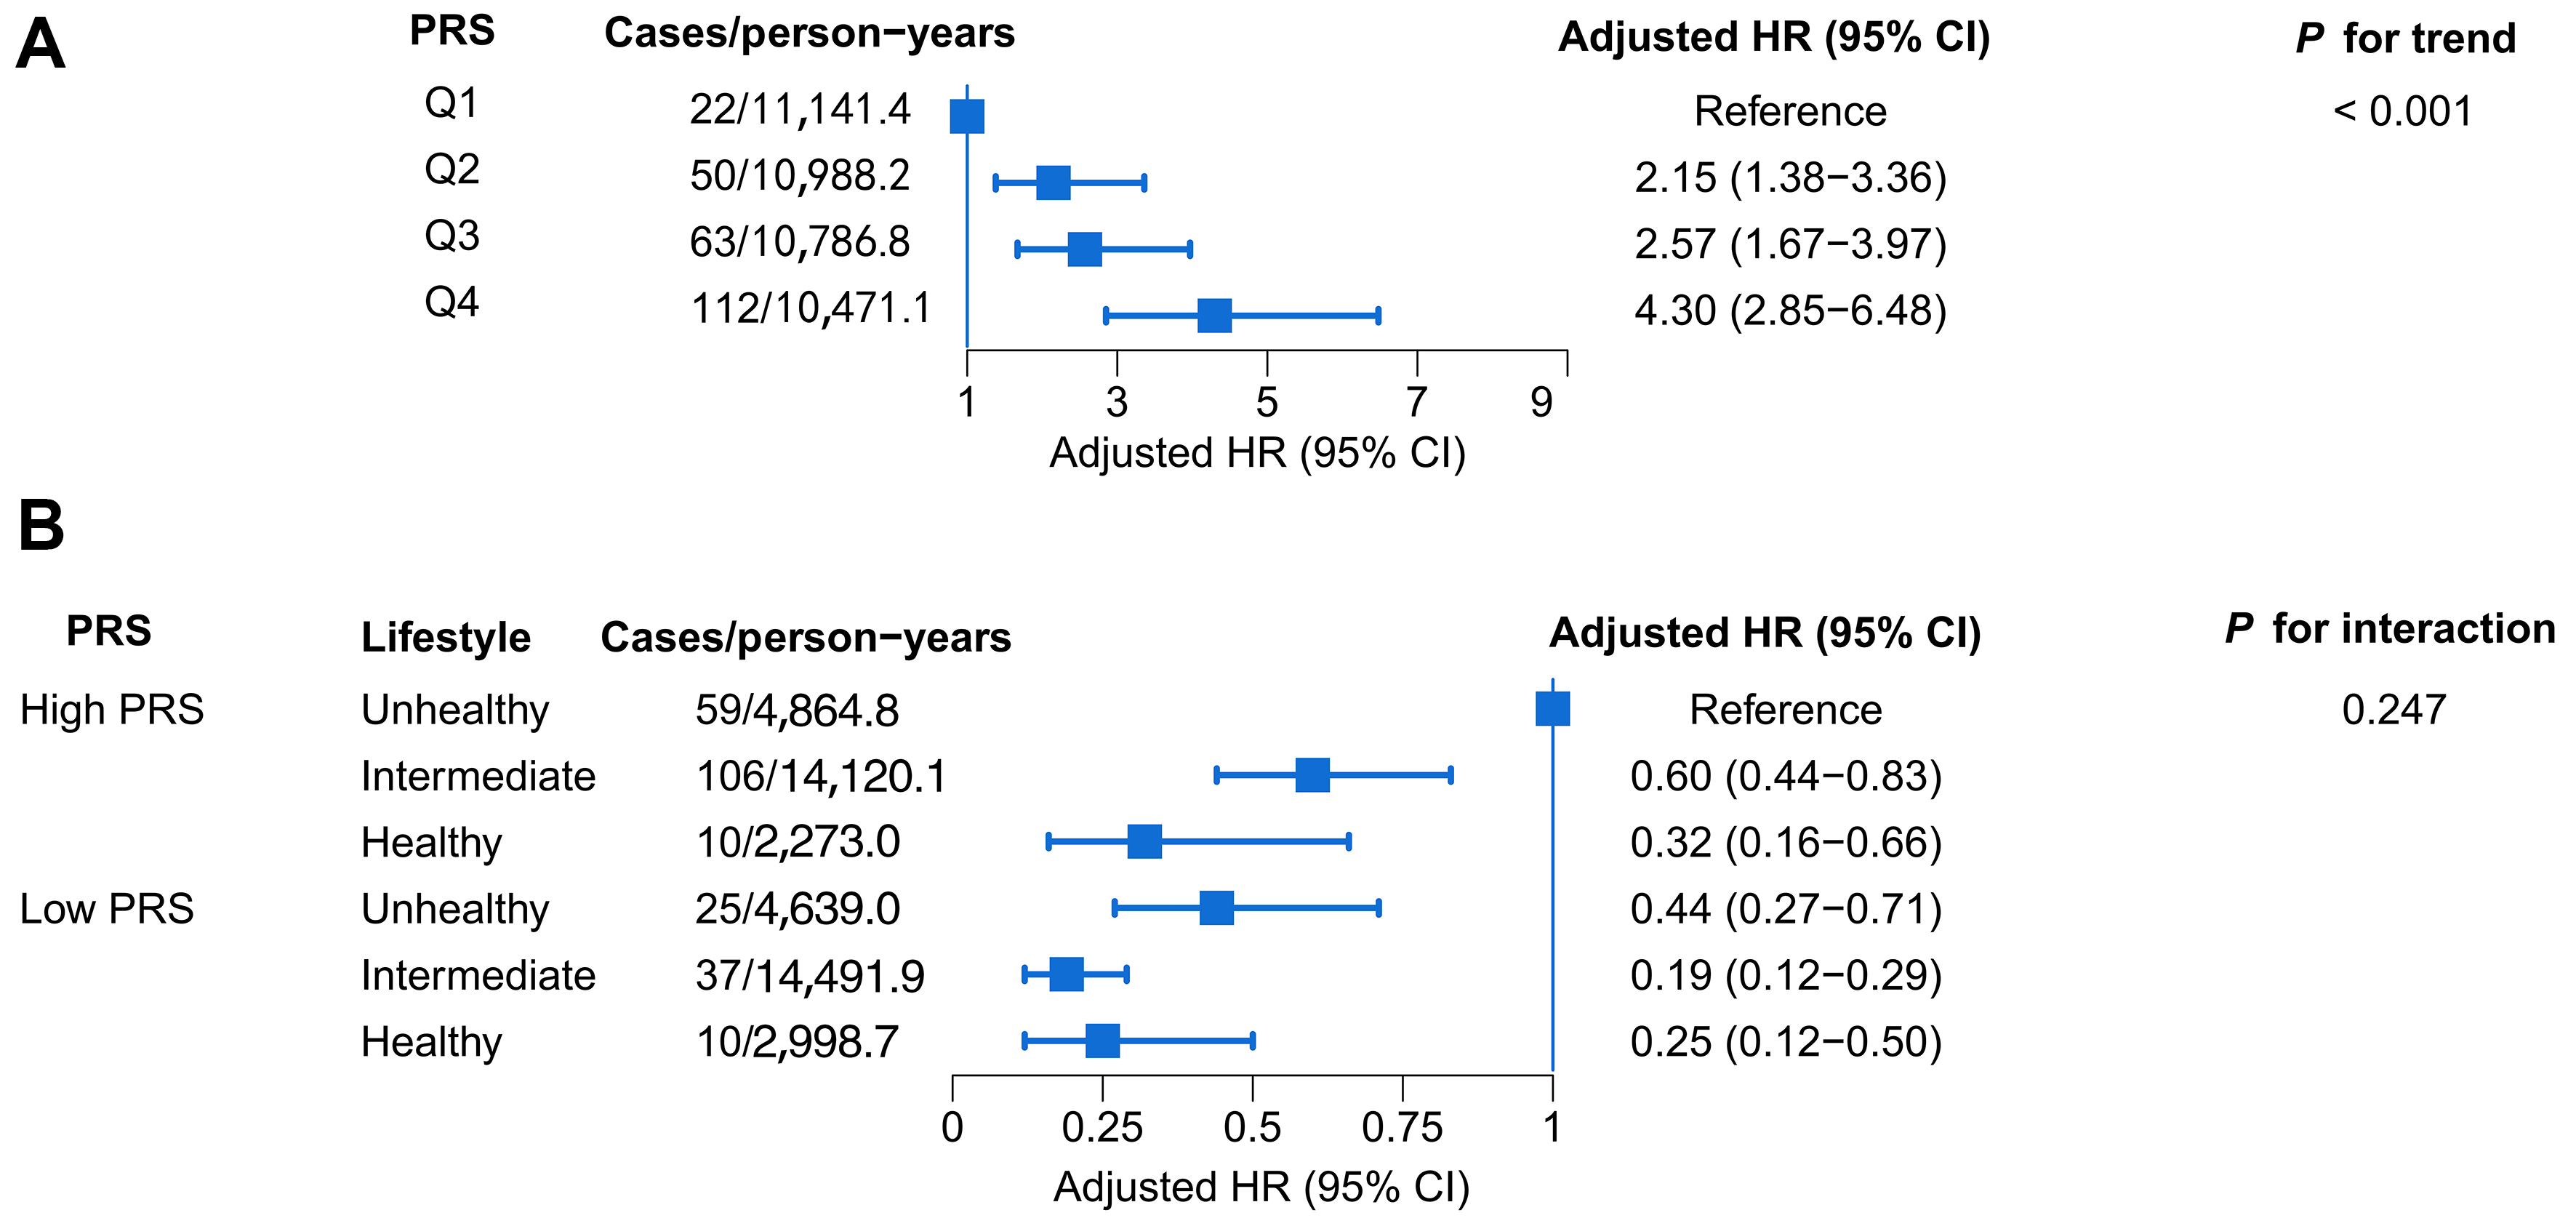
Figure 3. Independent effect of PRS and its combined effect with the lifestyle score on T2DM. (A) Independent effect of the PRS on T2DM risk. Participants were categorized into quartiles (Q1-Q4) based on the PRS, with Q1 serving as the reference group. The forest plot presents adjusted HRs and 95%CIs for each quartile. All models were adjusted for age, race/ethnicity, education level, parity, oral contraceptive use, family history of diabetes, and individual lifestyle factors (BMI, diet, physical activity, sleep, alcohol consumption, and smoking); (B) Combined effect of the PRS and lifestyle on T2DM risk. The PRS was collapsed into low genetic risk (Q1-Q2) and high genetic risk (Q3-Q4). A combined lifestyle score (range 0-6) was constructed from six healthy behaviors and classified as unhealthy (0-1 points), intermediate (2-3 points), or healthy (4-6 points). Cross-classification of genetic risk and lifestyle categories generated six joint groups. The forest plot presents HRs and 95%CIs, with the high genetic risk/unhealthy lifestyle group as the reference. Analyses were adjusted for age, race/ethnicity, education level, parity, oral contraceptive use, and family history of diabetes. The P value for interaction was derived from an interaction term between genetic risk categories and lifestyle categories. BMI: Body mass index; CI: confidence interval; HR: hazard ratio; PRS: polygenic risk score; Q1: quartile 1; Q2: quartile 2; Q3: quartile 3; Q4: quartile 4; T2DM: type 2 diabetes mellitus.
In a sensitivity analysis of a lifestyle score based on five factors (excluding BMI), the negative association between higher lifestyle scores and reduced T2DM risk remained robust. Compared with the reference group (0 points), the adjusted HRs and 95%CIs were 0.72 (0.43, 1.18) for 1 point, 0.55 (0.33, 0.89) for 2 points, 0.35 (0.20, 0.61) for 3 points, and 0.40 (0.20, 0.80) for ≥ 4 points. Across sensitivity analyses that excluded 16 participants diagnosed within the first two years of follow-up, used multiple imputation for missing covariates, and further adjusted for the Townsend Deprivation Index, menopausal status, social support, and medication use, the association between higher lifestyle scores and lower T2DM risk remained robust [Table 4]. In addition, the inverse association between a combined healthy lifestyle and T2DM risk was consistently observed in both women with a history of GDM (HR: 0.43; 95%CI: 0.24, 0.77 for healthy vs. unhealthy) and those with a history of HDP (HR: 0.21; 95%CI: 0.07, 0.59) [Supplementary Table 6].
Sensitivity analyses for the association between the combined lifestyle score and incident T2DM among women with prior GDM or HDP
| Combined lifestyle score | P for trend | |||||
| 0 | 1 | 2 | 3 | ≥ 4 | ||
| Sensitivity analysis 1a | ||||||
| Cases/person years | 22/1,561.0 | 78/8,383.3 | 92/15,481.7 | 38/11,937.2 | 17/6,024.3 | - |
| Model 1: HR (95%CI)b | Reference | 0.67 (0.42, 1.08) | 0.44 (0.27, 0.70) | 0.23 (0.14, 0.40) | 0.20 (0.11, 0.38) | < 0.001 |
| Model 2: HR (95%CI)c | Reference | 0.72 (0.43, 1.18) | 0.55 (0.33, 0.89) | 0.35 (0.20, 0.61) | 0.40 (0.20, 0.80) | < 0.001 |
| Sensitivity analysis 2d | ||||||
| Cases/person years | 15/1,478.3 | 66/8,017.9 | 82/15,130.8 | 50/13,466.2 | 18/5,270.0 | - |
| Model 1: HR (95%CI)b | Reference | 0.82 (0.47, 1.44) | 0.55 (0.32, 0.96) | 0.38 (0.21, 0.68) | 0.35 (0.18, 0.70) | < 0.001 |
| Model 2: HR (95%CI)e | Reference | 0.83 (0.47, 1.45) | 0.50 (0.29, 0.86) | 0.33 (0.19, 0.60) | 0.32 (0.16, 0.63) | < 0.001 |
| Sensitivity analysis 3f | ||||||
| Cases/person years | 19/1,637.2 | 76/8,431.5 | 97/15,982.1 | 57/14,123.3 | 21/5,358.6 | - |
| Model 1: HR (95%CI)b | Reference | 0.76 (0.45, 1.30) | 0.53 (0.31, 0.89) | 0.37 (0.21, 0.63) | 0.33 (0.17, 0.64) | < 0.001 |
| Model 2: HR (95%CI)e | Reference | 0.76 (0.45, 1.30) | 0.47 (0.28, 0.79) | 0.32 (0.18, 0.55) | 0.30 (0.15, 0.57) | < 0.001 |
| Sensitivity analysis 4g | ||||||
| Cases/person years | 17/1,480.7 | 69/8,023.2 | 88/15,140.4 | 54/13,471.6 | 19/5,271.7 | |
| Model 3: HR (95%CI)g | Reference | 0.66 (0.36, 1.22) | 0.43 (0.23, 0.78) | 0.34 (0.18, 0.63) | 0.33 (0.16, 0.69) | < 0.001 |
DISCUSSION
In women with prior GDM or HDP, adherence to a healthy lifestyle was associated with a substantially lower risk of T2DM, indicating a clear dose-response relationship. This inverse association remained consistent across levels of genetic susceptibility. Our findings have substantial clinical implications for reducing metabolic risk in women with prior adverse pregnancy outcomes. Notably, lifestyle factors were assessed at the UKB baseline (ages 40-69), on average 25 years after the index pregnancy complication. Therefore, our findings primarily reflect midlife lifestyle patterns and their long-term health associations, rather than perinatal or postpartum behaviors.
Our findings revealed a clear inverse dose-response relationship between the number of healthy lifestyle factors and T2DM risk among women with prior GDM or HDP. This finding was consistent with prospective studies of general populations[10-12]. In a rigorous meta-analysis of 14 studies comprising approximately 1 million participants, individuals following the most favorable lifestyle had a 75% lower risk of T2DM than those adhering to the least healthy lifestyle[11]. In addition, the associations remained broadly similar across socioeconomic strata and baseline characteristics. However, evidence remains limited among women with prior GDM or HDP, a group at very high risk of T2DM. Analyses of 4,275 women with prior GDM from the NHS-II reported that better adherence to five modifiable risk factors (a balanced diet, regular exercise, moderate alcohol consumption, current nonsmoking, and normal body weight) was linearly linked to a decreased risk of T2DM[16]. Adherence to all five healthy lifestyle factors was associated with a more than 90% lower risk of T2DM compared with adherence to none. Evidence from clinical trials in general populations also supports our work. A pooled analysis of 30 intervention studies revealed that lifestyle interventions reduced the overall risk of T2DM by 26% in women with prior GDM, particularly when initiated within one year postpartum; however, most interventions were limited to diet and/or physical activity[33]. The underlying mechanisms may involve oxidative stress and inflammatory pathways. Previous research has demonstrated that hyperglycemia and hypertension during pregnancy can trigger oxidative stress and chronic inflammation, thereby impairing β‑cell function and reducing insulin sensitivity[34,35]. A healthy lifestyle may partially mitigate the adverse effects of metabolic stress during pregnancy by alleviating oxidative stress and improving insulin signaling pathways, thereby lowering the risk of T2DM[36]. Additionally, even among women at high genetic risk, adherence to a combined lifestyle was associated with a lower risk of T2DM, suggesting that the protective effect of a combined lifestyle is not substantially constrained by genetic background. This observation echoes the findings of two previous studies among those who had prior GDM or in the general population[16,37]. These studies likewise emphasized that individuals at risk of developing T2DM should be encouraged to adopt healthier lifestyles, regardless of their genetic background.
Although our study identified adherence to all six modifiable lifestyle factors as the optimal target, no participants met all six criteria, and only 12% met four or more. Consistent with findings from large cohort studies[11], these results suggest that achieving a high overall lifestyle score is extremely uncommon in the population. Among modifiable lifestyle factors, maintaining a normal BMI appeared to be a key factor associated with a lower long-term T2DM risk among women with a history of GDM or HDP. Postpartum weight retention is common and may contribute to overweight and obesity in midlife[38]. Notably, intervention studies suggest that this elevated risk may be reversible. A randomized trial demonstrated that lifestyle interventions initiated during pregnancy and continued into the postpartum period can effectively promote weight loss and improve metabolic outcomes in this high-risk population. Specifically, a reduction of more than 2 kg within the first 6 months postpartum was associated with a significantly lower risk of metabolic syndrome[39]. Thus, personalized weight management could be a cornerstone of clinical care for women at high risk due to prior GDM or HDP. In addition, after adjusting for BMI, regular physical activity showed an independent inverse relationship with T2DM risk, which aligned with previous population-based evidence[40,41]. Both current and former smoking, as well as abnormal nocturnal sleep duration, were linked to an elevated risk of T2DM in our cohort, aligning with earlier reports[42,43]. However, we found no independent associations between diet quality and T2DM, in line with recent studies in women with prior GDM[16]. This null finding may be explained by several factors, including limited statistical power due to homogeneous dietary patterns, measurement errors inherent in self-reported dietary data, and potential attenuation of the independent association by other lifestyle factors, such as physical activity and BMI. Although current and prior research provides robust epidemiological evidence that moderate alcohol intake could be linked to a decreased risk of developing T2DM[44], we do not advocate its adoption as a preventive lifestyle intervention, given the substantial detrimental effects of alcohol on other health domains[45]. Given that lifestyle factors are interrelated, these findings highlight the benefits of adhering to an overall healthy lifestyle for reducing T2DM risk among women with prior GDM or HDP, even when only some components are achieved.
Several limitations need to be recognized. First, self-administered questionnaires for sociodemographic, lifestyle, and reproductive health data may have introduced recall and measurement bias. In addition, because lifestyle factors, particularly dietary patterns, vary across cultural contexts, the lifestyle measures used in the UKB might not be entirely applicable to other groups, including Asian populations. However, the core components of a healthy lifestyle, such as a well-balanced diet, regular physical activity, maintaining a healthy weight, and avoiding smoking, are widely recognized across populations. Therefore, the overall finding that following a combined healthy lifestyle could lower T2DM risk is likely to have broad relevance. Moreover, because the lifestyle score was based on routinely collected questionnaire data, it may be readily applied in clinical and community settings, enhancing its translational potential. Second, although the sample size was moderate, it was still small for subgroup analyses and for assessing the interaction between combined lifestyle and genetic predisposition. Third, despite adjustment for a range of potential confounders, residual confounding by unmeasured factors may still exist, such as postpartum weight change trajectories. Future studies with more detailed data on these factors are needed to confirm our findings. Fourth, although we excluded T2DM cases diagnosed within the first two years of follow-up to minimize reverse causality, undiagnosed prediabetes at baseline may still have influenced lifestyle behaviors. Repeated longitudinal assessments beginning in the early postpartum period, together with complementary causal inference approaches such as Mendelian randomization analyses, would help strengthen causal inference. Fifth, because the UKB study population had relatively high socioeconomic status, whether these findings are generalizable to other populations remains unclear. Replication in more socioeconomically and culturally diverse populations is needed to assess generalizability and inform culturally appropriate recommendations.
In conclusion, among women with prior GDM or HDP, a higher combined lifestyle score was associated with a reduced risk of incident T2DM. The protective effect remained significant even among those at high genetic risk. These findings underscore the potential importance of adherence to a combined healthy lifestyle in reducing T2DM risk in this high-risk population.
DECLARATIONS
Acknowledgments
This work uses data provided by patients and collected by the NHS as part of their care and support. Pan XF had access to the individual-level data. The authors thank the participants and staff of the UK Biobank for their invaluable contributions. All illustrations and graphical elements in the Graphical Abstract were created and used under a Flaticon Premium license (https://www.flaticon.com).
Authors’ contributions
Conceived the study: Zhao Y, Pan XF
Analyzed the data and drafted the first manuscript: Zhao Y
Provided critical revisions to the manuscript’s important intellectual content: Zhao Y, Li R, He Q, Wang Y, Luo X, Wang T, Li F, Dong Y, He X, Zhang S, Xue Q, Wen Y, Yang Y, Pan XF
All authors contributed to the interpretation of the data and approved the final version of the manuscript.
Availability of data and materials
The datasets are available upon reasonable request to the Access Management System (AMS) through the UK Biobank website (https://www.ukbiobank.ac.uk/use-our-data/apply-for-access).
AI and AI-assisted tools statement
During the preparation of this manuscript, the AI tool ChatGPT (version 4.0, released 2023-03-14) was used solely for language editing. The tool did not influence the study design, data collection, analysis, interpretation, or the scientific content of the work. All authors take full responsibility for the accuracy, integrity, and final content of the manuscript.
Financial support and sponsorship
Pan XF was sponsored by the National Natural Science Foundation of China (No. 82473646). Li F was funded by the National Natural Science Foundation of China (No. 62506250), the China Postdoctoral Science Foundation (No. 2024M762216), and the Sichuan Provincial Natural Science Foundation (No. 2025ZNSFSC1467). Wang T was funded by the Sichuan Provincial Natural Science Foundation (No. 2026NSFSC1489). Dong Y was funded by the Sichuan Provincial Natural Science Foundation (No. 2026NSFSC1668).
Conflicts of interest
All authors declared that there are no conflicts of interest.
Ethical approval and consent to participate
The UK Biobank study received ethical approval from the North West Multi-Centre Research Ethics Committee (REC reference: 21/NW/0157, IRAS project ID: 299116), and all participants provided written informed consent. The present analysis was conducted under UK Biobank Application Number 103011 and required no additional institutional ethical approval because only de-identified data were used.
Consent for publication
Not applicable.
Copyright
© The Author(s) 2026.
Supplementary Materials
REFERENCES
1. Wang H, Li N, Chivese T, et al.; IDF Diabetes Atlas Committee Hyperglycaemia in Pregnancy Special Interest Group. IDF diabetes atlas: estimation of global and regional gestational diabetes mellitus prevalence for 2021 by International Association of Diabetes in Pregnancy Study Group’s Criteria. Diabetes Res Clin Pract. 2022;183:109050.
2. Jiang L, Tang K, Magee LA, et al. A global view of hypertensive disorders and diabetes mellitus during pregnancy. Nat Rev Endocrinol. 2022;18:760-75.
3. Dennison RA, Chen ES, Green ME, et al. The absolute and relative risk of type 2 diabetes after gestational diabetes: a systematic review and meta-analysis of 129 studies. Diabetes Res Clin Pract. 2021;171:108625.
4. Zhao G, Bhatia D, Jung F, Lipscombe L. Risk of type 2 diabetes mellitus in women with prior hypertensive disorders of pregnancy: a systematic review and meta-analysis. Diabetologia. 2021;64:491-503.
5. Thong EP, Ghelani DP, Manoleehakul P, et al. Optimising cardiometabolic risk factors in pregnancy: a review of risk prediction models targeting gestational diabetes and hypertensive disorders. J Cardiovasc Dev Dis. 2022;9:55.
6. Sweeting A, Wong J, Murphy HR, Ross GP. A clinical update on gestational diabetes mellitus. Endocr Rev. 2022;43:763-93.
7. Hula N, Escalera D, Goulopoulou S. Extracellular vesicles in preeclampsia: drivers of vascular dysfunction and inflammation. Am J Physiol Heart Circ Physiol. 2025;329:H1560-74.
8. Tossetta G, Fantone S, Gesuita R, et al. HtrA1 in gestational diabetes mellitus: a possible biomarker? Diagnostics 2022;12:2705.
9. Osei-Safo EK, McIntosh J, Onwuka S, et al. What is my risk? A mixed-methods systematic review of risk perception for cardiometabolic pregnancy complications and future cardiometabolic disease development. Obes Rev. 2025;26:e13967.
10. Cao Y, Shrestha A, Janiczak A, Li X, Lu Y, Haregu T. Lifestyle intervention in reducing insulin resistance and preventing type 2 diabetes in asia pacific region: a systematic review and meta-analysis. Curr Diab Rep. 2024;24:207-15.
11. Zhang Y, Pan XF, Chen J, et al. Combined lifestyle factors and risk of incident type 2 diabetes and prognosis among individuals with type 2 diabetes: a systematic review and meta-analysis of prospective cohort studies. Diabetologia. 2020;63:21-33.
12. Uusitupa M, Khan TA, Viguiliouk E, et al. Prevention of type 2 diabetes by lifestyle changes: a systematic review and meta-analysis. Nutrients. 2019;11:2611.
13. Crandall JP, Dabelea D, Knowler WC, Nathan DM, Temprosa M; DPP Research Group. The diabetes prevention program and its outcomes study: NIDDK’s journey into the prevention of type 2 diabetes and its public health impact. Diabetes Care. 2025;48:1101-11.
14. Lindström J, Valtanen M, Wikström K, et al. Long-term efficacy of type 2 diabetes prevention: the Finnish Diabetes Prevention Study DPS. Eur J Public Health. 2025;35:ckaf161.019.
15. Knowler WC, Doherty L, Edelstein SL, et al.; DPP/DPPOS Research Group. Long-term effects and effect heterogeneity of lifestyle and metformin interventions on type 2 diabetes incidence over 21 years in the US Diabetes Prevention Program randomised clinical trial. Lancet Diabetes Endocrinol. 2025;13:469-81.
16. Yang J, Qian F, Chavarro JE, et al. Modifiable risk factors and long term risk of type 2 diabetes among individuals with a history of gestational diabetes mellitus: prospective cohort study. BMJ. 2022;378:e070312.
17. Timpka S, Stuart JJ, Tanz LJ, Hu FB, Franks PW, Rich-Edwards JW. Postpregnancy BMI in the progression from hypertensive disorders of pregnancy to type 2 diabetes. Diabetes Care. 2019;42:44-9.
18. Bycroft C, Freeman C, Petkova D, et al. The UK Biobank resource with deep phenotyping and genomic data. Nature. 2018;562:203-9.
19. Xu X, Li J, Yu Y, et al. Association of combined healthy lifestyle with risk of adverse outcomes in patients with prediabetes. Diabetes Metab Res Rev. 2024;40:e3795.
20. Schulz CA, Weinhold L, Schmid M, Nöthen MM, Nöthlings U. Analysis of associations between dietary patterns, genetic disposition, and cognitive function in data from UK Biobank. Eur J Nutr. 2023;62:511-21.
21. Bull FC, Al-Ansari SS, Biddle S, et al. World Health Organization 2020 guidelines on physical activity and sedentary behaviour. Br J Sports Med. 2020;54:1451-62.
22. Arthur RS, Wang T, Xue X, Kamensky V, Rohan TE. Genetic factors, adherence to healthy lifestyle behavior, and risk of invasive breast cancer among women in the UK Biobank. J Natl Cancer Inst. 2020;112:893-901.
23. Gao Y, Chen Y, Hu M, et al. Lifestyle trajectories and ischaemic heart diseases: a prospective cohort study in UK Biobank. Eur J Prev Cardiol. 2023;30:393-403.
24. Lloyd-Jones DM, Hong Y, Labarthe D, et al.; American Heart Association Strategic Planning Task Force and Statistics Committee. Defining and setting national goals for cardiovascular health promotion and disease reduction: the American Heart Association’s strategic Impact Goal through 2020 and beyond. Circulation. 2010;121:586-613.
25. Thompson DJ, Wells D, Selzam S, et al. UK Biobank release and systematic evaluation of optimised polygenic risk scores for 53 diseases and quantitative traits. medRxiv. 2022;2022.06.16.22276246.
26. Lee CL, Yamada T, Liu WJ, Hara K, Yanagimoto S, Hiraike Y. Interaction between type 2 diabetes polygenic risk and physical activity on cardiovascular outcomes. Eur J Prev Cardiol. 2024;31:1277-85.
27. Jiang X, Yang G, Feng N, Du X, Xu L, Zhong VW. Lifestyle modifies the associations of early-life smoking behaviors and genetic susceptibility with type 2 diabetes: a prospective cohort study involving 433,872 individuals from UK Biobank. Diabetes Metab Syndr. 2024;18:103090.
28. American Diabetes Association Professional Practice Committee for Diabetes*. 2. Diagnosis and classification of diabetes: standards of care in diabetes-2026. Diabetes Care. 2026;49:S27-49.
29. Beydoun MA, Georgescu MF, Weiss J, et al. Socioeconomic area deprivation and its relationship with dementia, Parkinson’s Disease and all-cause mortality among UK older adults: a multistate modeling approach. Soc Sci Med. 2025;379:118137.
30. Hu Y, Tang R, Li X, et al. Spontaneous miscarriage and social support in predicting risks of depression and anxiety: a cohort study in UK Biobank. Am J Obstet Gynecol. 2024;231:655.e1-9.
31. Plumpton CO, Morris T, Hughes DA, White IR. Multiple imputation of multiple multi-item scales when a full imputation model is infeasible. BMC Res Notes. 2016;9:45.
32. Marshall A, Altman DG, Holder RL, Royston P. Combining estimates of interest in prognostic modelling studies after multiple imputation: current practice and guidelines. BMC Med Res Methodol. 2009;9:57.
33. Ukke GG, Boyle JA, Reja A, et al. A systematic review and meta-analysis of type 2 diabetes prevention through lifestyle interventions in women with a history of gestational diabetes-a summary of participant and intervention characteristics. Nutrients. 2024;16:4413.
34. Mittal R, Prasad K, Lemos JRN, Arevalo G, Hirani K. Unveiling gestational diabetes: an overview of pathophysiology and management. Int J Mol Sci. 2025;26:2320.
35. Phoswa WN, Khaliq OP. The role of oxidative stress in hypertensive disorders of pregnancy (preeclampsia, gestational hypertension) and metabolic disorder of pregnancy (gestational diabetes mellitus). Oxid Med Cell Longev. 2021;2021:5581570.
36. Caturano A, Rocco M, Tagliaferri G, et al. Oxidative stress and cardiovascular complications in type 2 diabetes: from pathophysiology to lifestyle modifications. Antioxidants. 2025;14:72.
37. Li H, Khor CC, Fan J, et al. Genetic risk, adherence to a healthy lifestyle, and type 2 diabetes risk among 550,000 Chinese adults: results from 2 independent Asian cohorts. Am J Clin Nutr. 2020;111:698-707.
38. Rong K, Yu K, Han X, et al. Pre-pregnancy BMI, gestational weight gain and postpartum weight retention: a meta-analysis of observational studies. Public Health Nutr. 2015;18:2172-82.
39. Tsoi KY, Chan RCM, Zhang C, Tam WH, Ma RCW. A randomized controlled trial to evaluate the effects of an early postnatal lifestyle modification program on diet, adiposity and metabolic outcome in mothers with gestational diabetes mellitus. Int J Gynaecol Obstet. 2024;166:1170-82.
40. Liang Z, Zhang M, Wang C, et al. The best exercise modality and dose to reduce glycosylated hemoglobin in patients with type 2 diabetes: a systematic review with pairwise, network, and dose-response meta-analyses. Sports Med. 2024;54:2557-70.
41. Aune D, Norat T, Leitzmann M, Tonstad S, Vatten LJ. Physical activity and the risk of type 2 diabetes: a systematic review and dose-response meta-analysis. Eur J Epidemiol. 2015;30:529-42.
42. Yu Y, Li Y, Nguyen TT, et al. Association between smoking cessation and risk for type 2 diabetes, stratified by post-cessation weight change: a systematic review and meta-analysis. Prev Med. 2026;202:108429.
43. Liu H, Zhu H, Lu Q, et al. Sleep features and the risk of type 2 diabetes mellitus: a systematic review and meta-analysis. Ann Med. 2025;57:2447422.
44. Li X, Hur J, Smith-Warner SA, et al. Alcohol intake, drinking pattern, and risk of type 2 diabetes in three prospective cohorts of U.S. women and men. Diabetes Care. 2025;48:1189-97.
Cite This Article
 Open Access
How to Cite
Zhao Y, Li R, He Q, Wang Y, Luo X, Wang T, Li F, Dong Y, He X, Zhang S, Xue Q, Wen Y, Yang Y, Pan XF. Combined lifestyle and type 2 diabetes mellitus among women with a history of GDM or HDP. Metab Target Organ Damage. 2026;6:58. https://dx.doi.org/10.20517/mtod.2026.155
Download Citation
If you have the appropriate software installed, you can download article citation data to the citation manager of your choice. Simply select your manager software from the list below and click on download.
Export Citation File
Type of Import
Tips on Downloading Citation
Citation Manager File Format
Type of Import
Direct Import: When the Direct Import option is selected (the default state), a dialogue box will give you the option to Save or Open the downloaded citation data. Choosing Open will either launch your citation manager or give you a choice of applications with which to use the metadata. The Save option saves the file locally for later use.
Indirect Import: When the Indirect Import option is selected, the metadata is displayed and may be copied and pasted as needed.
About This Article
Copyright

Data & Comments
Data
0











Comments
Comments must be written in English. Spam, offensive content, impersonation, and private information will not be permitted. If any comment is reported and identified as inappropriate content by OAE staff, the comment will be removed without notice. If you have any queries or need any help, please contact us at support@oaepublish.com.