


fig2
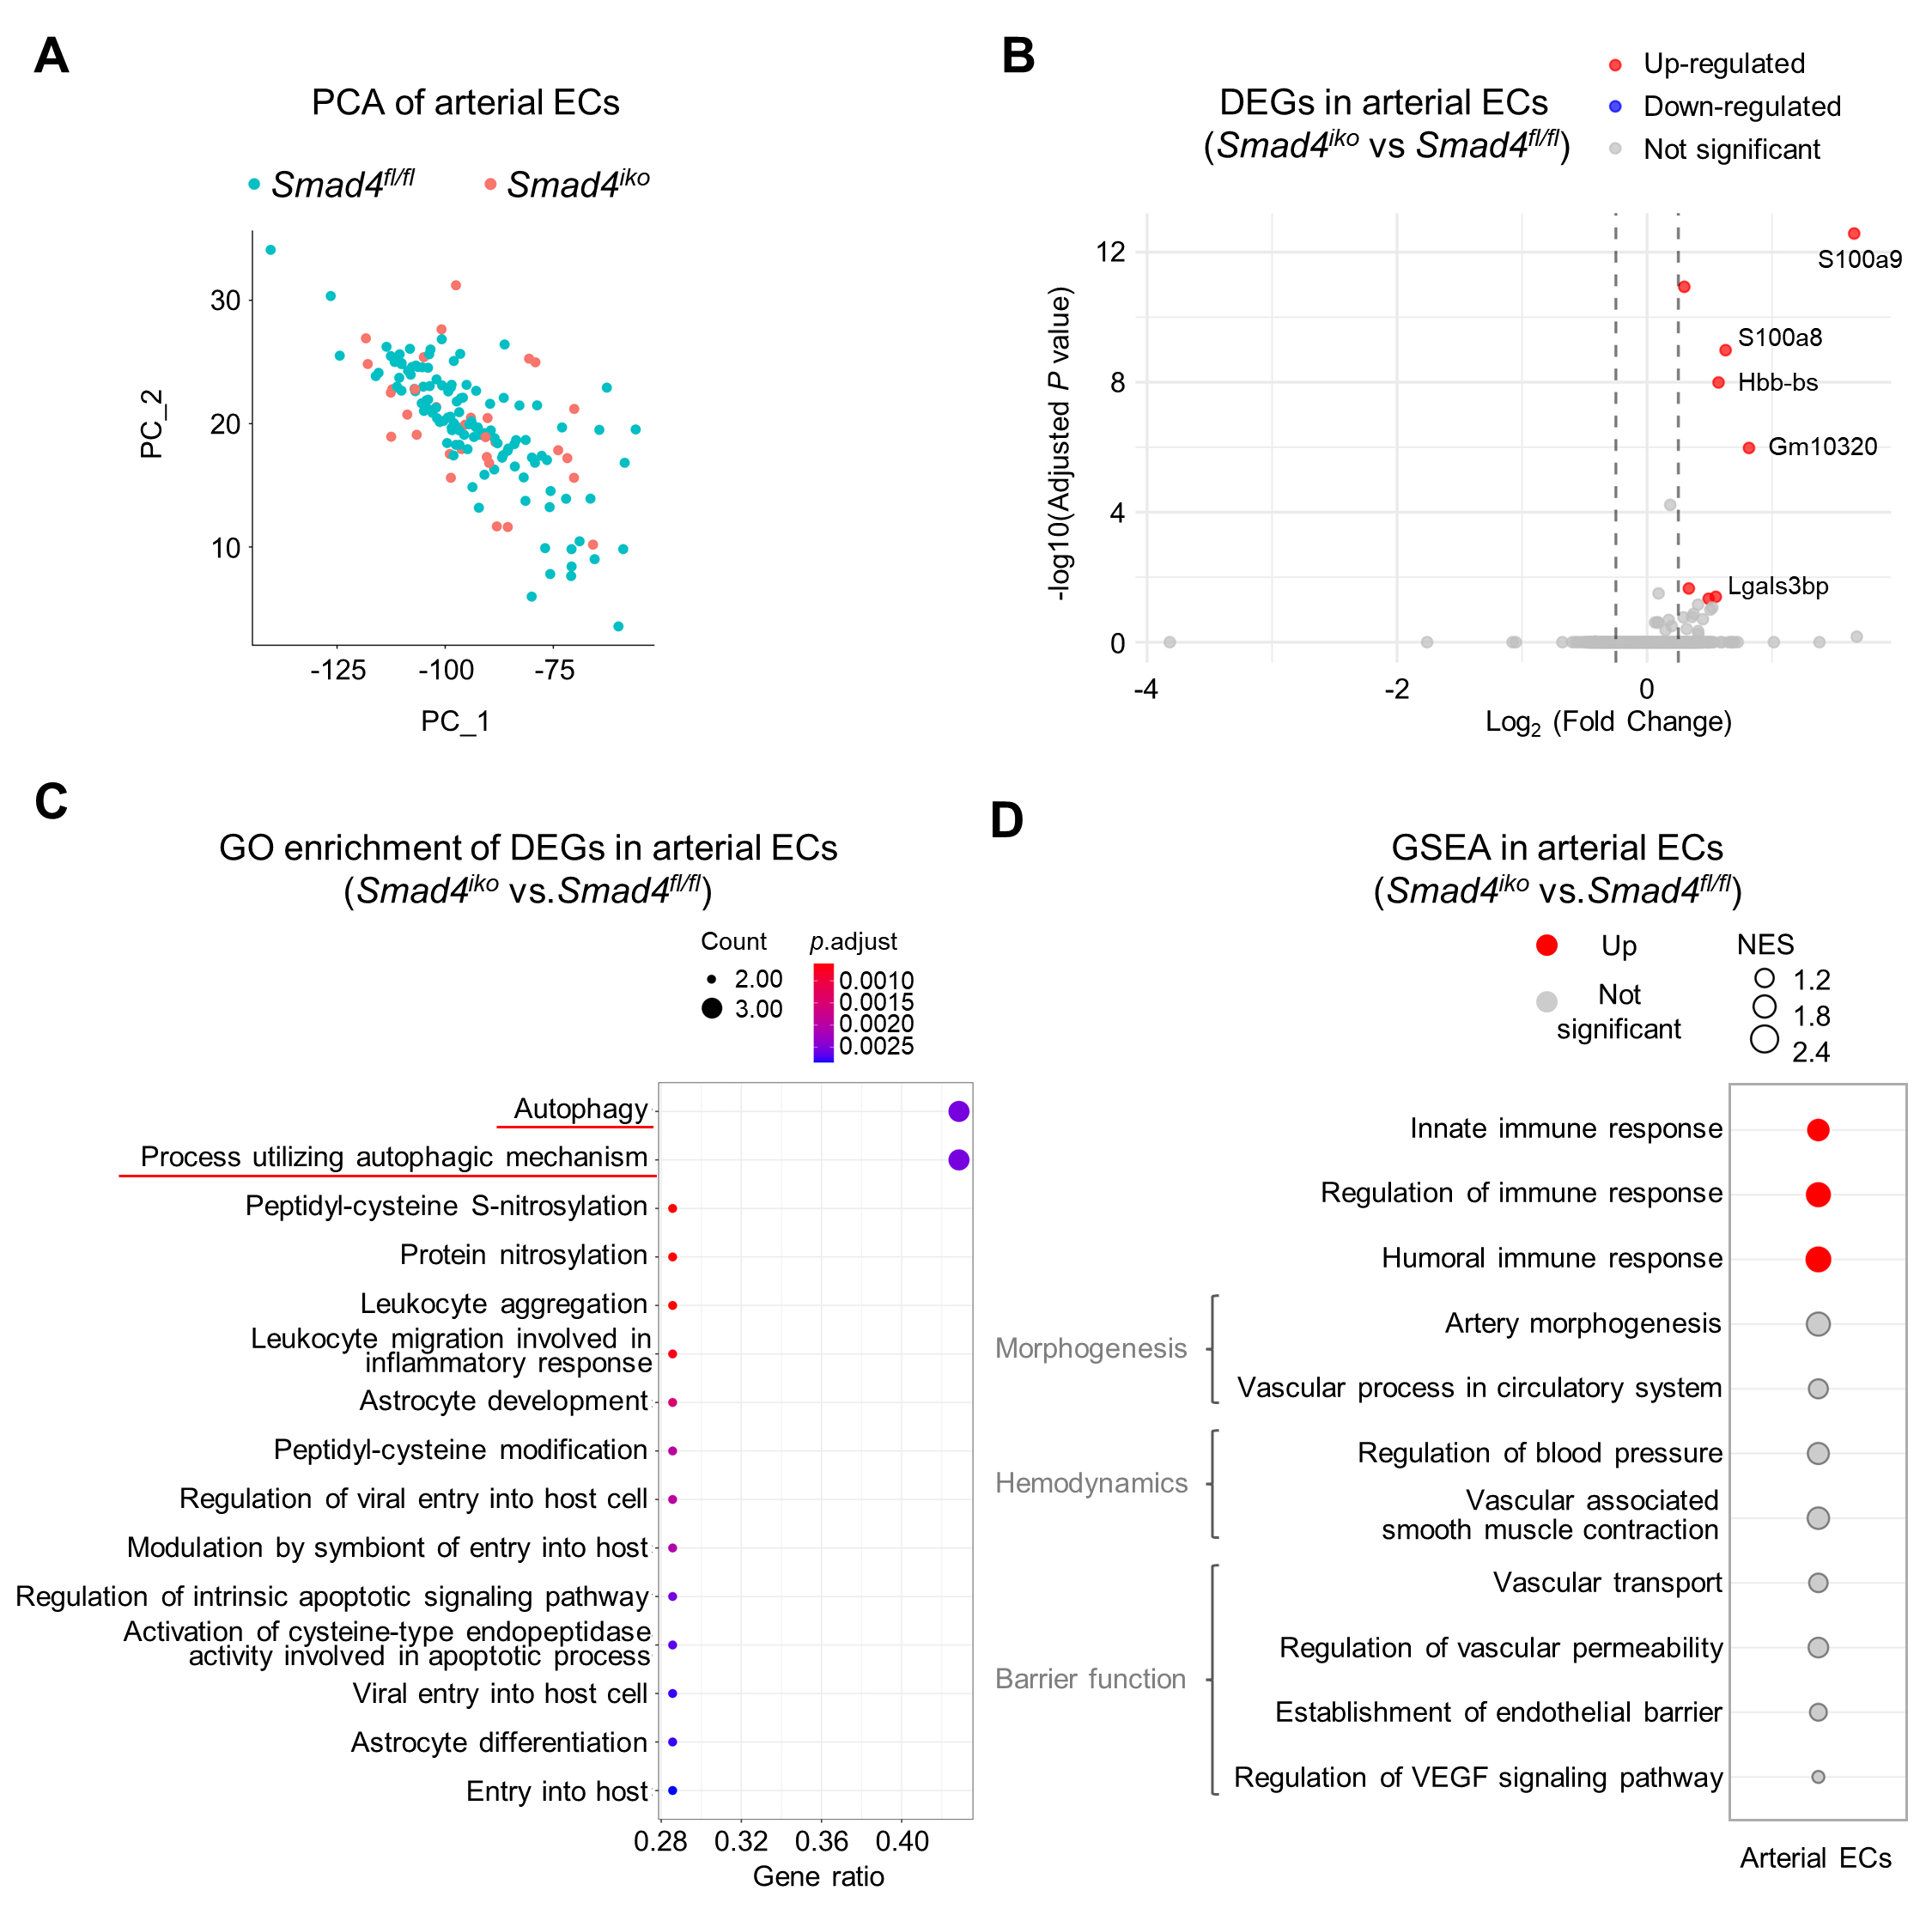
Figure 2. Transcriptomic profiling showing minimal alterations in pulmonary arterial ECs upon Smad4 loss. (A) Principal component analysis (PCA) of pulmonary arterial ECs between Smad4fl/fl and Smad4iko genotypes. Note largely overlapping distribution of ECs with the two genotypes, indicating their transcriptomic similarity. (B) Volcano plot analysis of differentially expressed genes (DEGs) in Smad4iko vs. Smad4fl/fl pulmonary arterial ECs. Upregulated and downregulated genes are labeled in red and blue, respectively. Note that only a few genes are modestly upregulated (see gene symbols). (C) Gene Ontology (GO) enrichment analysis of DEGs from arterial ECs. Note that only a small subset of biological processes displayed mild enrichment, including autophagy and immune response pathways (red lines). (D) Gene set enrichment analysis (GSEA) showing the expression profile of the indicated functional processes in Smad4iko vs. Smad4fl/fl pulmonary arterial ECs. NES: normalized enrichment score.


