


fig5
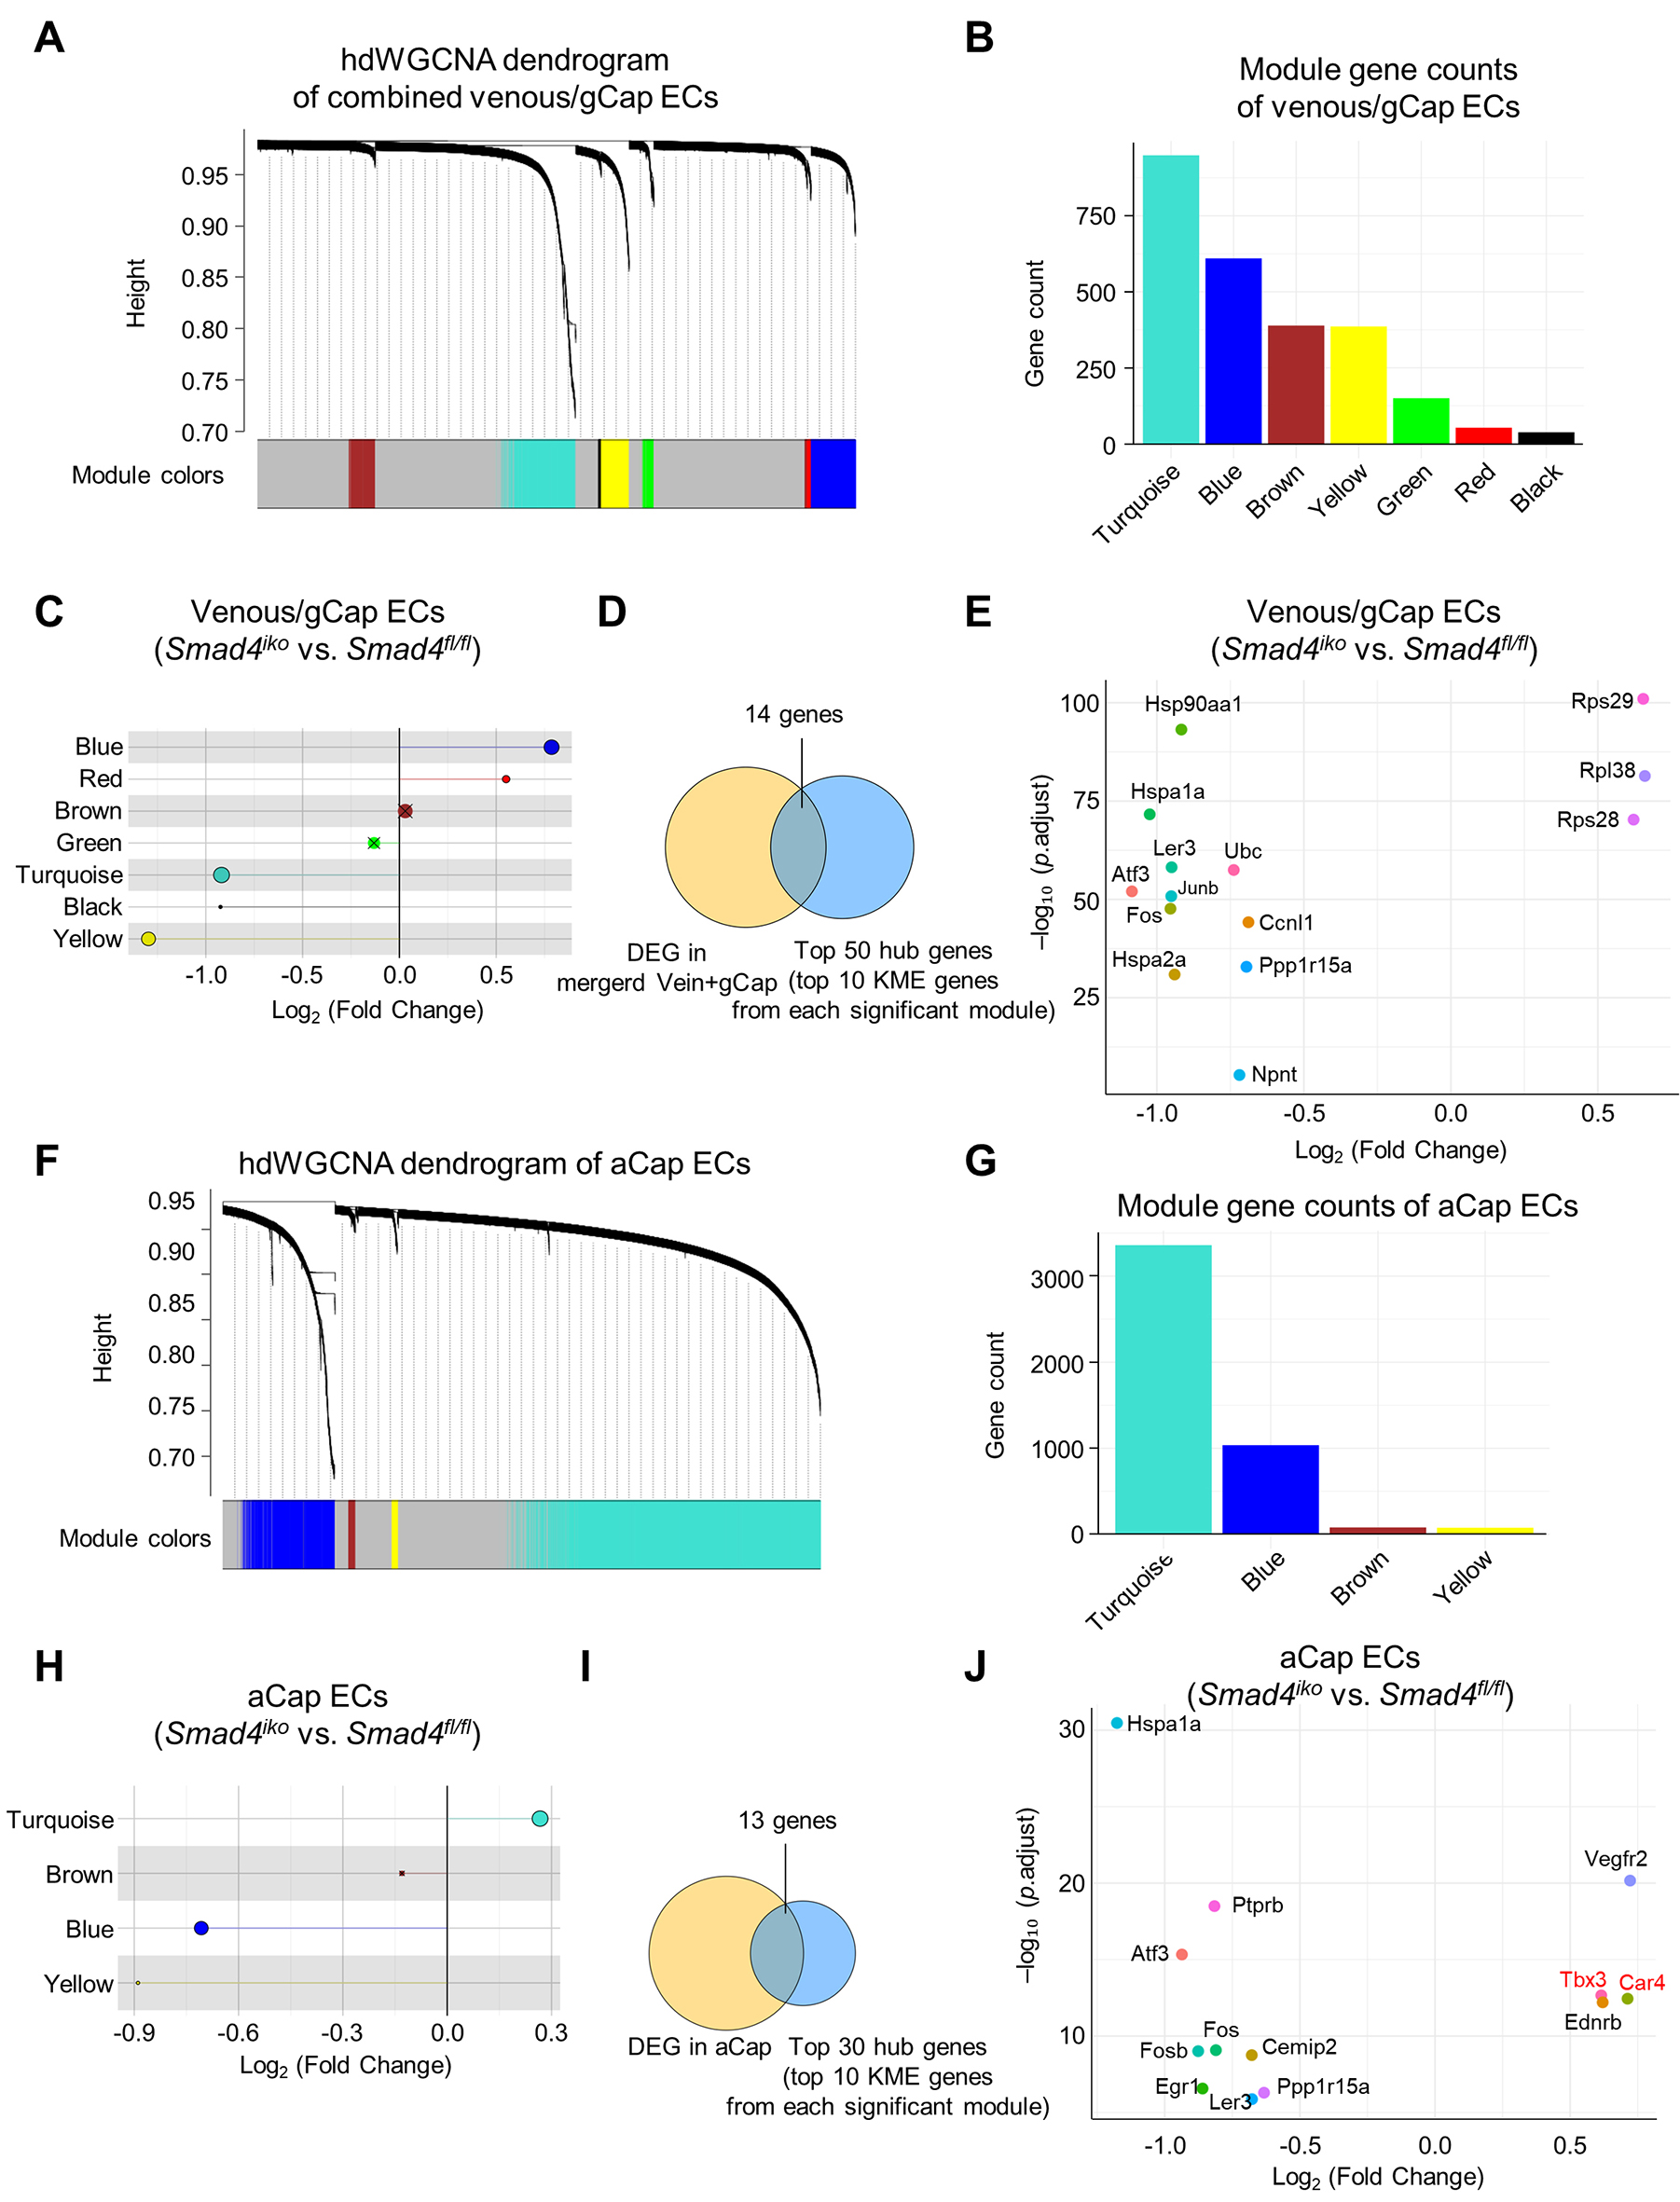
Figure 5. hdWGCNA identification of co-expression modules and hub genes within Smad4-null venous/gCap and aCap ECs. (A and F) Gene cluster dendrogram with color module assignments, as determined by high-dimensional weighted gene co-expression network analysis (hdWGCNA) of pulmonary venous/gCap (A) or aCap ECs (F) from both Smad4fl/fl and Smad4iko mice based on a Metacell-based approach. (B and G) Number of genes in co-expression modules as identified in (A) or (F). (C and H) Lollipop plot showing differentially expressed modules in Smad4fl/fl and Smad4iko pulmonary venous/gCap (C) or aCap ECs (H), as determined by module eigengene analysis. Crosses (X) indicate that the modules are not significantly expressed. (D and I) Venn diagram showing the intersection between DEGs and top hub-gene candidates (top 10 kME genes per significant module) in pulmonary venous/gCap (D) or aCap ECs (I), yielding 14 or 13 high-confidence hub genes, respectively. (E and J) Dot plot showing expression pattern of the high-confidence hub genes, as identified in (D) or (I).


