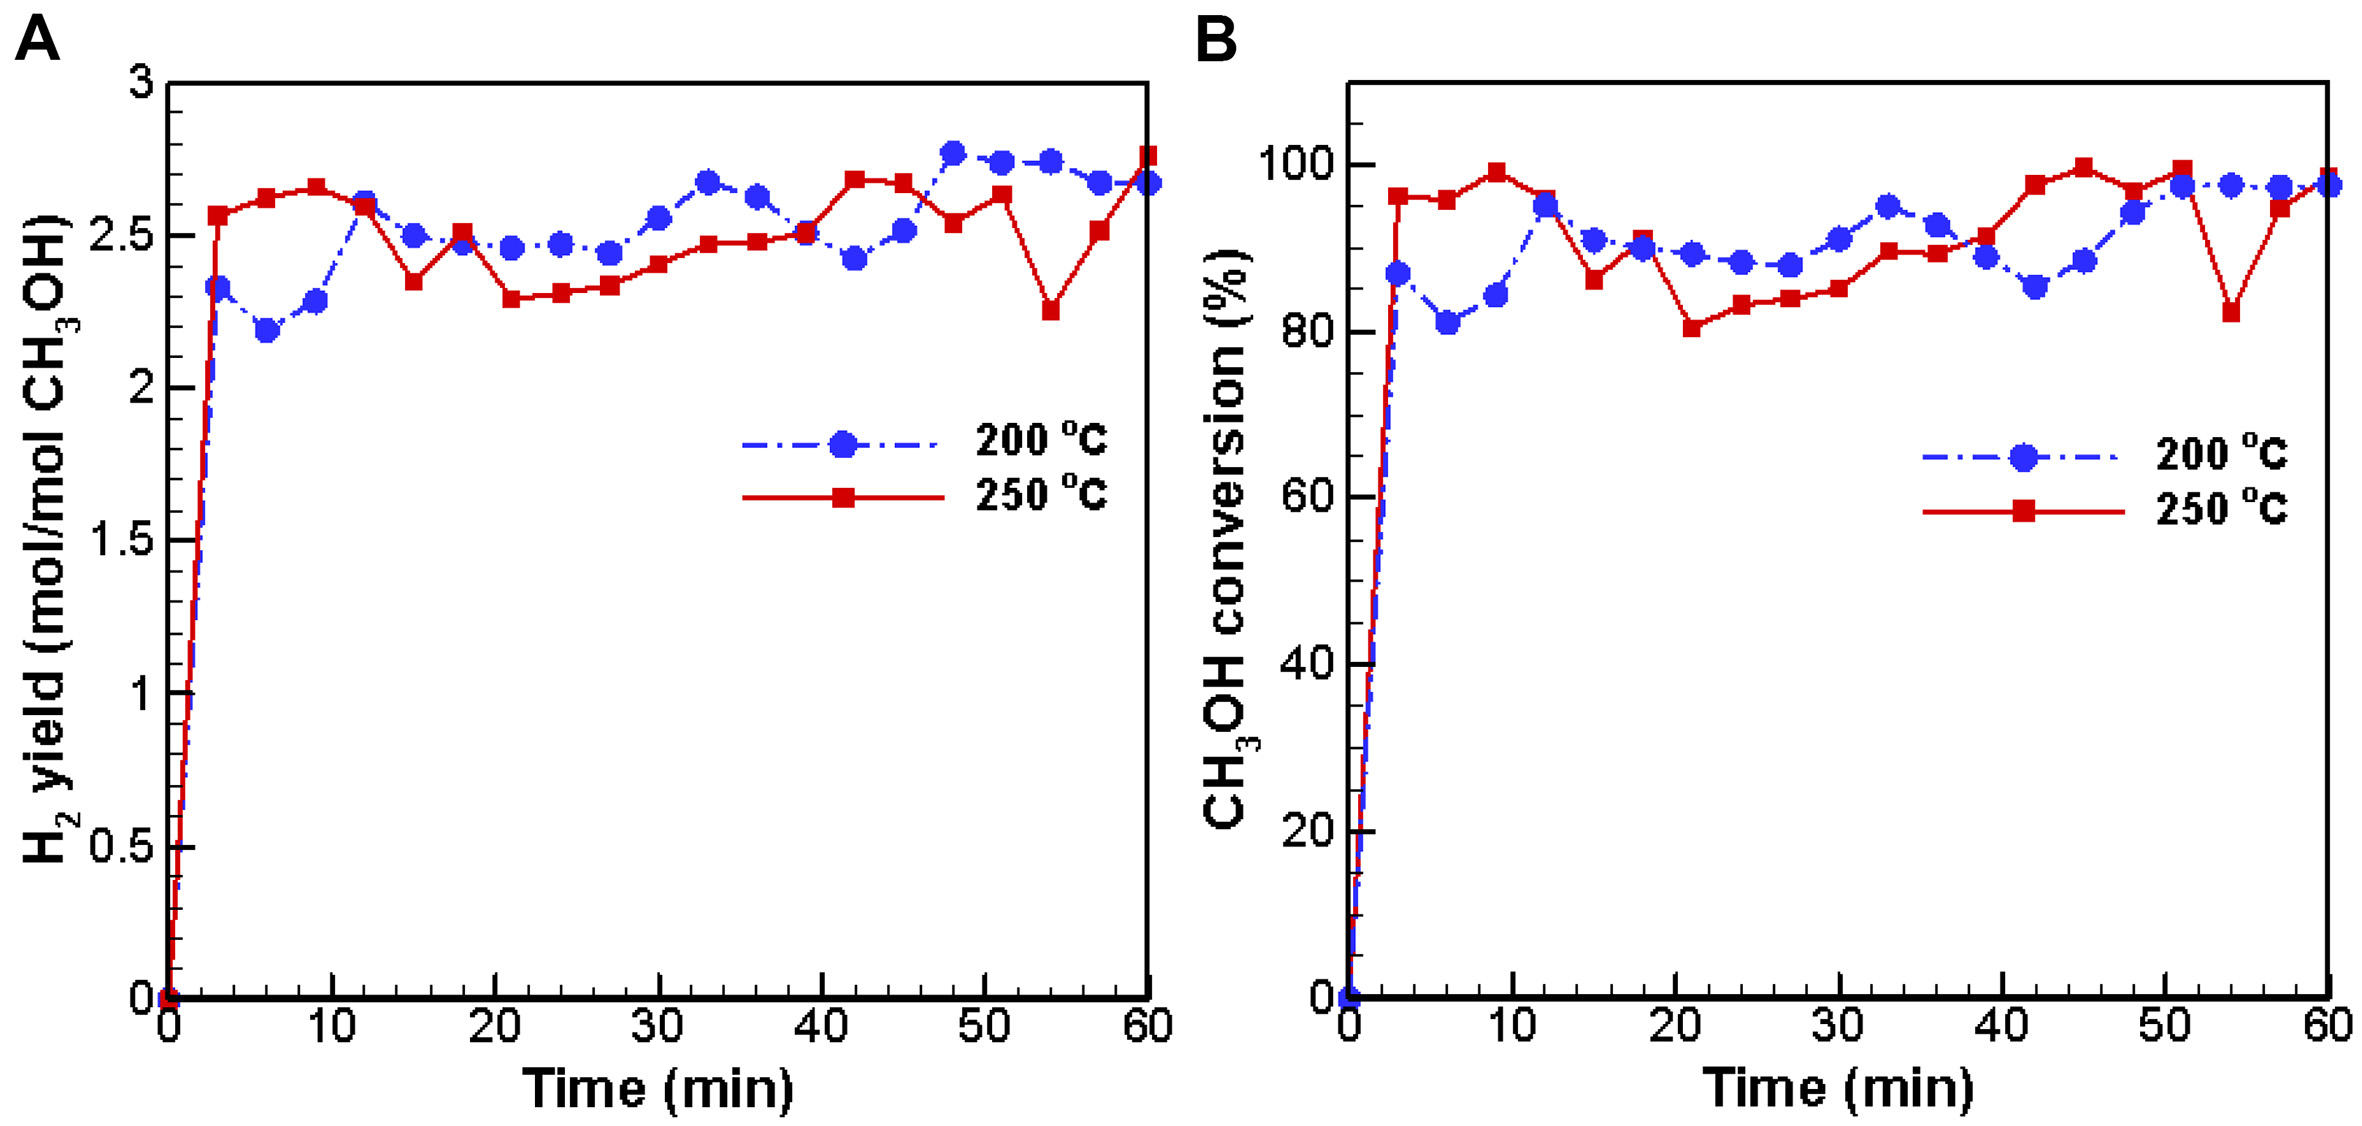
Figure 8. Conversion time profiles of (A) hydrogen yield and (B) methanol at 200 °C (Case 1) and 250 °C (Case 2).