

fig2
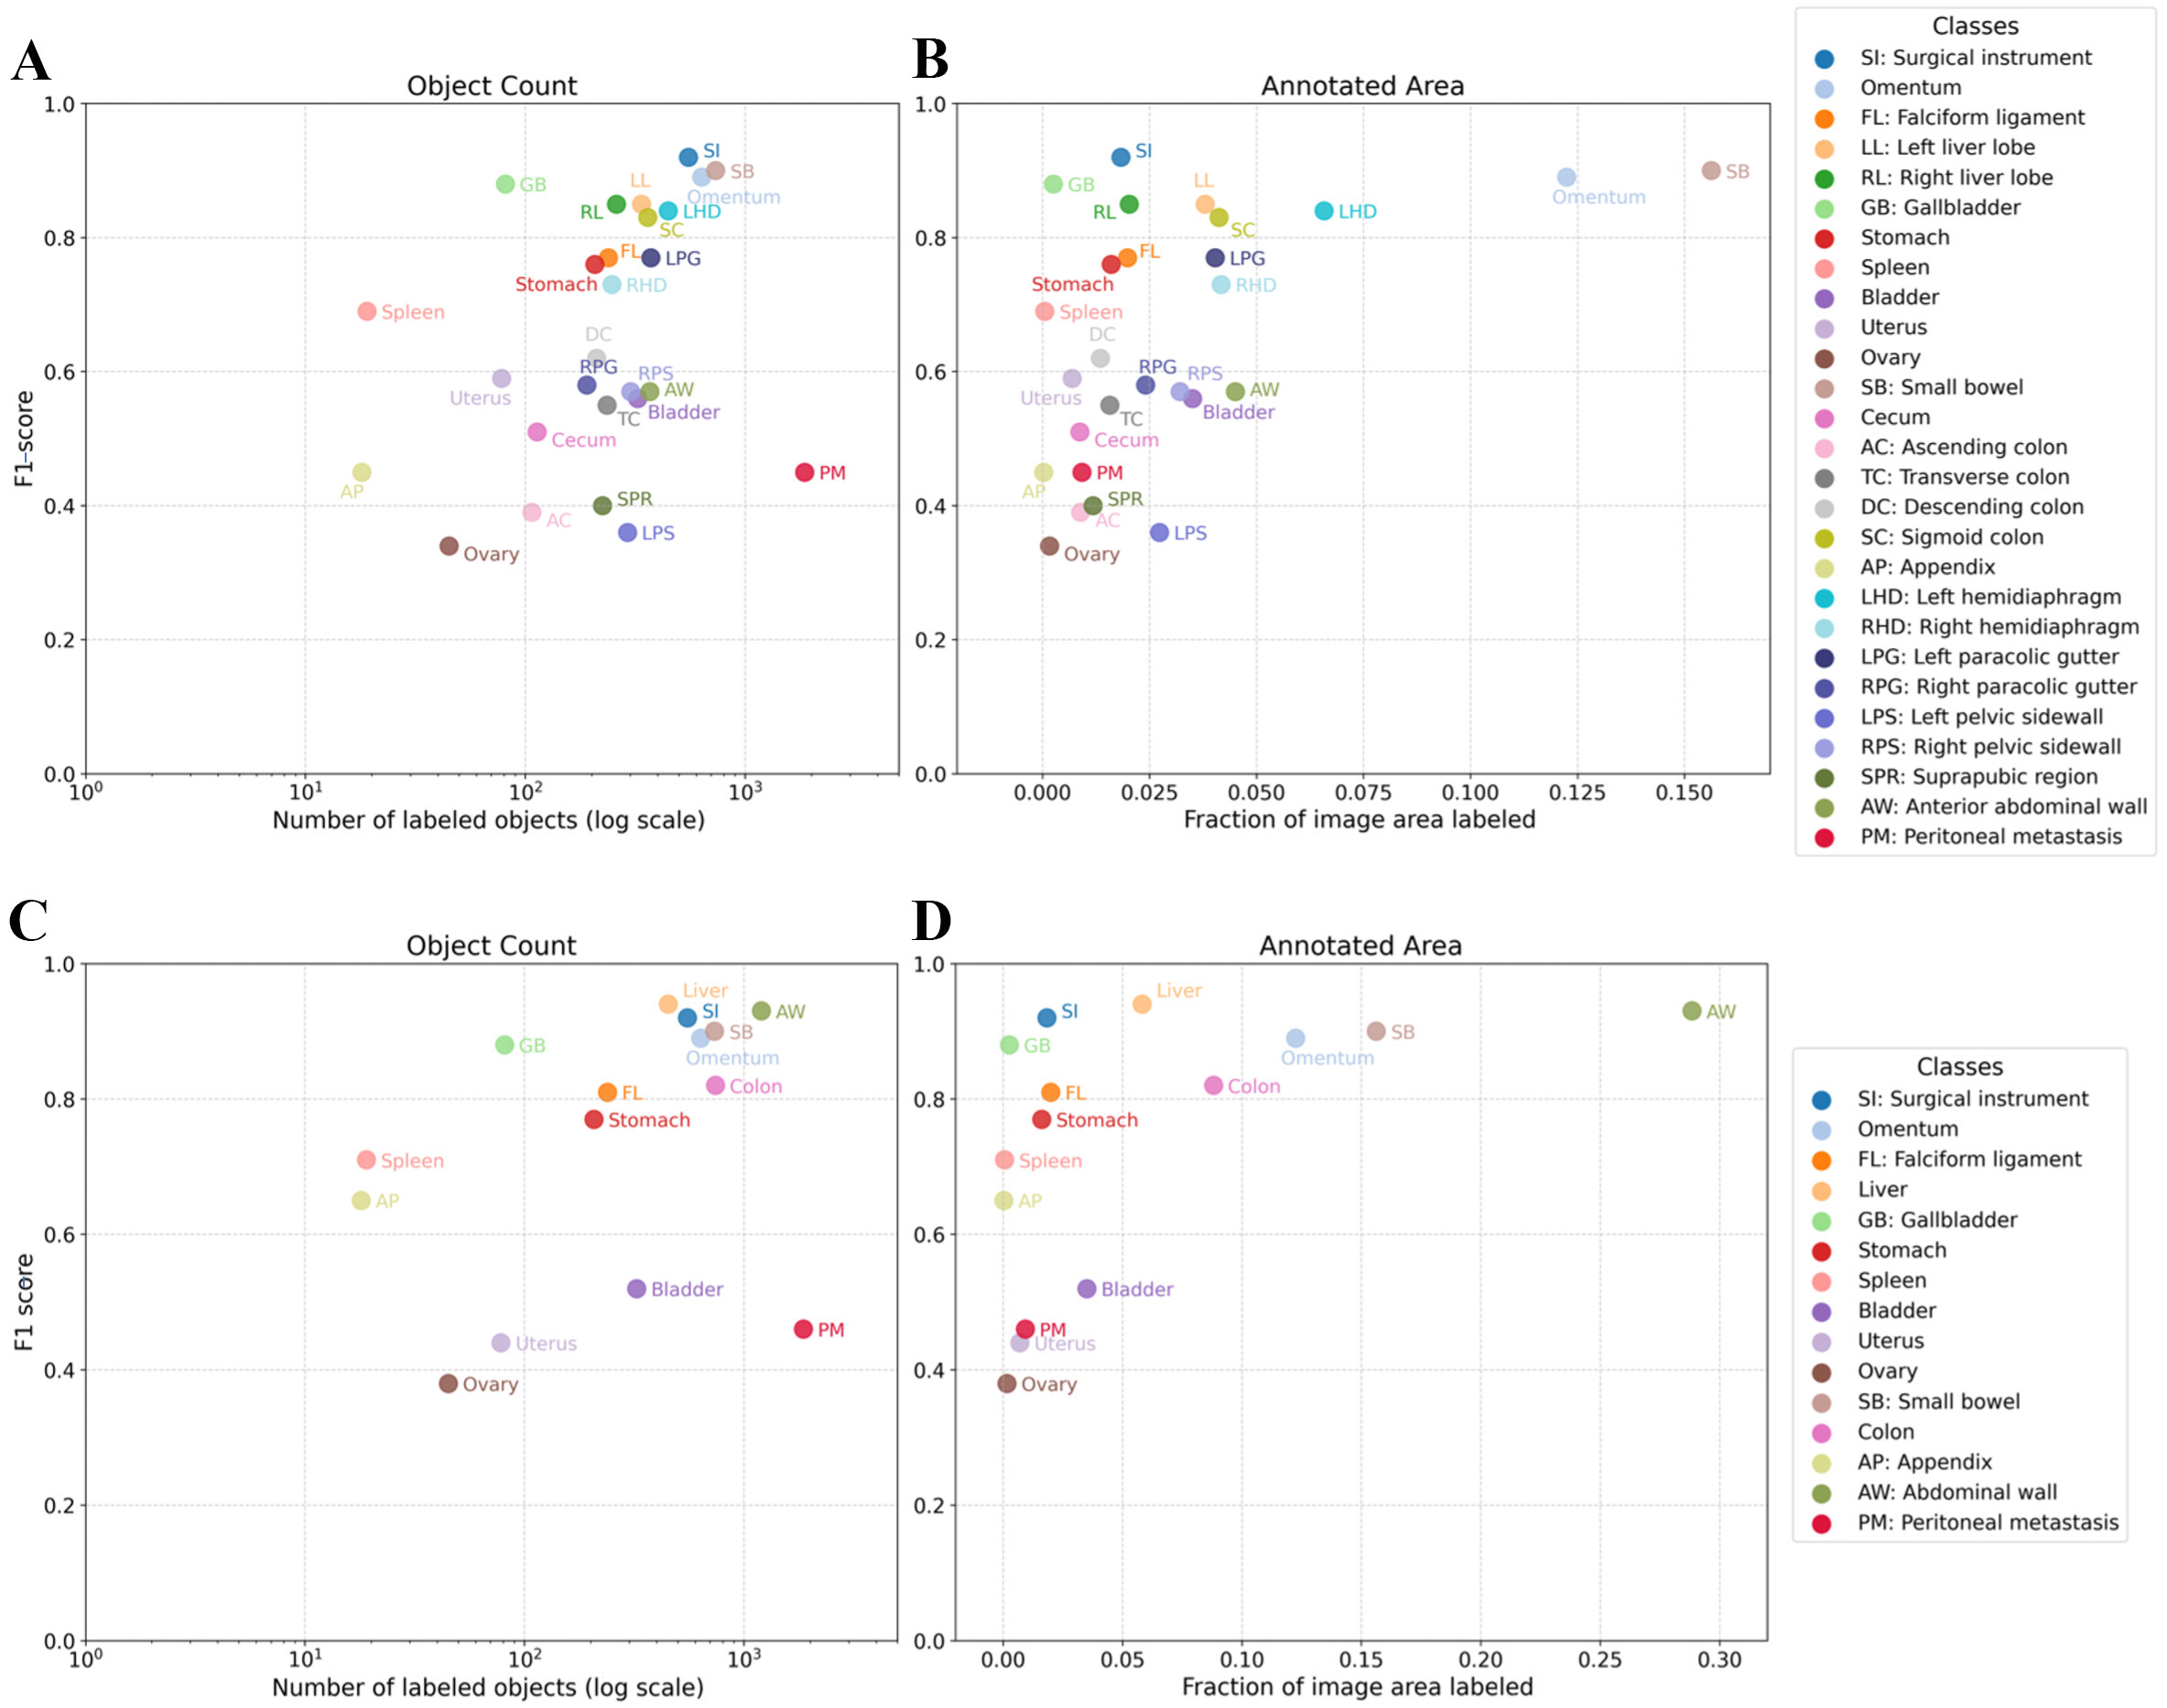
Figure 2. Class-level F1-score in relation to annotation count and annotated area fraction. (A) Set A: F1-score versus number of labeled objects; (B) Set A: F1-score versus fraction of image area labeled; (C) Set B: F1-score versus number of labeled objects; (D) Set B: F1-score versus fraction of image area labeled. The x-axis for object count is displayed on a logarithmic scale. Each point represents one annotated class.