fig2
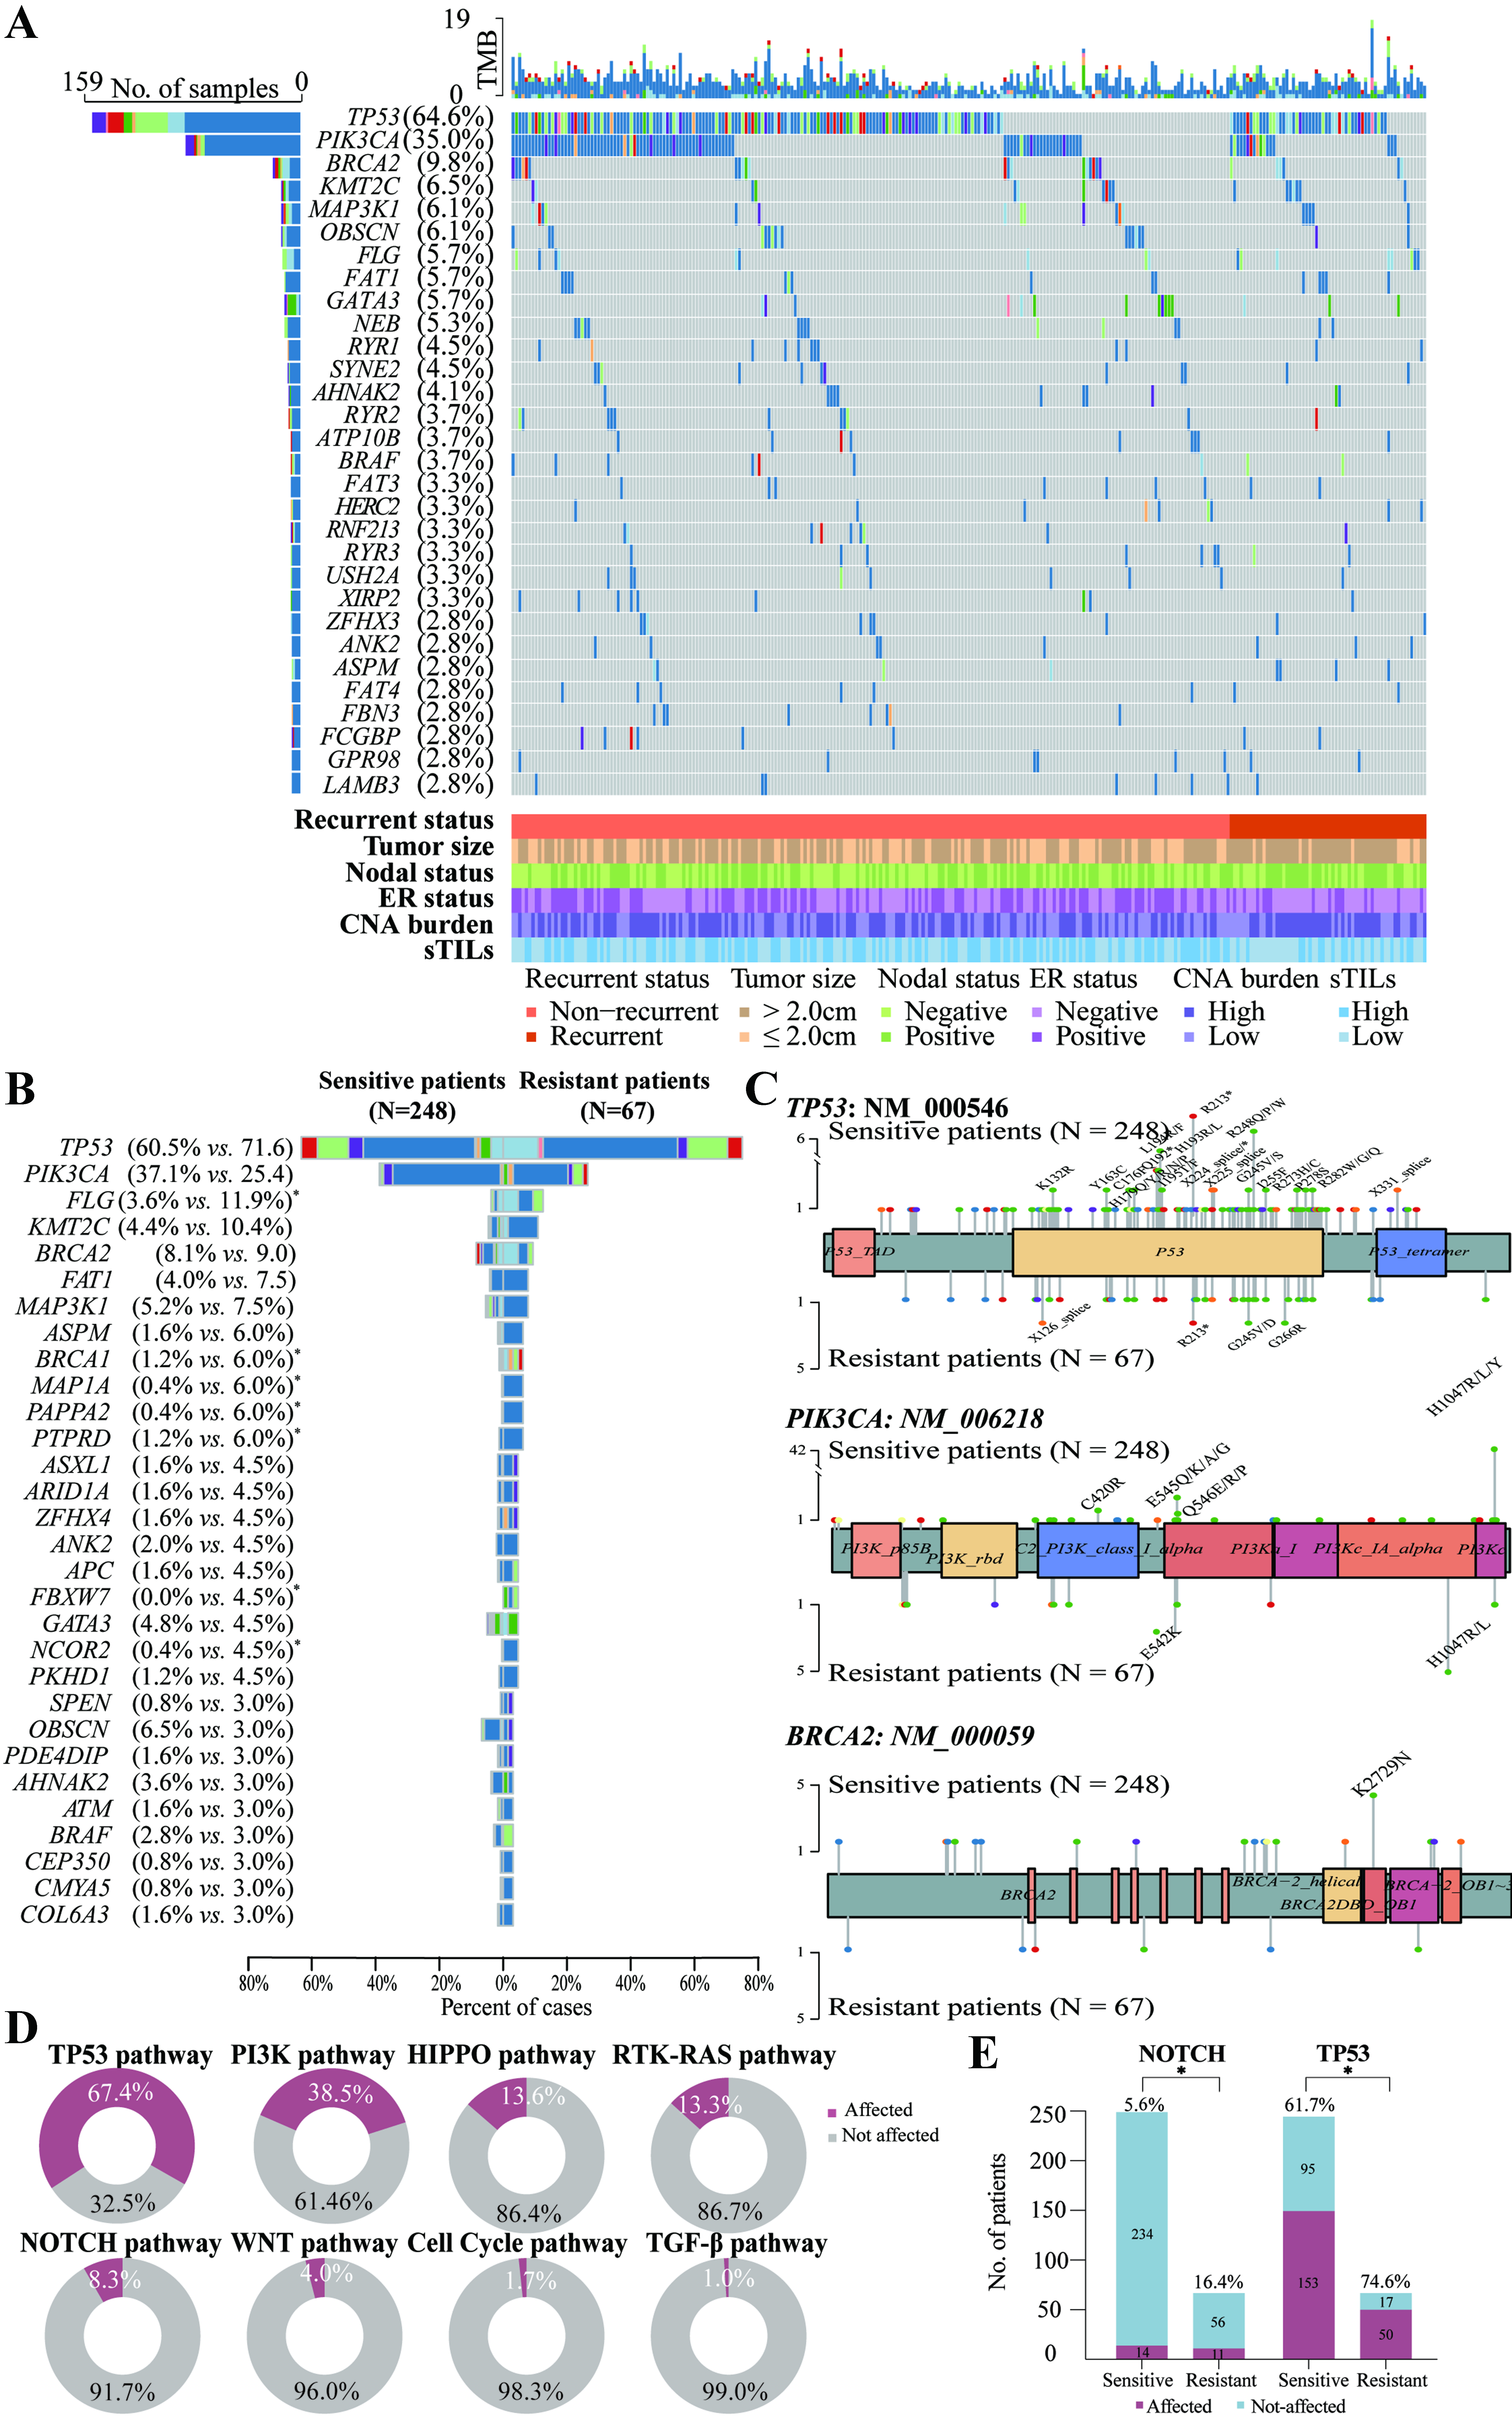
Figure 2. Mutational landscape of HER2-positive early-stage BC in the training cohort. (A) Oncoplot illustrating the 30 most frequently mutated genes in the whole population (N = 251), alongside relevant clinical features including recurrence status, tumor size, axillary lymph node involvement, ER status, CNA burden category, and TIL levels. Horizontal bar plot (top) shows the total number of mutations per tumor. Vertical bar plot (right) displays the number and proportion of patients with alterations per gene. Bar plot (bottom) shows prognosis, tumor size, lymph node status, ER status, TIL levels, and CNA burden category for each patient; (B) Comparison of mutation profiles between sensitive (non-recurrent, N = 248, left) and resistant (recurrent, N = 67, right) tumors. Genes are arranged in descending order of mutation frequency in the resistant group. Genes with significantly different mutation frequencies between the two groups are marked with an asterisk (*P < 0.05, Fisher’s exact test); (C) Lollipop plots showing positional enrichment of mutations within TP53, PIK3CA, and BRCA2, with differing hotspot variants in sensitive and resistant groups. Recurrent mutations are labeled; (D) Ring plots summarizing the frequency of disturbed oncogenic pathways. Gene lists for each pathway were determined by Sanchez-Vega and colleagues; (E) Resistant tumors showed significantly higher rates of alterations in the NOTCH (16.4% vs. 5.6%, P = 0.008) and TP53 (74.6% vs. 61.7%, P = 0.049) pathways compared with sensitive tumors. HER2: Human epidermal growth factor receptor 2; BC: breast cancer; ER: estrogen receptor; CNA: copy number alteration; TIL: tumor-infiltrating lymphocyte; sTILs: stromal tumor-infiltrating lymphocytes.


