


fig4
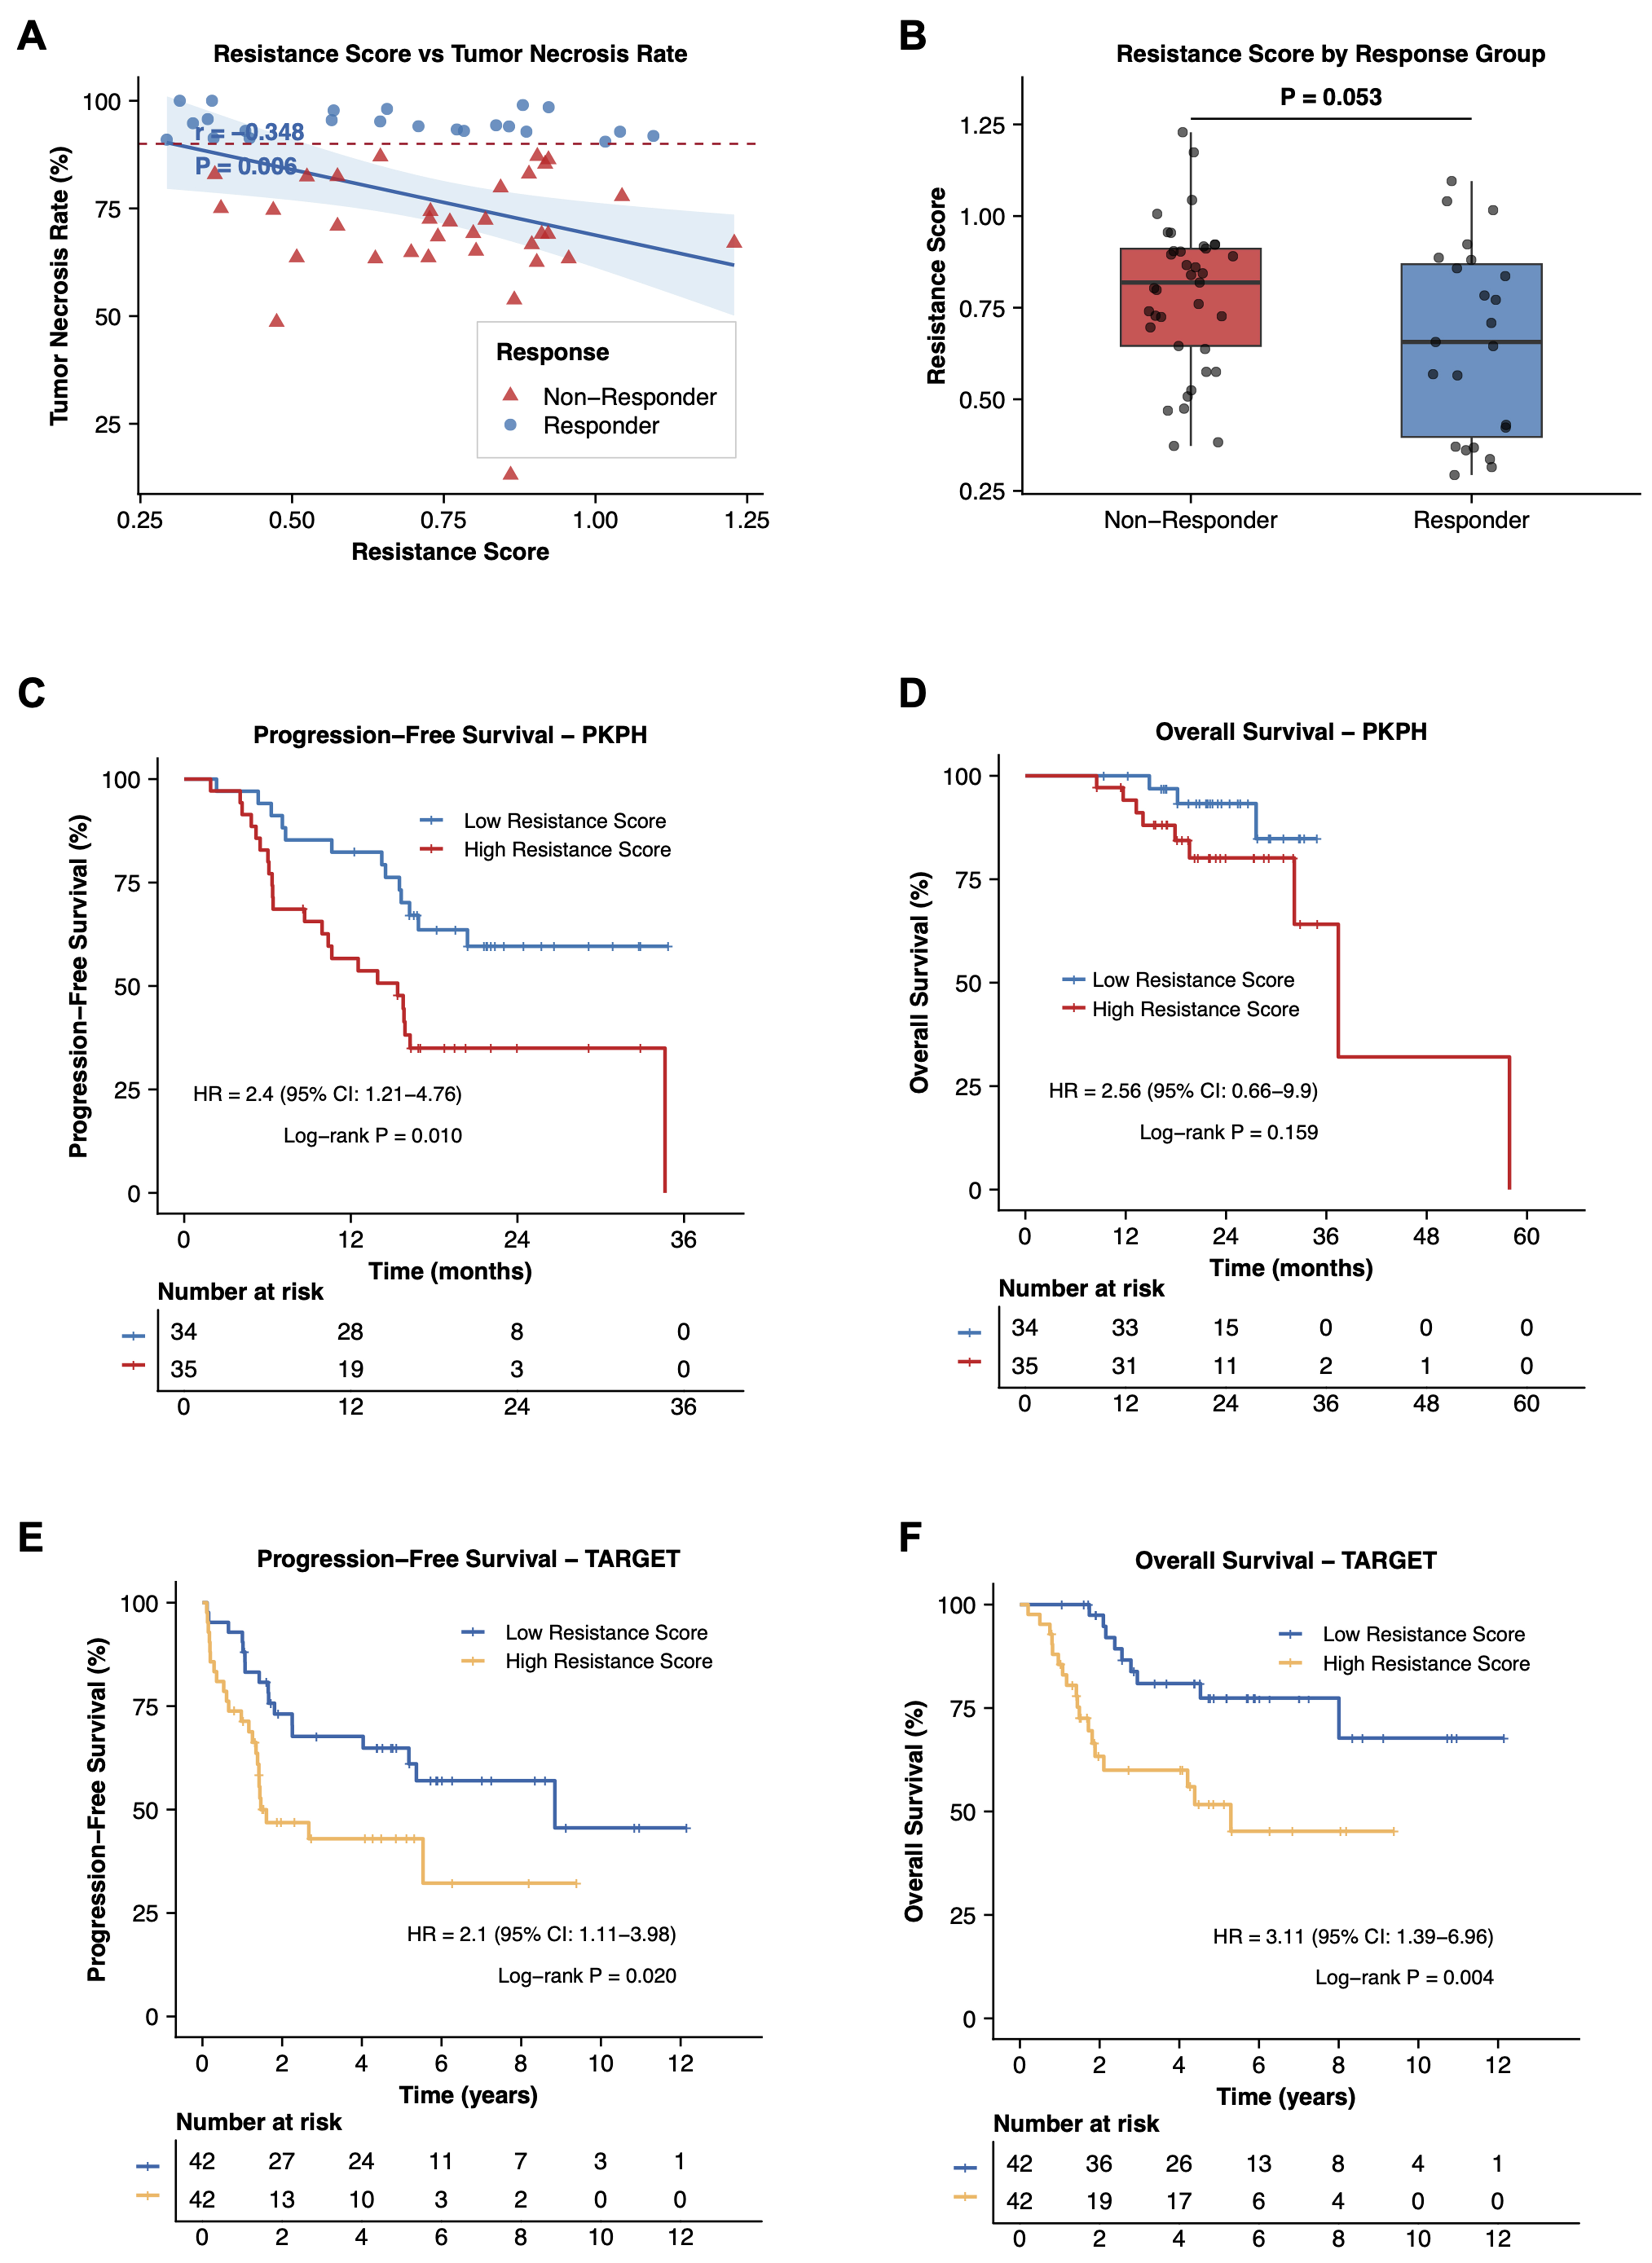
Figure 4. Identification and validation of the nine-gene resistance signature. (A) Correlation between resistance score and tumor necrosis rate in the PKPH cohort (n = 70). Pearson correlation coefficient (r) and P-value are shown; (B) Box plot comparing resistance scores between responders (tumor necrosis rate ≥ 90%) and non-responders (< 90%) in the PKPH cohort. P-value from Wilcoxon rank-sum test; (C) Kaplan-Meier curves for PFS in the PKPH cohort stratified by high vs. low resistance score using median cutoff. HR, 95%CI, and log-rank P value are indicated; (D) Kaplan-Meier curves for OS in the PKPH cohort; (E) Kaplan-Meier curves for PFS in the TARGET cohort stratified by resistance score; (F) Kaplan-Meier curves for OS in the TARGET cohort. For (A), the correlation was assessed using a two-sided Pearson correlation test; for (B), group comparison was performed using a two-sided Wilcoxon rank-sum test; for (C-F), survival differences were assessed using two-sided log-rank tests. PKPH: Peking University People’s Hospital; PFS: progression-free survival; HR: hazard ratio; CI: confidence interval; OS: overall survival; TARGET: Therapeutically Applicable Research to Generate Effective Treatments.


