





fig4
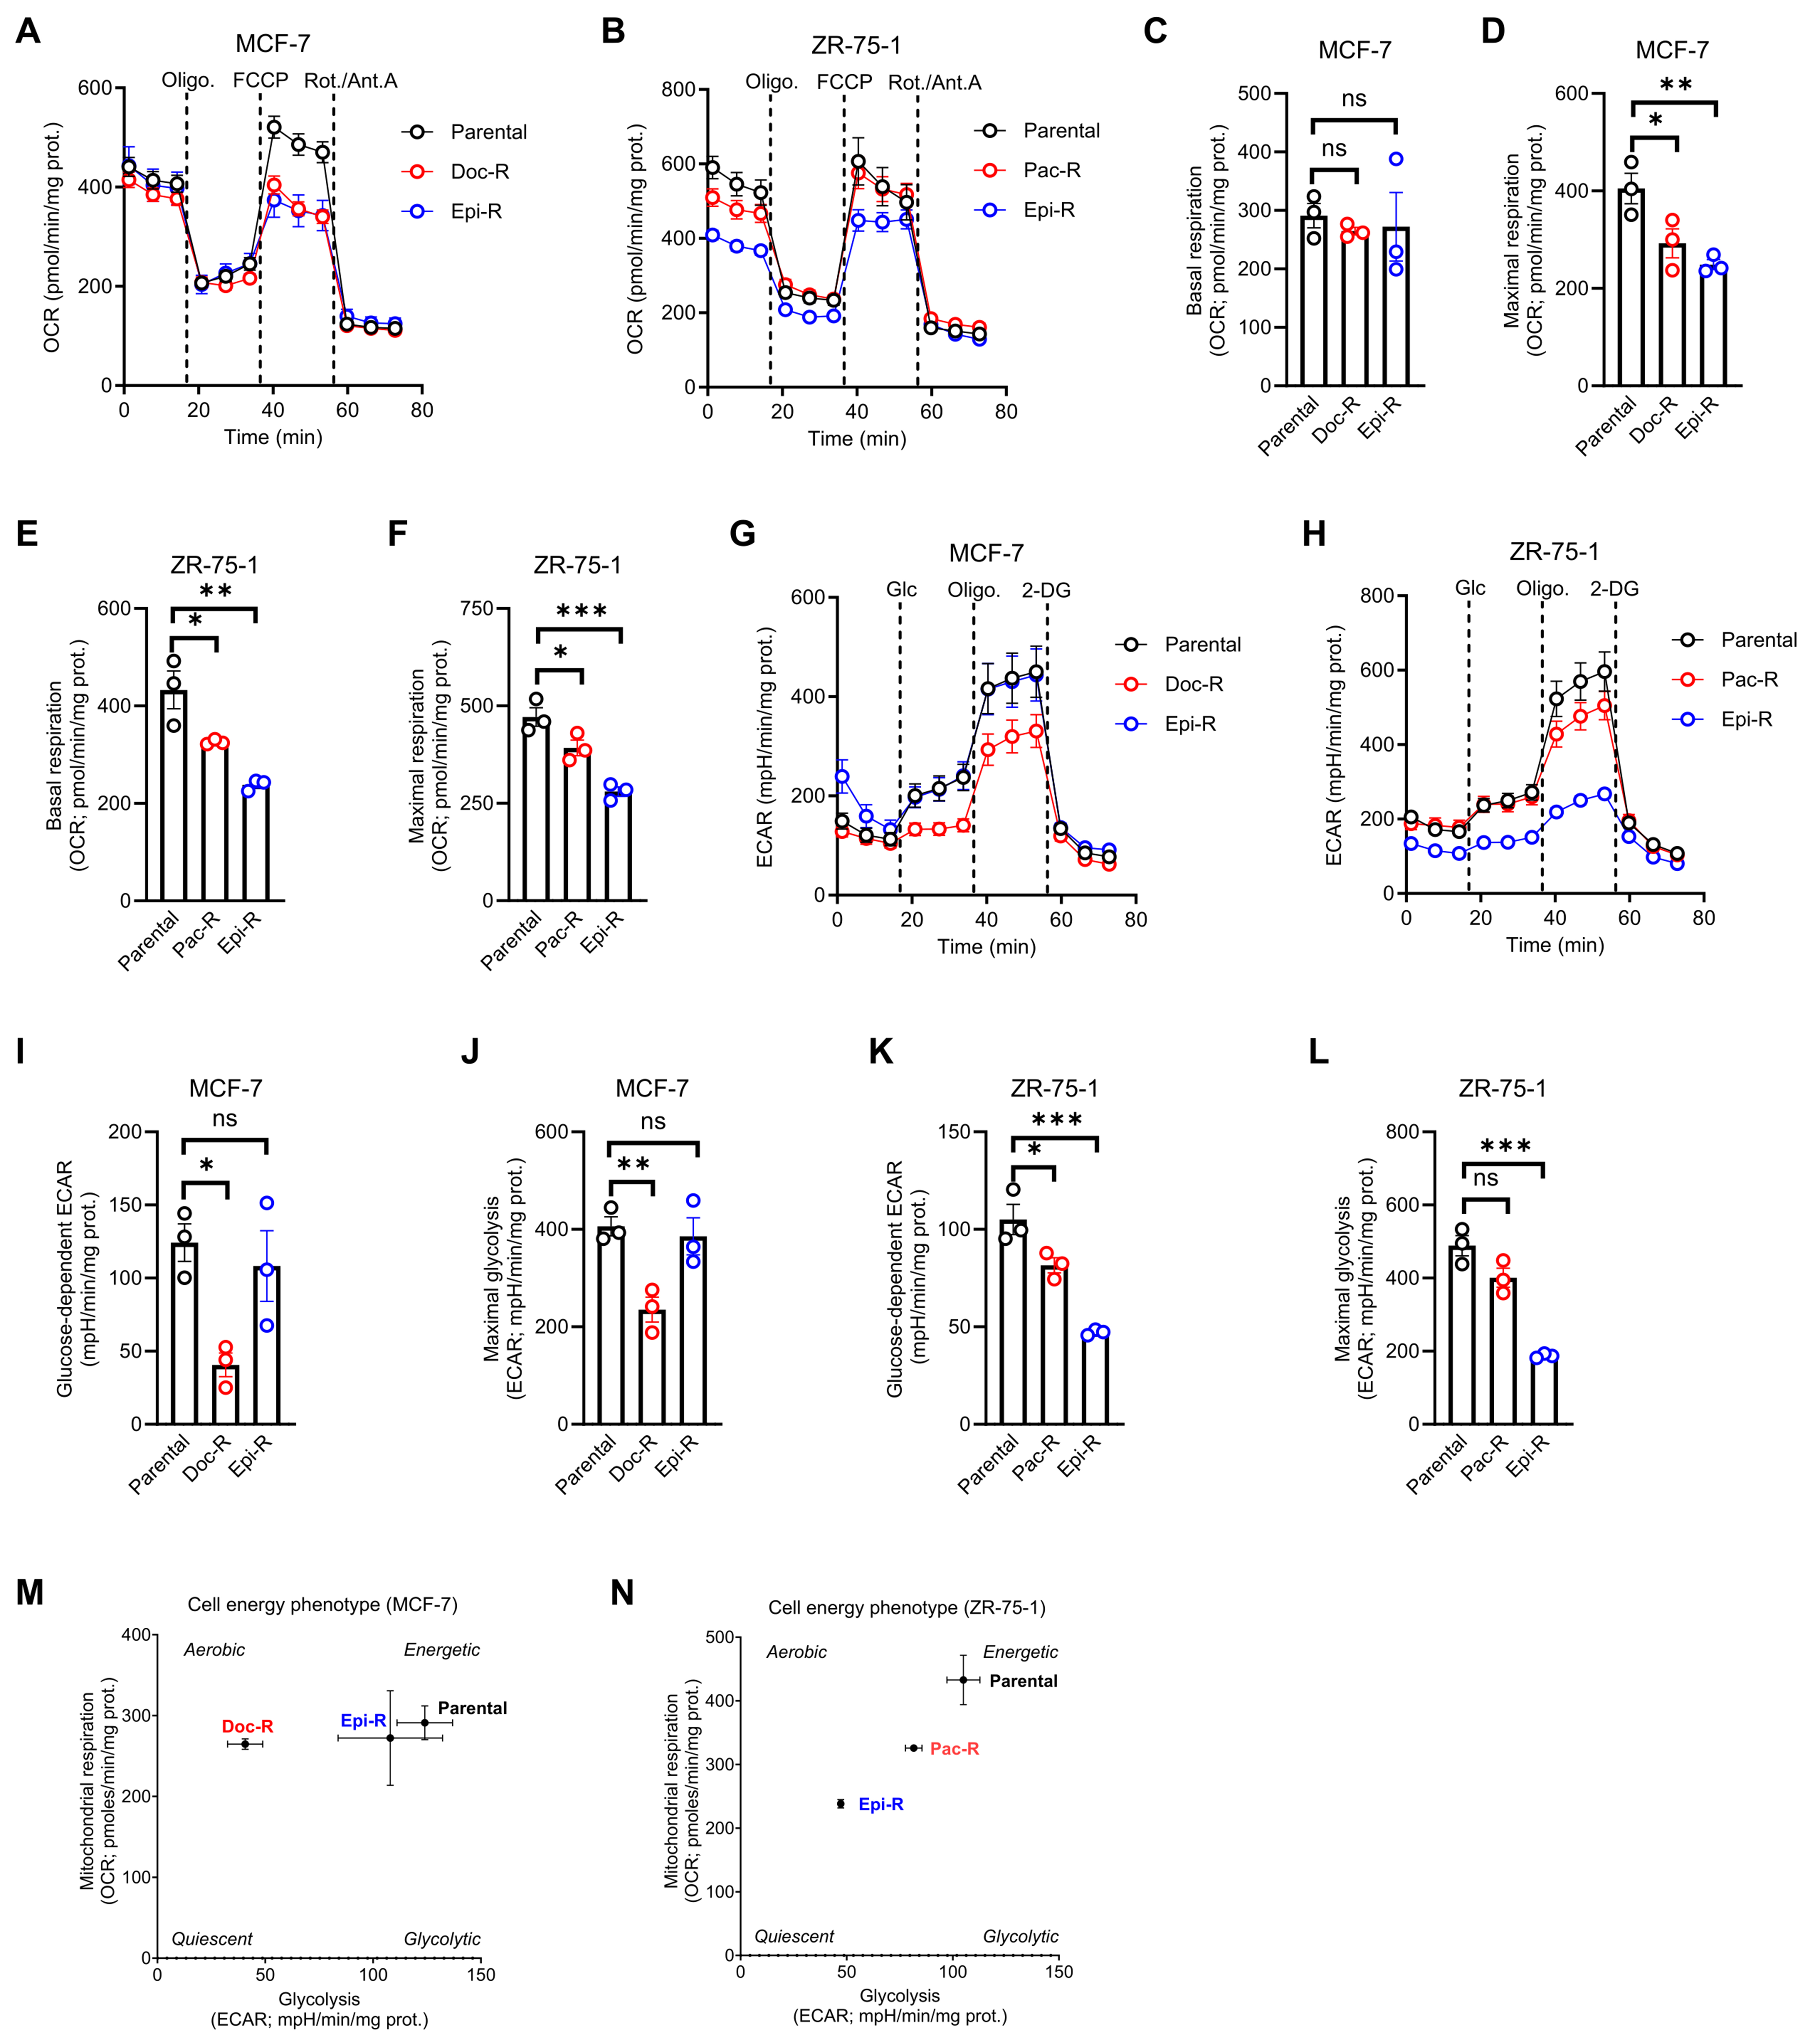
Figure 4. Chemoresistant HR+/HER2- BC cells exhibit reduced mitochondrial respiration and glycolytic capacity. (A and B) OCR profiles in parental and chemoresistant MCF-7 (A) and ZR-75-1 (B) cells following sequential treatment with 1 µM oligomycin, 2 µM FCCP and





