

fig6
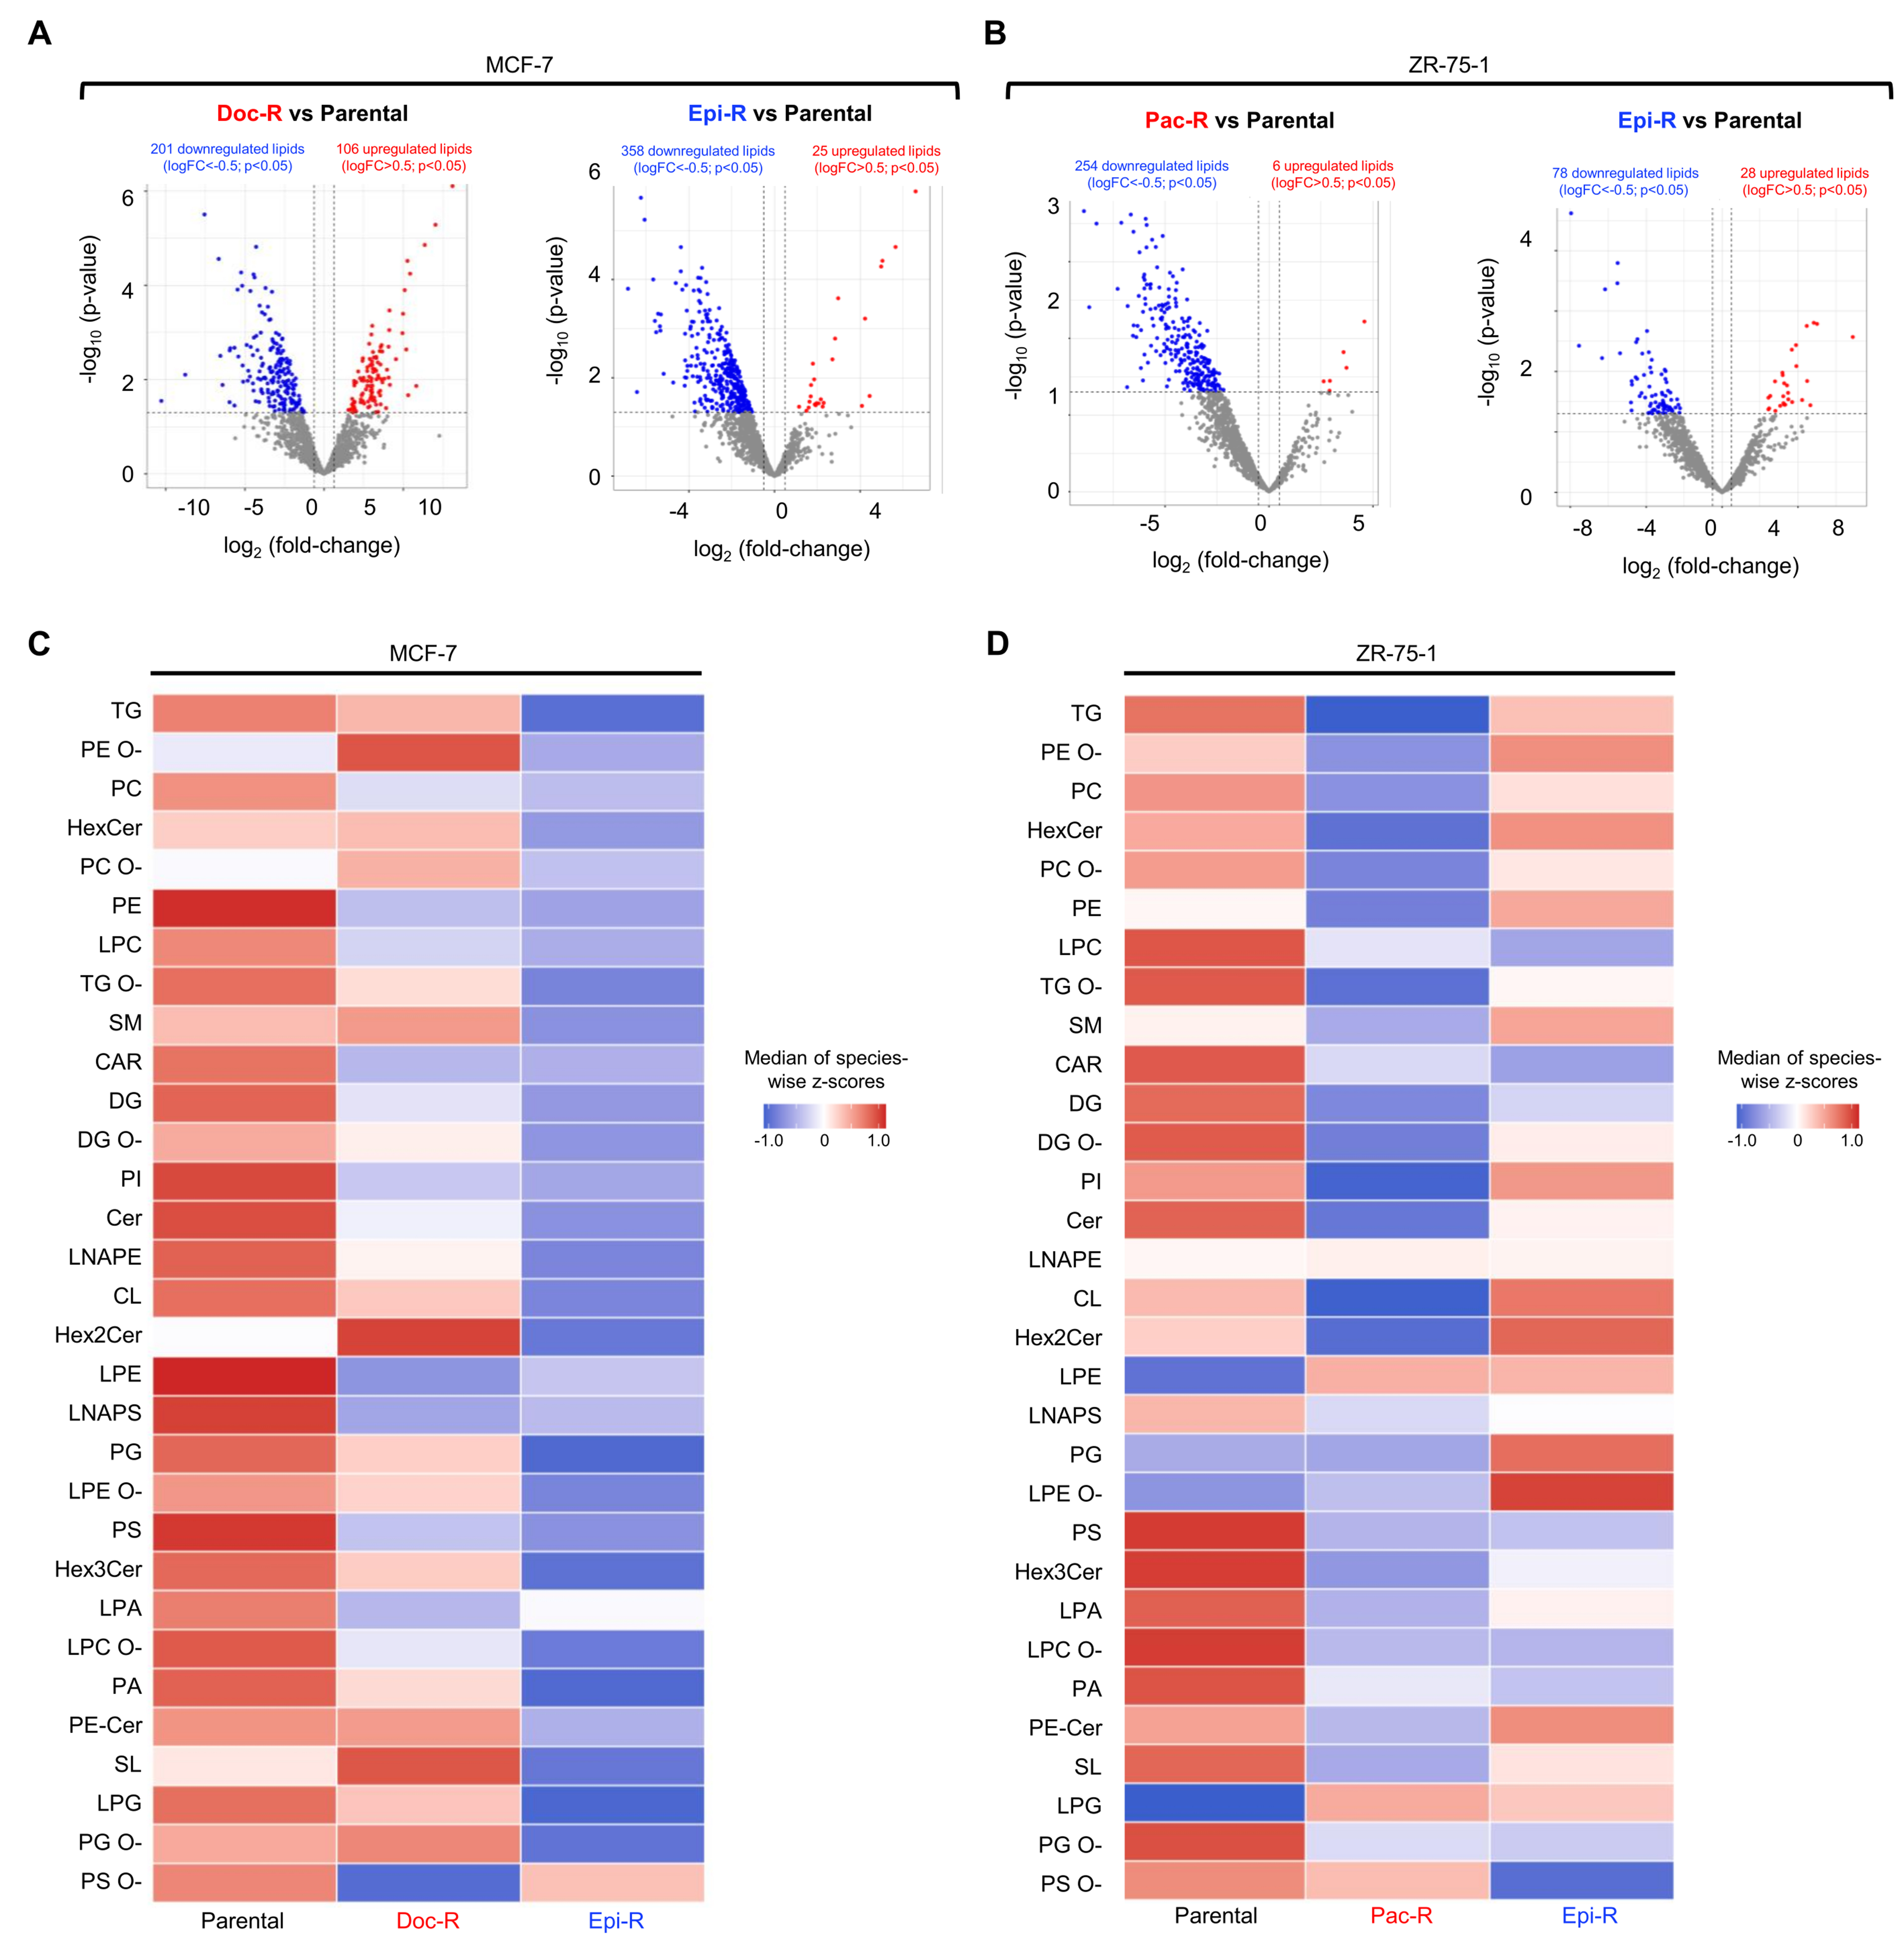
Figure 6. Lipidomic profiling reveals remodeling of lipid species in chemoresistant HR+/HER2- BC cells. (A and B) Volcano plots showing differentially abundant lipid species (logFC < -0.5 or > 0.5; P < 0.05) in chemoresistant MCF-7 (A) and ZR-75-1 (B) cells compared with parental cells; (C and D) Heatmaps summarizing lipid class distribution in chemoresistant MCF-7 (C) and ZR-75-1 (D) cells relative to their respective parental counterparts. Values represent median row z-scores of lipid species within each class following log10 transformation and averaging across biological replicates. HR+/HER2-: Hormone receptor-positive/human epidermal growth factor receptor 2-negative; BC: breast cancer; Doc-R: docetaxel-resistant; Epi-R: epirubicin-resistant; Pac-R: paclitaxel-resistant.