


A vulnerability-based approach for smallholder-led forest conservation
 0
0 
Abstract
Smallholders account for a growing share of forest loss while holding a disproportionate capacity to conserve and restore forests. Yet most Reducing Emissions from Deforestation and Forest Degradation (REDD+) methodologies remain scale- and actor-neutral, offering no systematic mechanism to equitably support these highly vulnerable rural communities. This study pilots a vulnerability-based avoided deforestation methodology in the Curiaú Quilombola territory (Amapá, Brazil), integrating a livelihood-vulnerability filter with a locality-matched dynamic baseline built from 10 m MapBiomas land-cover data and an independent accuracy assessment. A survey of 123 of 505 households is used to compute Livelihood Vulnerability Indexes, which indicate that Curiaú presents a level of vulnerability consistent with eligibility for carbon finance under the applied framework. The dynamic baseline implies an annual deforestation rate of 0.70% and baseline emissions of
Keywords
INTRODUCTION
Smallholders, typically family-managed farms of only a few hectares, occupy a central yet paradoxical position in global land-use and climate debates. They represent a large share of the world’s farms and contribute significantly to food production and dietary diversity despite each operating on only a small fraction of global land[1-3]. Many smallholders live in ecologically marginal and frontier areas, particularly forest-dependent communities in the Global South, marked by facing sharply reduced forest resources[4] and limited adaptive capacity due to structural constraints in assets, infrastructure, insurance, and public services[5]. For example, in the Amazon, through command-and-control measures, large properties have accounted for much of the deforestation reduction before 2010[6], but the recent decline in deforestation reductions calls into question the continued effectiveness of current policy measures. Additionally, the relative contribution of smallholder-dominated areas to ongoing Amazon deforestation has significantly increased and even become dominant[7]. In the Congo Basin, an estimated 84% of forest disturbance is due to small-scale, nonmechanized forest clearing for agriculture[8]. More alarmingly, the most recent forest loss occurred primarily in small patches with a high likelihood of illegality[7,9-11]. These patterns highlight the growing tension among livelihood, food security and forest conservation in smallholder landscapes across the Global South. More importantly, to further curb deforestation to meet climate targets and to address environmental issues (e.g. eutrophication and extreme events)[12-14] in the Global South, efforts need to shift to smallholder territories.
At the same time, smallholders and traditional communities historically had less fragmented and less degraded forests than large-estate frontiers, and a growing body of evidence shows that their territories could be highly effective for climate mitigation and biodiversity conservation when underpinned by secure collective rights and appropriate incentives[15-17]. Indigenous, traditional and communal territories with secure rights often experience lower deforestation than strictly protected areas, due to local monitoring, social norms and governance structures tailored to the landscape[18-21]. Agroforestry and forest-fallow mosaics provide diversified livelihoods, subsistence products and ecological stability, further maintaining higher levels of biodiversity, carbon and microclimatic regulation than simplified agricultural systems[22,23]. Therefore, forest-dependent smallholders in the Global South typically care for both their crop and forest lands and know how to protect them, but rising climate and economic pressures increasingly push them to intensify land use and clear forests.
Despite this dual reality of vulnerability and stewardship, only a tiny share of global climate finance - approximately 1.7% - reaches smallholders in developing countries, creating a mismatch between where climate risks[14] and deforestation pressures are concentrated and where financial resources are urgently needed[24]. In Brazil and other tropical countries, these financing gaps intersect with historical patterns of territorial marginalization for traditional peoples, including Quilombola communities, which often face delayed land regularization, under-investment in basic services, and disproportionate exposure to climate-related disasters despite the demonstrated conservation performance of their territories. Quilombola and similar communal landscapes thus exemplify contexts where climate vulnerability, racialized inequality, and forest conservation converge[25].
Avoided-deforestation projects and jurisdictional REDD+ (Reducing Emissions from Deforestation and forest Degradation) programs are a central pillar of efforts to channel finance towards forest conservation, but their credibility has been weakened by evidence that methodological choices around baselines have frequently led to substantially inflated emission-reduction claims[26-28]. In response to these concerns, new governance initiatives in the voluntary carbon market - notably the Integrity Council for the Voluntary Carbon Market (ICVCM) - have begun assessing crediting programs and methodologies against “high-integrity” Core Carbon Principles, and several updated REDD+ frameworks, including VM0048 and its Jurisdictional and Nested REDD+ Framework, have been revised and approved in line with this agenda, for example, locality-matched or jurisdiction-based reference regions, probability-based accuracy assessment for map-derived activity data, transparent baselines and explicit leakage analysis[29-34]. However, these frameworks remain largely actor-neutral, meaning a hectare of forest is treated largely the same whether governed by smallholders, large landholders, or traditional communities, provided safeguard conditions are met. Therefore, the livelihood vulnerability and social equity barriers can’t be addressed properly[35-37]. Additionally, empirical cost studies show that implementing such best practice entails substantial fixed costs for monitoring, reporting and verification - including participatory planning, institutional coordination, remote-sensing analysis, field measurements and repeated audits - which tend to scale poorly in small, heterogeneous territories[38-41]. In practice, this combination of largely actor-neutral integrity rules and scale-dependent transaction costs tends to favor large, contiguous conservation areas and jurisdictional programs, while creating a structural barrier for smallholder and traditional-community landscapes, even though they are often on the frontline of both deforestation risk and climate vulnerability, and they are the best problem solvers.
To address this gap, a recently developed vulnerability-based avoided deforestation methodology SCM0011[42] integrates two features not present in most ICVCM-aligned REDD+ approaches: (1) a locality-matched, smallholder-specific dynamic baseline, and (2) a quantitative livelihood-vulnerability filter that serves as part of the additionality assessment and identifies which dimensions - such as livelihood strategies, financial stability and access to basic services - require targeted support[5,29,42-45]. This study applies the methodology in a smallholder-dominated community in the Curiaú Quilombola territory, located in the municipality of Macapá, Amapá, Brazil. It evaluates (1) Curiaú community’s livelihood vulnerability profile, (2) whether a dynamic, reference-region baseline indicates a non-trivial risk of future forest loss in the absence of targeted support, and (3) whether the potential carbon credits derived from conservative estimates of avoided deforestation could make a meaningful contribution to climate resilience. Through this real-world application, we show that a smallholder-centered, vulnerability-based methodology simultaneously strengthens integrity in forest carbon markets and supports smallholders' welfare in frontline smallholder communities.
METHODS
Study area
Curiaú is a peri-urban Quilombola territory, approximately 3,130 hectares and around 505 households, where livelihoods rely on small-scale agriculture, extractivism, wage labor, and public transfers [Figure 1]. Quilombola communities are Afro-Brazilian traditional communities with collective land rights[46], historically associated with social marginalization and heightened exposure to socio-environmental risks[5]. Its mosaic of native forest, floodplains, and smallholder land-use lies in the surroundings of Macapá and is increasingly affected by urban expansion and climatic variability. Recent flooding events in the Amazon, Vale do Ribeira, and southern Brazil have underscored the frontline position of Quilombola communities in the country’s climate crisis: entire territories have been isolated, crops and basic infrastructure damaged, and long-standing vulnerabilities linked to limited public investment and historical marginalization exposed[47,48].
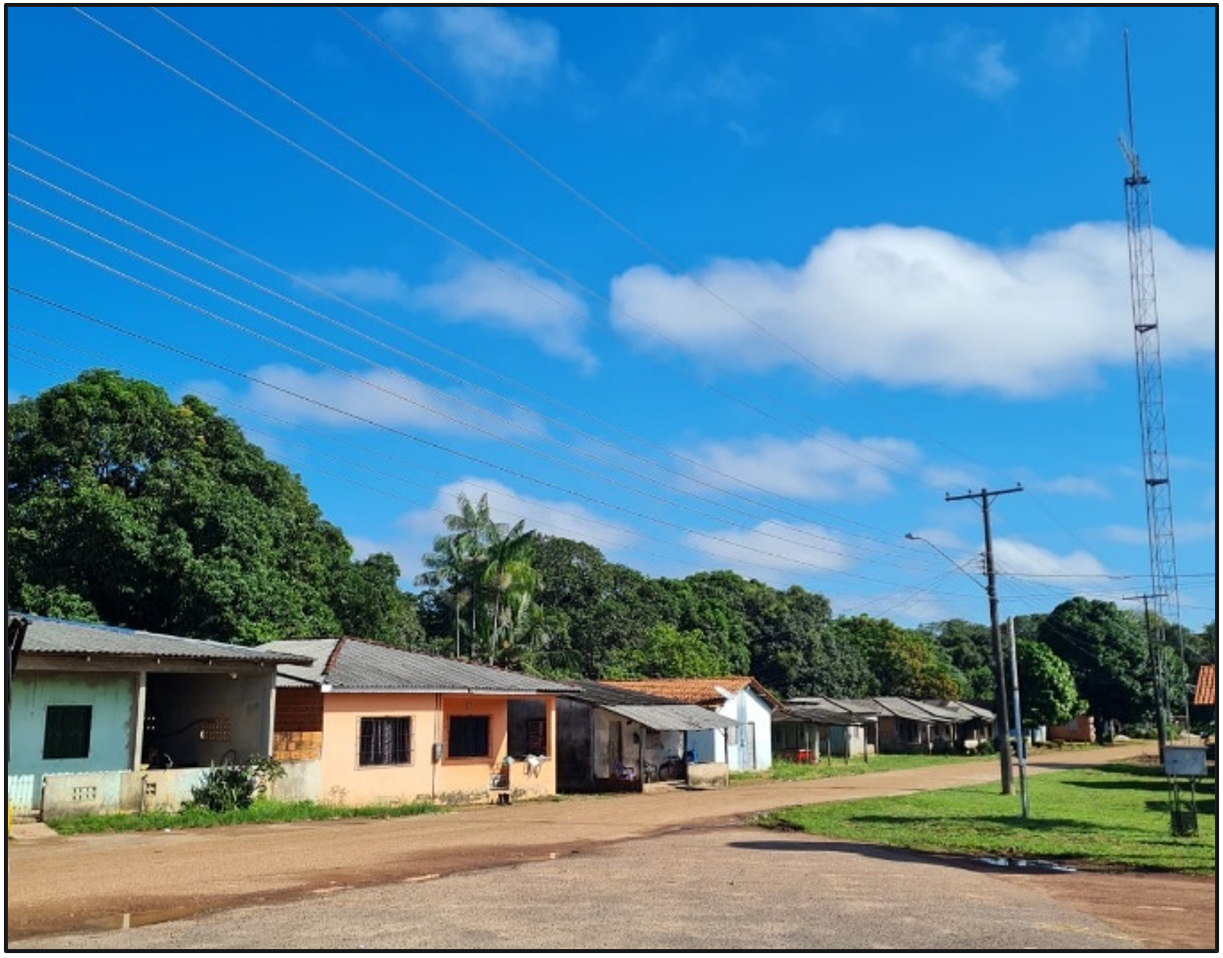
Figure 1. A representative street view of the Curiaú Quilombola community, Macapá, Amapá State, Brazil, illustrating the built infrastructure and surrounding floodplain landscape along the main access road. Source: Authors’ own photograph.
Study design
Following the standard methodology[42], the study design operationalizes a sequence of linked analytical steps applied to the Curiaú case [Figure 2].
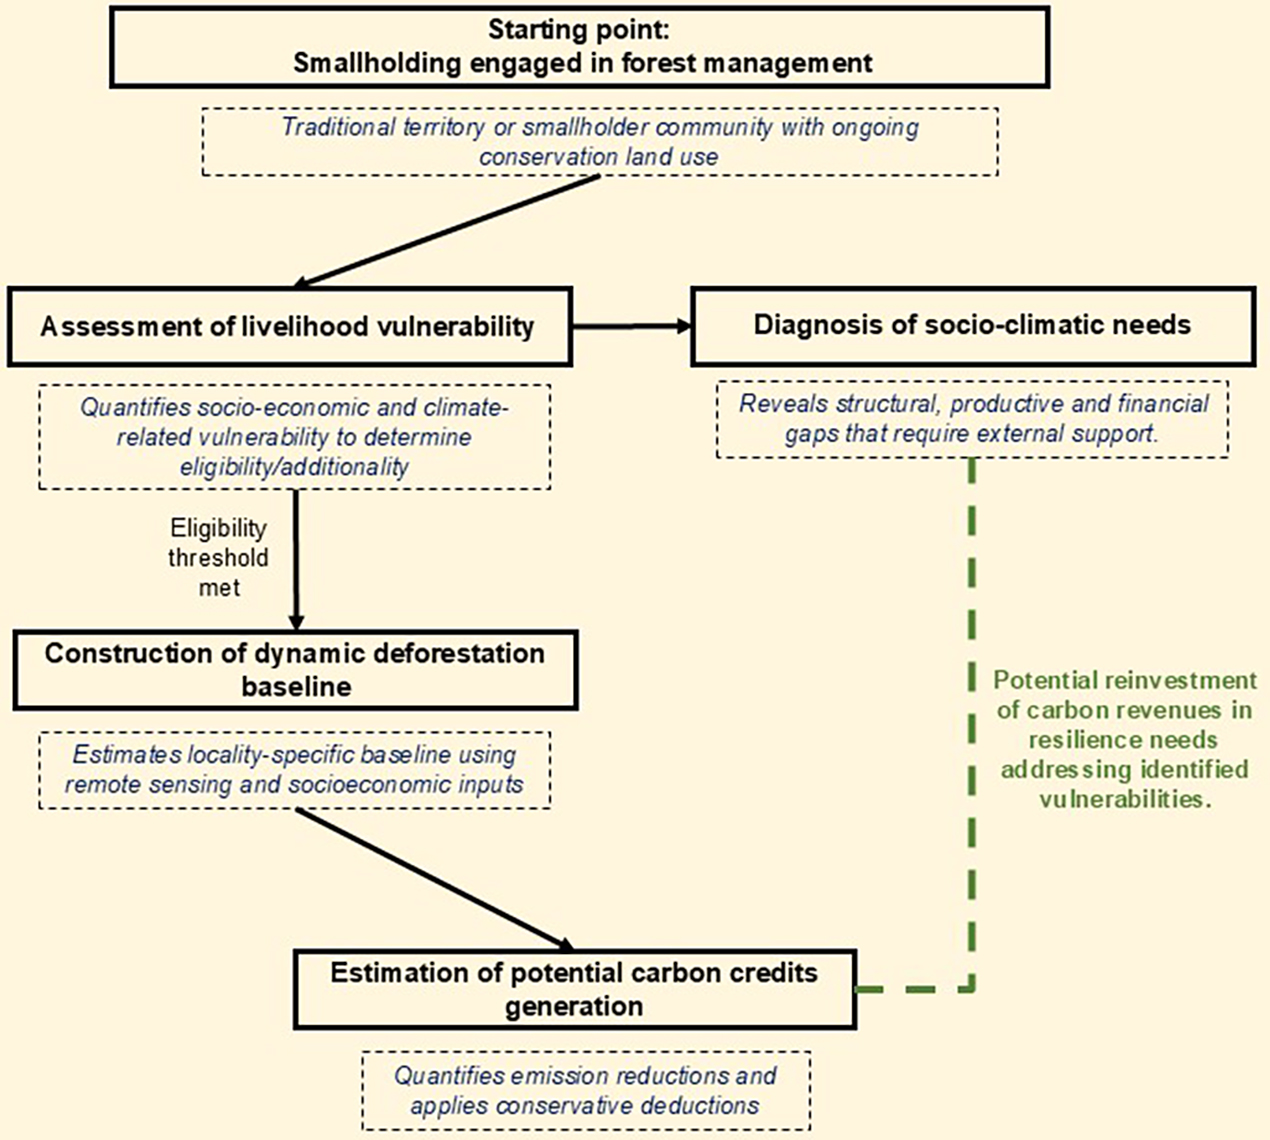
Figure 2. Methodological workflow applied in this study, from vulnerability assessment and eligibility, through construction of a dynamic smallholder deforestation baseline and estimation of carbon credits, to a climate-resilience analysis linking potential carbon revenues to their potential costs in Curiaú.
First, a Livelihood Vulnerability Index (LVI) module[43] is applied to assess Curiaú’s livelihood vulnerability, derive household- and community-level indices, and determine whether Curiaú meets the vulnerability-based eligibility threshold defined in the methodology (Section “Livelihood vulnerability indexes”). Second, the resulting vulnerability profile is interpreted diagnostically to identify the main socio-climatic needs or constraints affecting livelihoods and the dimensions in which targeted support would be most relevant (Section “Livelihood vulnerability indexes”). Third, a dynamic, locality-specific baseline for deforestation in smallholder-dominated mosaics is constructed using the MapBiomas 10-metre land-cover product[49] and a reference region composed of Quilombola territories and agrarian-reform settlements in Amapá (Section “Remote-sensing and dynamic baseline data”). Fourth, this adjusted baseline is combined with forest carbon-stock factors and conservative deductions to estimate the annual volume of potentially creditable emission reductions (Section “Estimation of potential credits and climate-resilience analysis”). Finally, an exploratory analysis evaluates how the associated carbon finance could curb deforestation and enhance ecosystem resilience in Curiaú in a sustainable way (Section “Estimation of potential credits and climate-resilience analysis”).
Livelihood vulnerability indexes
In February 2024, a non-probability snowball sampling approach was used to recruit 123 of the 505 households in the Curiaú community. Initial interviewees were identified in geographically defined neighborhood clusters, including areas near the main access road and more hard-to-reach or hidden remote sectors, and were then asked to refer further households. These clusters were defined solely on a geographic basis and serve as entry points for recruitment rather than as socio-economic strata. This approach was chosen for field feasibility and to ensure coverage of both peri-urban and more distant parts of the community. However, because the sampling was non-probabilistic, some degree of selection bias is likely, and the resulting sample is interpreted as characterizing the community, rather than providing precise estimates for specific sub-groups. If treated as a simple random sample, this sample size would correspond to a 90% confidence interval with a margin of error of 7.7%, but these metrics should therefore be interpreted as indicative rather than as formal design-based.
Data were collected through face-to-face interviews at the households’ premises using a structured questionnaire that had been pre-tested and validated and was designed to capture the full spectrum of livelihood vulnerability [Table 1]. A complete list of survey items and summary statistics is provided in Supplementary Table 1. Responses were recorded digitally using an open data kit platform on mobile devices.
Overview of the livelihood vulnerability data gathered from the community to determine the composite indices LVI-SF and LVI-SF-IPCC
| Category | Livelihood vulnerability data |
| Socio-demographics | Household structure and dependency ratio Education of household head and children Migration and off-farm labour Knowledge of climate change and weather forecasting Health and access to healthcare Safety |
| Livelihood strategies | Land tenure and ownership Crops, livestock, and other farm income sources Production yields and losses Dependence on external inputs Water sources and availability Market access and intermediaries |
| Basic household needs | Food security and self-sufficiency Housing quality Access to drinking water, potable water and energy |
| Natural disasters and climate variability | Exposure to extreme weather events and related damage Climate variability |
| Financial stability | Access to capital Poverty level Healthcare costs |
| Social networks | Participation in agricultural groups, trainings and learning visits Access to telecommunication |
The collected data were normalized to a 0-1 scale to generate two distinct community-level indices. First, the Smallholder Farmer Livelihood Vulnerability Index (LVI-SF) was calculated by aggregating indicators across the Sustainable Livelihoods Framework capitals, providing a synthetic measure of overall livelihood vulnerability on a continuous scale from 0 (least vulnerable) to 1 (most vulnerable). Second, the IPCC Livelihood Vulnerability Index (LVI-SF-IPCC) was derived by reorganizing the same set of indicators within the IPCC’s conceptual framework of “exposure-sensitivity-adaptive capacity”[5], following the LVI-IPCC formulation proposed by Hahn et al.[45], and synthesized in empirical studies as well[50]. This formulation applies equal weighting through simple arithmetic means across subcomponents and introduces the inversion of some original items that belong to adaptive capacities only at the final aggregation stage. As a result, the LVI-SF-IPCC yields values ranging from -1, indicating the lowest level of vulnerability, to +1, representing the highest level of vulnerability. Eligibility for carbon finance is assessed using the operational vulnerability screening thresholds, with at least moderate thresholds (LVI-SF > 0.30; LVI-SF-IPCC > -0.30) used to identify contexts in which socio-economic constraints and climate-related exposure and sensitivity are likely to outweigh adaptive capacity[42,43]. Additionally, both indexes could further inform the prioritization of contexts in which socio-economic vulnerability and climate-related risks justify targeted mitigation, adaptation and livelihood-protection interventions.
Remote-sensing and dynamic baseline data
The dynamic deforestation baseline was conducted in accordance with the standard methodological requirements, including the definition of the reference region, class reclassification rules, accuracy assessment and adjusted area estimation. Land-cover and land-use change analyses use the MapBiomas 10-metre land-cover product for Brazil (Collection 2, beta), derived from Sentinel-2 MSI Level 2A imagery at 10-metre resolution and processed according to the Algorithm Theoretical Basis Document for the MapBiomas 10-metre project. QGIS (version 3.42) was used for spatial preprocessing, such as coordinate harmonization, polygon preparation, area calculations, raster extraction and class transitions. Project and reference boundaries were obtained from federal cadastral datasets. The Curiaú Quilombola territory was sourced from the Cadastro Nacional de Territórios Quilombolas (CNTQ) maintained by the Instituto Nacional de Colonização e Reforma Agrária (INCRA), and the boundaries of other Quilombola communities and agrarian-reform settlements were obtained from the Sistema de Informações de Projetos de Reforma Agrária (SIPRA) and related INCRA public datasets.
Natural forest formations and anthropic land-use classes were defined following the MapBiomas legend and the reclassification rules[42] [Figure 3]. Natural forest area was mapped for the year 2022, which represents the baseline observation year adopted in this study, consistent with the subsequent assessment of forest-to-anthropic transitions in 2022-2023 and with the reference period captured by the livelihood vulnerability survey. The project area was defined as the largest contiguous block of natural forest within the officially demarcated Curiaú territory; other land uses and smaller forest fragments inside the legal boundary, including additional forest patches and agricultural areas, were not included in the project polygon but remain part of the recognized Quilombola territory. All spatial data were harmonized in a projected coordinate reference system suitable for area estimation.
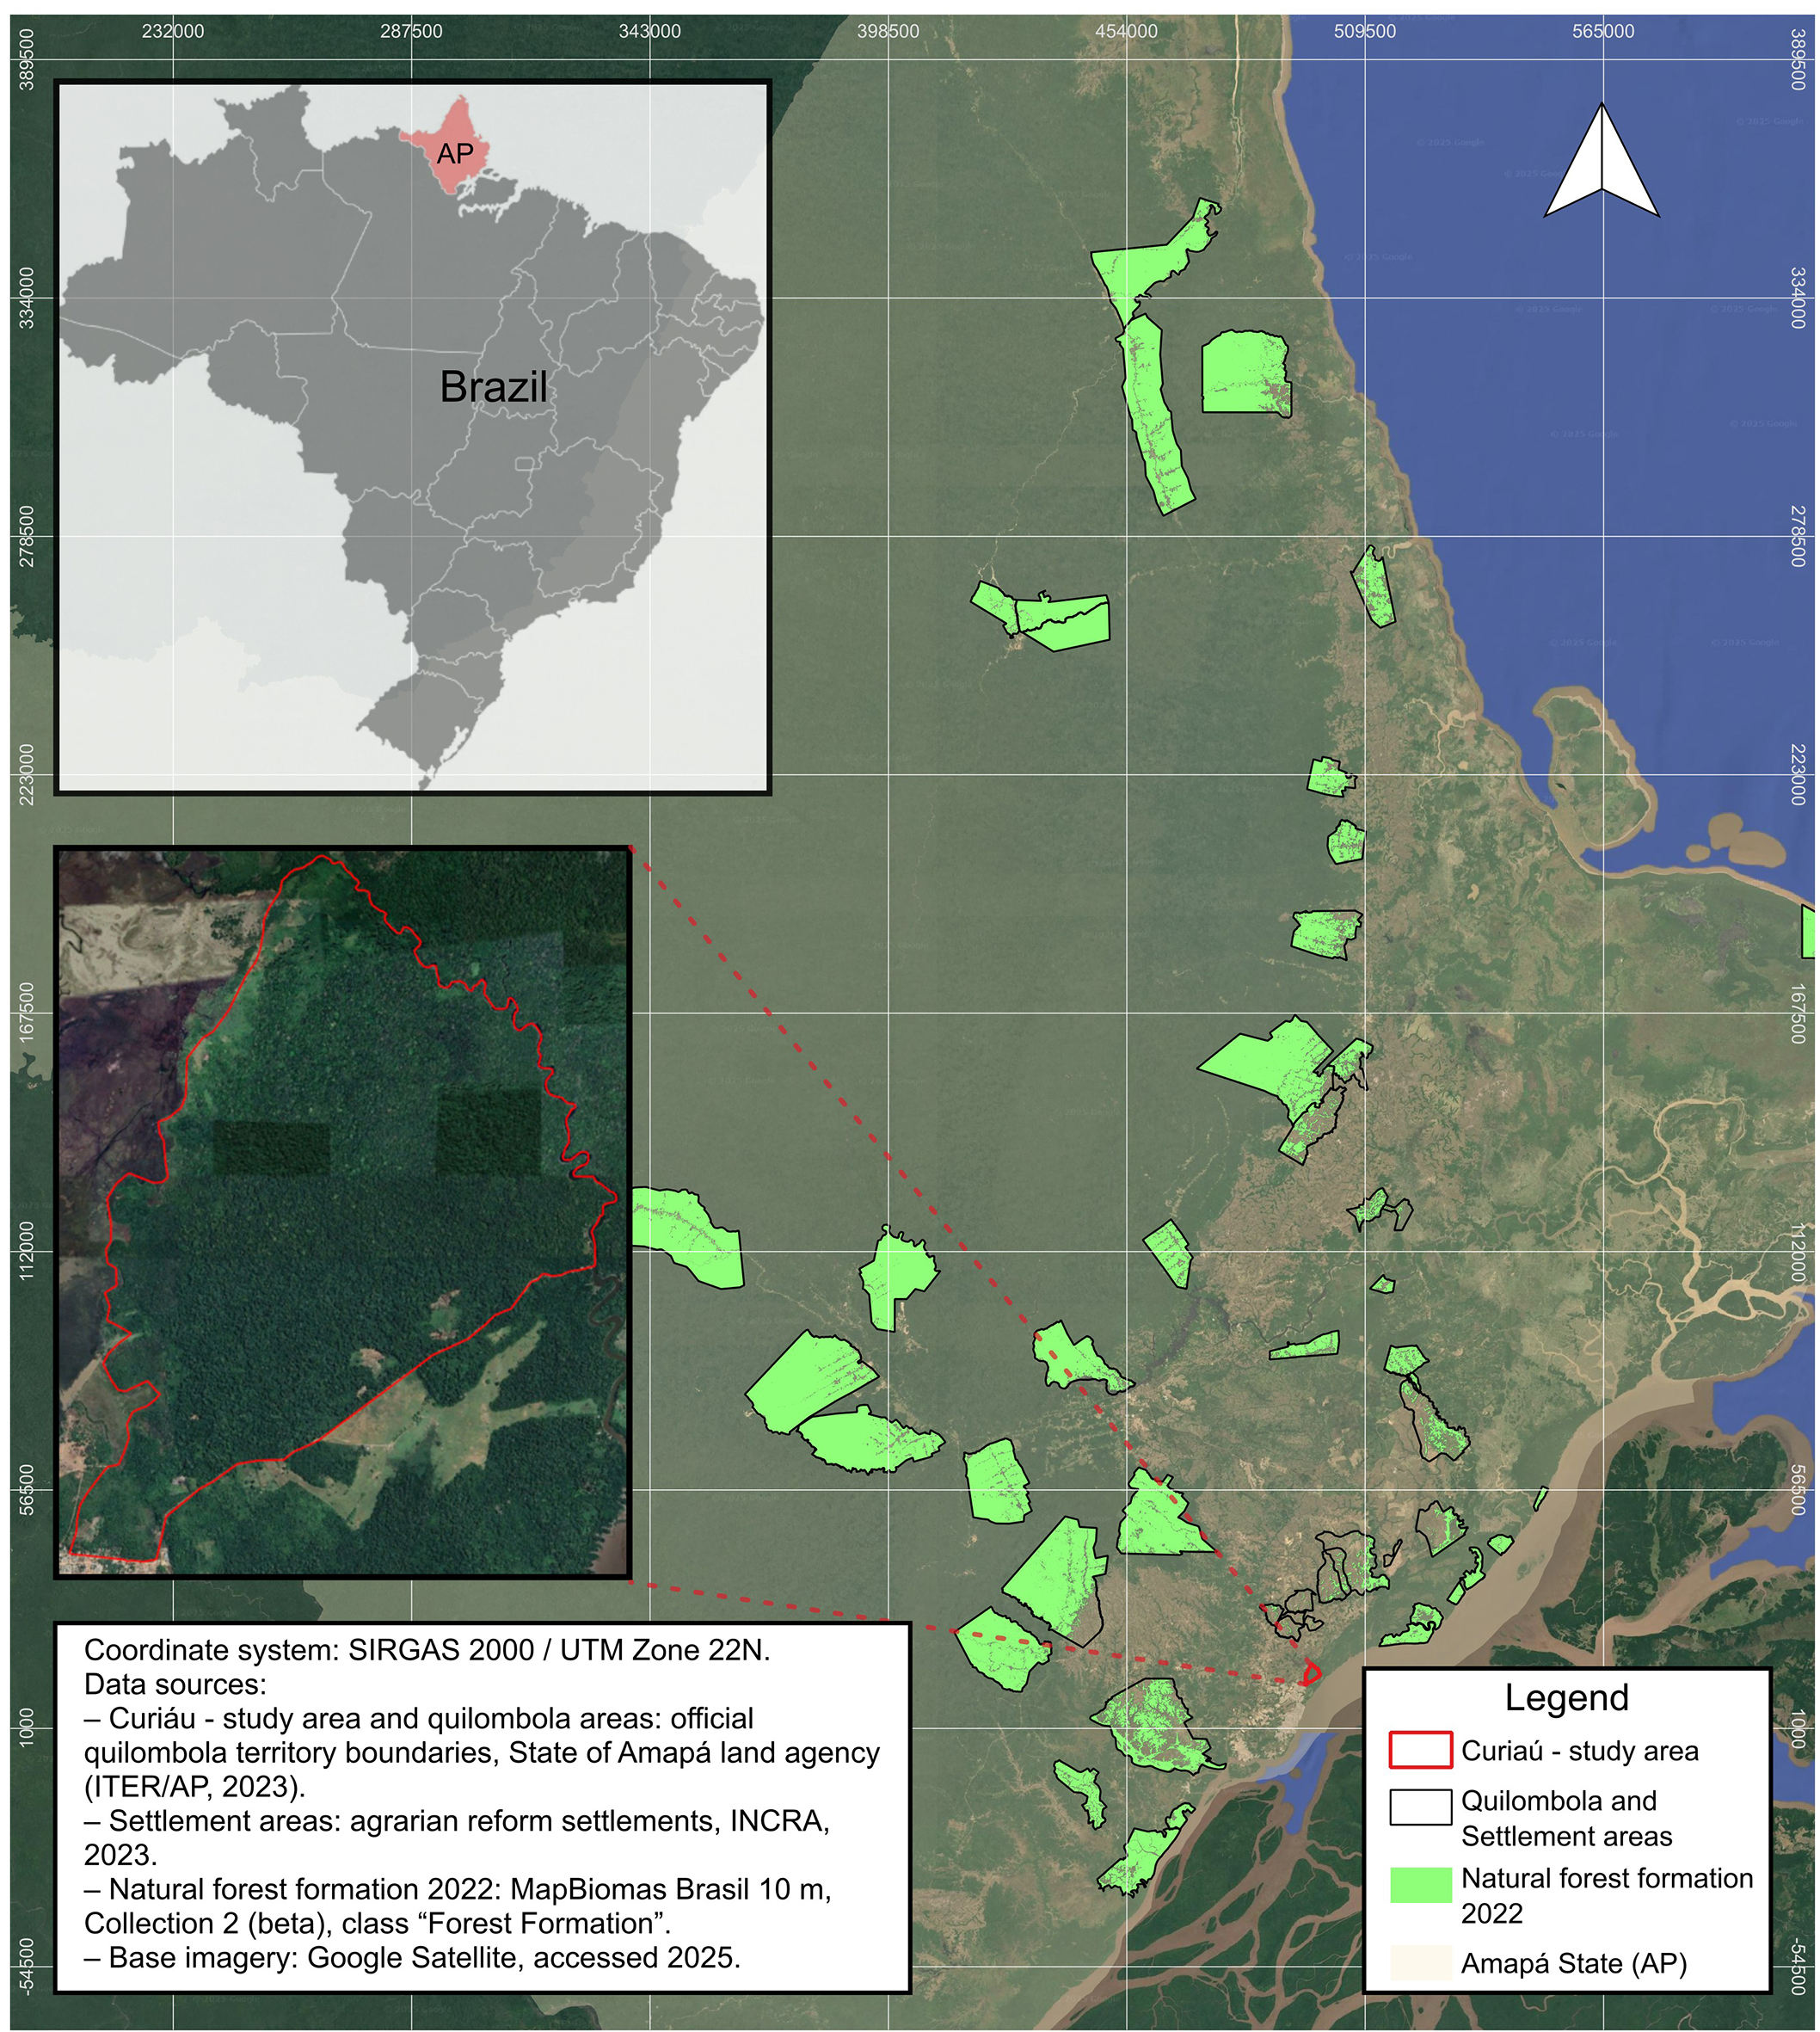
Figure 3. Project area (Curiaú) and reference region, including Quilombola territories and settlements filtered according to SCM0011 robustness criteria, and natural forest formation (2022) used for baseline construction. Data sources: Base imagery from Google Earth (Google Satellite imagery), accessed November 2025 (https://earth.google.com); Land-cover data from MapBiomas Brazil Collection 10 (10 m resolution) (https://brasil.mapbiomas.org); Quilombola territory boundaries from Instituto de Terras do Amapá (ITER-AP); Settlement areas from INCRA - National Institute for Colonization and Agrarian Reform (https://www.gov.br/incra); Map prepared in QGIS v.3.42.1 using the SIRGAS 2000/UTM Zone 22N coordinate system.
The reference region was defined by selecting Quilombola territories and agrarian-reform settlements whose land-use systems, tenure and governance arrangements are comparable to Curiaú and that meet the methodology’s minimum robustness criteria: at least ten units and a total forest area in 2022 of at least fifty times Curiaú’s 2022 forest area. To exclude extreme outliers in terms of scale, only units whose natural forest area in 2022 lay between the 5th and 95th percentiles of the distribution across all candidates were retained, thereby removing very small and very large units while maintaining a coherent sample. The resulting reference region is used to characterize deforestation dynamics in mosaics dominated by smallholder and traditional communities.
For each unit in the reference region, the forest area in 2022 and the area of pixels that transitioned from natural forest in 2022 to anthropic classes in 2023 were computed. For this study, only a single annual transition, the 2022-2023 forest-to-anthropic change, was considered as an annual deforestation rate. For each reference unit, an annual deforestation proportion was calculated as the ratio between 2022-2023 deforestation area and 2022 forest area. These proportions were summarized across the reference region, separately for Quilombola territories and settlements, and an overall reference deforestation rate for smallholder-dominated mosaics was derived as an area-weighted mean, using each unit’s 2022 natural-forest area as the weighting factor.
To ensure the integrity of the dynamic baseline, an independent accuracy assessment was conducted through 10-metre land-cover maps. A probability-based stratified random sample of reference points was drawn across the project area and the reference region, with strata defined by mapped class (natural forest and anthropic use) and spatial domain (Curiaú and the external reference units). The sample size was chosen to meet the minimum requirements[42] for each stratum and to allow estimation of user’s accuracy with reasonably narrow confidence intervals. Each sample point was visually interpreted using multi-temporal Sentinel-2 MSI Level-2A imagery at 10-metre resolution from the 2022 baseline year, to verify consistency with the annual land-use and land-cover classification used in the study. Class-specific confusion matrices were constructed to estimate user’s accuracy for map validation, and were used to support a conservative accuracy-based adjustment following Olofsson et al.[29] and IPCC guidance[30], together with the overall accuracy of the map. Unbiased adjusted area estimates were then obtained by applying the overall map accuracy level to the nominal 2022-2023 deforestation areas in both Curiaú and the reference region. The numerical results of the accuracy assessment and the magnitude of the adjustments are reported in the section "RESULTS".
These procedures yield a dynamic “micro-jurisdictional” baseline. Activity data are derived from externally produced land-cover maps, corrected using probability-based accuracy assessment and design-based area estimators, and summarized for a locality-matched reference region rather than generated through counterfactual modelling. For contextual purposes, the resulting baseline structure was qualitatively compared with other consolidated REDD+ frameworks currently applied in the voluntary carbon market.
Estimation of potential credits and climate-resilience analysis
Potential avoided deforestation is quantified as the difference between the dynamic baseline deforestation within Curiaú and a project scenario in which deforestation is avoided. For the year applied, avoided deforestation area is converted into avoided CO2 equivalent (CO2e) emissions using carbon-stock factors from the latest Brazilian Forest Reference Emission Level (FREL)[51] for the forest type corresponding to Curiaú in the official Instituto Brasileiro de Geografia e Estatística (IBGE, the Brazilian national statistical and geographic agency), vegetation map. Leakage deductions and other conservative adjustments are then applied, using parameter values that fall within the range typically adopted by major REDD+ standards in the voluntary carbon market, in order to obtain conservative estimates of net emission reductions that could, in principle, be issued as carbon credits - which are labelled as Social Carbon Units (SCUs)[52] under the applied standard.
Complementarily, Curiaú’s potential carbon credit volumes are linked to an illustrative climate-resilience analysis focusing on flood-related damage to agricultural plots and on the gradual adoption of regenerative practices on existing cropland and pasture. The analysis is explicitly stylized and uses only externally sourced parameters. First, a set of plausible carbon-price scenarios for high-integrity forest and REDD+ credits is defined based on recent market reports documenting transaction prices for credits with social and environmental co-benefits. Under each scenario, annual revenues that could flow to the community are approximated and compared with per-hectare cost benchmarks for re-establishing flood-affected cassava-based cropping systems, establishing diversified agroforestry and rehabilitating degraded pastures in Amazonian contexts.
Second, an exploratory regenerative-agriculture component assesses the potential additional contribution of soil organic carbon (SOC) sequestration in Curiaú’s agricultural mosaic, using indicative sequestration factors and cost ranges drawn from studies on conservation agriculture, agroforestry and improved pasture management. This second step provides only order-of-magnitude estimates of additional removals and associated revenues and is treated as a complementary, hypothesis-generating exploration of how regenerative practices could form an additional mitigation and finance pillar alongside avoided deforestation, rather than as a basis for project-level crediting.
RESULTS AND DISCUSSION
This section follows the analytical sequence defined in the study design, progressing from livelihood vulnerability and eligibility to dynamic baseline construction, carbon-credit estimation, and climate-resilience implications.
Livelihood vulnerability
The LVIs indicate that Curiaú exhibits an overall moderate level of livelihood vulnerability over the survey period. Because LVI-based metrics are primarily designed to compare vulnerability across communities or social units within a given study context, rather than to establish universally applicable absolute cut-offs, their interpretation should be treated as contextual[45,50]. In line with this, empirical studies tend to apply interpretive ranges that vary according to the regional setting, the variables included, and the scale of analysis[45,50]. Accordingly, the thresholds adopted here are interpreted as operational eligibility screening values under the applied methodology[43], rather than universally applicable benchmarks. Against this interpretive background, Curiaú is classified as meeting the methodology’s eligibility screening thresholds [Table 2].
Curiaú LVIs scores, classifications and thresholds for eligibility
Within the applied methodological framework, livelihood vulnerability is not treated solely as a descriptive metric, but as a criterion to identify contexts where carbon finance can generate additional social and land-use decision effects[42,43]. In this sense, the use of vulnerability-based eligibility thresholds is consistent with the broader logic of carbon finance approaches, which prioritize contexts where financial incentives are more likely to influence land-use decisions and enhance adaptive capacity, thus reducing reversals and enhancing permanency.
The LVI-SF equals 0.39, which falls within the vulnerability bands commonly interpreted in empirical applications as "vulnerable" (0.21 to 0.40)[50], while the LVI-SF-IPCC equals -0.04, which falls within the "moderate vulnerability" range in IPCC-consistent applications (-0.19 to 0.20)[50]. Livelihood strategies, financial stability, social networks, natural disasters and climate variability, and socio-demographic characteristics exhibit the highest values, ranging from 0.34 to 0.69 [Table 1; Supplementary Table 1]. These results indicate moderate to severe vulnerability across multiple livelihood dimensions, with particular concentration in structural and socio-economic domains. In contrast, basic household needs, such as food, housing and drinking water display a markedly low score (0.01), reflecting low vulnerability in this domain and suggesting that the community has access to essential goods and services sufficient to support developmental processes.
Within the LVI-SF-IPCC framework, the results reveal a moderate yet structurally significant exposure to climate-related stressors, with the aggregated “Exposure” component reaching 0.34 - the highest among the IPCC vulnerability components. This exposure profile is consistent with the documented flood-proneness of Amazonian floodplain and delta systems in the lower Amazon region, where seasonal and extreme flooding constitute recurrent hazards for agricultural livelihoods and settlement infrastructure[53-55]. Perceived impacts of climate variability are already evident within agricultural production systems, particularly through constraints on water availability, which show a comparable magnitude (0.24), indicating that exposure is not merely theoretical but already translates into observable livelihood pressures.
Sensitivity-related indicators further reinforce this interpretation. Elevated scores associated with agricultural production and market constraints indicate that hydroclimatic shocks are effectively transmitted into livelihood stress through coupled biophysical and economic pathways. In particular, production and yield-related indicators average 0.66, reflecting exposure to crop and livestock losses and reliance on external inputs, while rainfall dependence and episodic water scarcity contribute an additional sensitivity of 0.24. Market access constraints, although less dominant, remain present, with a market-related sensitivity score of 0.16, indicating that climate-induced production shocks can propagate into income and access pressures.
At the same time, agricultural diversity indicators point to a structural source of sensitivity, with the agricultural diversity component reaching 0.59 (higher value, lower diversity), indicating limited diversification of cropping and livestock systems. This constrains households’ ability to absorb and redistribute production and market shocks under recurrent flooding. This pattern is consistent with empirical studies from Amazonian floodplain and smallholder systems showing that where present, diversified cropping portfolios, high on-farm agrobiodiversity and flexible land-use strategies can partially buffer production and market impacts, even under high flood exposure[53,56,57].
The most binding structural constraint emerges in the adaptive-capacity domain. High pre-inversion scores in adaptive-capacity-related indicators - particularly those capturing limited access to agricultural training, weak exposure to alternative production systems and restricted learning and knowledge-sharing networks - translate into low effective adaptive capacity. This pattern suggests that, while some degree of livelihood diversification is present, the community’s capacity to anticipate, absorb and transform in response to recurrent climate stressors remains constrained by institutional and informational barriers.
It is important to note that the LVI applied here represents a time-bound diagnostic, based on recent household conditions reported in the survey, and therefore does not imply persistence of vulnerability over time. While livelihood conditions may evolve in response to climatic shocks, market dynamics, or policy changes, the role of the LVI within the applied framework is to establish initial eligibility and contextualize additionality at project entry[43,52]. The temporal dynamics of land-use outcomes are instead captured through the annually updated ex post baseline, which operates independently of the LVI and reflects observed deforestation behavior in the reference region[43]. At the same time, socio-economic constraints and climate-related impacts on livelihoods, such as reduced productive capacity or delayed recovery of agricultural systems, often persist beyond a single year, reinforcing the relevance of vulnerability as an entry condition[36,38,39]. Under the applied standard, project cycles operate over defined timeframes (e.g., 10 years), allowing vulnerability to function as an entry condition while enabling its reassessment in subsequent cycles as socio-economic conditions evolve.
Accuracy assessment and dynamic deforestation baseline
The independent validation of the 2022 MapBiomas 10-m land-cover map using 200 visually interpreted points yielded an overall accuracy of 94%, with user’s accuracy of 98% for natural forest and 90% for anthropic classes [Table 3]. These values exceed the class-level user’s accuracy threshold set by the applied methodology for 10-m products without published regional validation (above 90%) and are within or above the range of forest and overall accuracies reported for widely used global 10-m land-cover datasets such as ESA WorldCover and Esri Land Cover[58,59]. Binomial 95% confidence intervals for class-level user’s accuracy were ±2.7% points for natural forest and ±5.9% points for anthropic classes, confirming the adequacy of the sample size. Although uncertainty was higher for anthropic classes, confidence intervals remained sufficiently narrow to support the application of the map within the adopted baseline-adjustment framework.
Classification accuracy for the 2022 MapBiomas 10-m land-cover map and global reference
Across the 47 reference units (Quilombola territories and agrarian settlements), encompassing 531,272 ha of natural forest in 2022, the weighted mean annual deforestation rate between 2022 and 2023 was 0.74%. Classification error was accounted for using the probability-based area-adjustment procedure defined in the avoided deforestation framework[42], based on the overall map accuracy and the class-specific confusion matrix structure. Following this adjustment, the baseline deforestation rate applied to Curiaú was conservatively rounded to 0.70%.
In 2022, Curiaú’s forest area was estimated at 915 hectares through remote sensing. Based on this dynamic baseline, an expected deforestation of approximately 6.4 hectares was projected for 2023 in the absence of targeted interventions. The spatial pattern of 2022-2023 forest loss in a subset of the reference smallholder and traditional territories is shown in Figure 4.
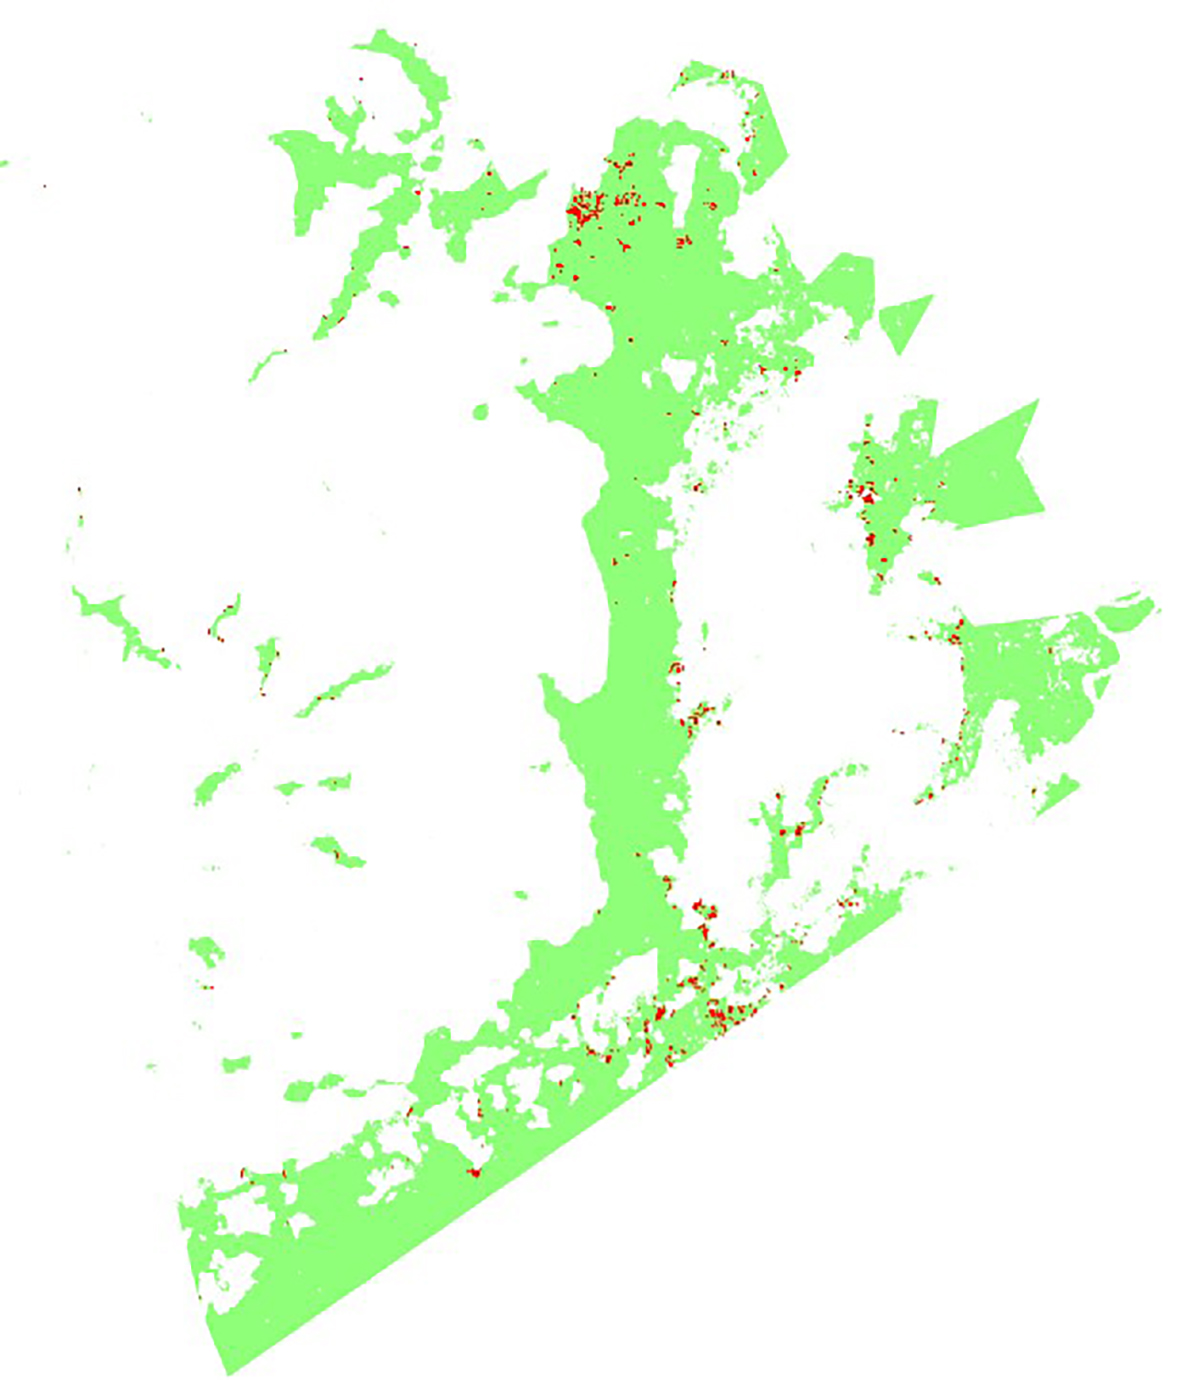
Figure 4. The dynamic baseline (2022-2023) under the avoided deforestation framework. Light green shows areas mapped as natural forest formation in 2022, and red pixels indicate forest converted to anthropic land-use classes between 2022 and 2023. Data source: MapBiomas Brazil Collection 10 (10 m resolution) (https://brasil.mapbiomas.org); Map processed in QGIS v.3.42.1.
The official deforestation data for the region of comparison come from PRODES (Satellite Monitoring Program for Deforestation in the Brazilian Legal Amazon). PRODES provides annual clear-cut deforestation estimates for the entire Legal Amazon since 1988, based on interpretation of Landsat, CBERS and Sentinel satellite imagery. For 2022-2023, the published deforestation was approximately 9,000 km2, equivalent to approximately 0.18% of the biome’s total area[60]. This macro-scale percentage is not directly comparable to the proportional 0.74% reference-region rate used in this study, as PRODES measures absolute annual clear-cutting across the entire Legal Amazon rather than proportional forest loss within mosaics of smallholder and traditional territories. For contextual comparison at the jurisdictional scale relevant to the study area, PRODES reports that, in the same monitoring year, the state of Amapá accounted for only
Complementing this, MapBiomas data[61] indicate that the state of Amapá experienced approximately
While these macro-scale percentages provide important contextual information, they include a large proportion of intact forest with much lower deforestation rates compared with smallholder-dependent and currently fragmented forest. The higher proportional rates observed reflect the small-denominator effect typical of smallholder mosaics. For Curiaú community, the baseline shows a modest deforestation risk, consistent with a peri-urban Quilombola landscape where forest conservation coexists with increasing external pressures. Such results align with recent evidence that carbon losses derived from the edge effect induced by fragmentation affect 97% of global forest[62]. By deriving the baseline solely from recent transitions from natural forest to anthropic use in structurally similar territories and adjusting for classification error using design-based area estimation, this dynamic baseline strengthens best practices for uncertainty-aware deforestation baselines in smallholder landscapes[15,29] and promote the social equality as well.
We further contrast our approach with consolidated jurisdictional frameworks. In consolidated REDD+ frameworks such as Verra’s VM0048[63] methodology and its VMD0055[64] module, project baselines for avoiding unplanned deforestation are anchored in observed land-cover change but are constructed at much larger jurisdictional scale as dynamic baselines that are periodically updated. Jurisdictional activity data on unplanned deforestation are generated by the owner institution or contracted data service providers using high-resolution satellite imagery, forest-cover benchmark maps and sample-based area estimation over a recent historical reference period; The dynamic baseline implemented for Curiaú under our framework follows the same broad principle of grounding baselines in observed deforestation but does so at a micro-jurisdictional scale and with a fully ex post temporal framing tailored to smallholder mosaics. Instead of receiving a multi-year allocation of jurisdictional activity data, Curiaú’s baseline is calculated directly from last-year forest-to-anthropic transitions observed in a reference region of 47 other, socioeconomically comparable smallholder territories. All underlying deforestation areas are first corrected using a probability-based accuracy assessment of the 10 m land-cover maps, so that uncertainty is incorporated through design-based area estimation rather than post hoc discounting of baseline activity data. Relative to different REDD+ frameworks such as VM0048 and VMD0055, this approach appears to offer a comparatively simple, equitable and transparent baseline that can be updated ex post year by year as new land-cover data become available, while still aligning with emerging integrity expectations by anchoring baselines dynamically in externally observed behavior beyond the project boundary and limiting the scope for project-developer discretion in baseline setting.
This temporal design implies that each credited year is benchmarked against observed deforestation dynamics within the same period, rather than against an aggregated historical average. While multi-year reference periods can potentially reduce sensitivity to atypical conditions in individual years, they also smooth temporal variability and introduce assumptions regarding the selection of historical windows. By contrast, the annual ex post construction adopted here captures year-to-year fluctuations and provides real carbon emission reduction directly.
Collectively, these design features reinforce the integrity of the carbon emission reduction. The combination of a dynamic ex post baseline anchored in observed deforestation, locality-matched reference regions that constrain discretionary baseline setting, and probability-based accuracy assessment with design-based area estimation strengthens baseline credibility and data robustness in response to concerns that methodological choices can inflate avoided-deforestation claims[26-28].
Within the applied framework[42], livelihood vulnerability enters the additionality logic as a screening condition that complements conventional additionality assessment procedures. As in established AFOLU methodologies, additionality is demonstrated through the identification of plausible alternative land-use scenarios with the application of structured additionality tests (e.g., barrier or investment analyses)[42,63]. The inclusion of a vulnerability-based filter therefore introduces an additional layer that constrains eligibility to contexts in which socio-economic limitations, restricted adaptive capacity and non-trivial deforestation pressure coexist, increasing the likelihood that climate-finance revenues are materially relevant to land-use decisions. In this sense, the framework differs from actor-neutral REDD+ approaches, including VM0048[63], not in the structure of additionality demonstration itself, but in explicitly conditioning where it is applied. This is particularly relevant in light of broader implementation and equity constraints observed in natural climate solutions and smallholder contexts[35-37]. Framed in this way, vulnerability-based screening may reduce the likelihood of crediting areas where forest retention would plausibly persist in the absence of carbon revenues, while also helping to counterbalance structural barriers associated with transaction-cost-intensive systems that tend to favor larger or better-capacitated landholders[38,39,41]. At the same time, by identifying binding livelihood constraints, it provides a basis for linking revenues to interventions that address the underlying drivers of land-use change, thereby strengthening the conditions under which additionality becomes effective in practice[65].
Potential emission reductions and carbon credit generation
The forest-type specific emission factor in alluvial dense ombrophilous forest from Brazil’s national Forest Reference Emission Level (FREL)[51] is adopted. Total live biomass carbon stocks (above- and below-ground) is 108.25 tons of carbon per hectare. Applying the dynamic baseline deforestation rate of 0.70% for 2023 yields 2,540 tCO2e of baseline emissions [Table 4]. Following a conservative 20% deduction, consistent with buffer-pool requirements in standards such as Gold Standard[33], the American Carbon Registry[66] and the UK Woodland Carbon Code[67], 80% of avoided emissions is treated as creditable. This deduction reflects standard approaches to account for non-permanence and related risks, ensuring that credited volumes represent net climate benefits after conservative adjustment, in line with the integrity-oriented design discussed in Section “Accuracy assessment and dynamic deforestation baseline”.
Curiaú baseline emissions and potential carbon credits generation
| Variable | Value |
| Carbon stock - above and belowground biomass, 2022 | 108.25 tC ha-1 |
| Equivalent carbon stock - above and belowground biomass, 2022 | 397 tCO2e ha-1 |
| Curiaú forest area, 2022 | 915 ha |
| Baseline deforestation, 2023 | 6.4 ha |
| Gross baseline emissions, 2023 | 2,540 tCO2e |
| Credited fraction (conservative assumption) | 80% |
| Potential carbon credits, 2023 | 2,032 tCO2e |
This results in an annual credit of approximately 2,032 tCO2e. This volume is much smaller relative to large project- and jurisdiction-scale REDD+ initiatives that issue millions of credits, such as national and jurisdictional programs in Guyana and Gabon under ART-TREES standard[68], but it is consistent with and essential to Curiaú’s forest-dependent smallholders.
Generally, the baseline estimates (Section “Accuracy assessment and dynamic deforestation baseline”), avoided emissions, and resulting credit potential (Section “Potential emission reductions and carbon credit generation”) illustrate how the proposed framework operates in a smallholder forest landscape such as Curiaú. Similar outcomes are expected in settings with comparable livelihood structures and levels of vulnerability (Section “Livelihood vulnerability”), together with similar ecological conditions - where equivalent or higher forest carbon stocks and deforestation pressure are present - as observed in other traditional and Indigenous territories across the Pan-Amazon[19]. Under these conditions, the dynamic micro-jurisdictional baseline can be applied consistently to estimate avoided emissions and potential credits. By contrast, the climate-resilience finance implications (Section “Climate-resilience finance”) depend more directly on locally derived vulnerability profiles and livelihood conditions, as reflected in the LVI results.
Climate-resilience finance
Illustrative restoration potential from avoided deforestation credits
Nature-based and forestry credits with strong sustainable-development co-benefits generally were traded at a premium relative to undifferentiated units. Ecosystem Marketplace’s State of the Voluntary Carbon Markets[69] reports average prices for forestry and land-use credits in the range of a few US dollars per ton, with higher-quality segments, such as removals or strong co-benefits, often transacting in the mid-teens to low twenties (around US$15-25 per ton of equivalent CO2, US$ tCO2e-1). World Bank State and Trends of Carbon Pricing[70,71] reports highlight that carbon prices compatible with Paris-aligned trajectories need to move towards at least US$25-50 tCO2e-1 by 2030. This study hence applies an illustrative credit price band of US$20-40 tCO2e-1 for high-integrity, co-benefit-certified avoided deforestation units, which is conservative relative to compliance market prices yet within the upper range of recent voluntary-market transactions for premium nature-based credits.
On the cost side, Embrapa studies of family-farming cassava systems in the eastern Amazon report establishment costs of R$7,400-9,600 ha-1 under predominantly manual operations[72,73], which corresponds to roughly US$1,300-1,700 ha-1 in 2022 prices for a representative smallholder cassava field in Pará, neighboring state of Amapá. Independent economic analyses of smallholder agroforestry systems in Pará, including cocoa-based arrangements, indicate substantially higher establishment costs: on the order of R$20,000 ha-1 for a relatively simple cocoa-banana arrangement and R$39,000 ha-1 for a more diversified cocoa-açaí-cassava-maize system, implying approximately US$4,000-8,000 ha-1 depending on the exchange rate[74]. Complementary macro-level estimates from the Brazilian Bioeconomy Observatory and associated pasture-restoration cost studies suggest that recovering degraded pastures in Brazil typically requires R$900-R$1,800 ha-1 for moderately degraded areas and R$1,500-2,400 ha-1 for severely degraded areas, representing roughly US$180-480 ha-1, depending on location and degradation level[75,76].
Taken together, these estimates are consistent with a stylized cost spectrum in which (i) re-establishing annual cassava-maize plots after a flood or crop failure requires approximately US$1,300- 1,700 ha-1, (ii) fully establishing diversified cacao agroforestry systems requires several thousand US dollars per hectare, typically around US$4,000-8,000 ha-1 over the first three years, and (iii) basic soil and pasture rehabilitation can be achieved at a few hundred US dollars per hectare - roughly US$180-480 ha-1.
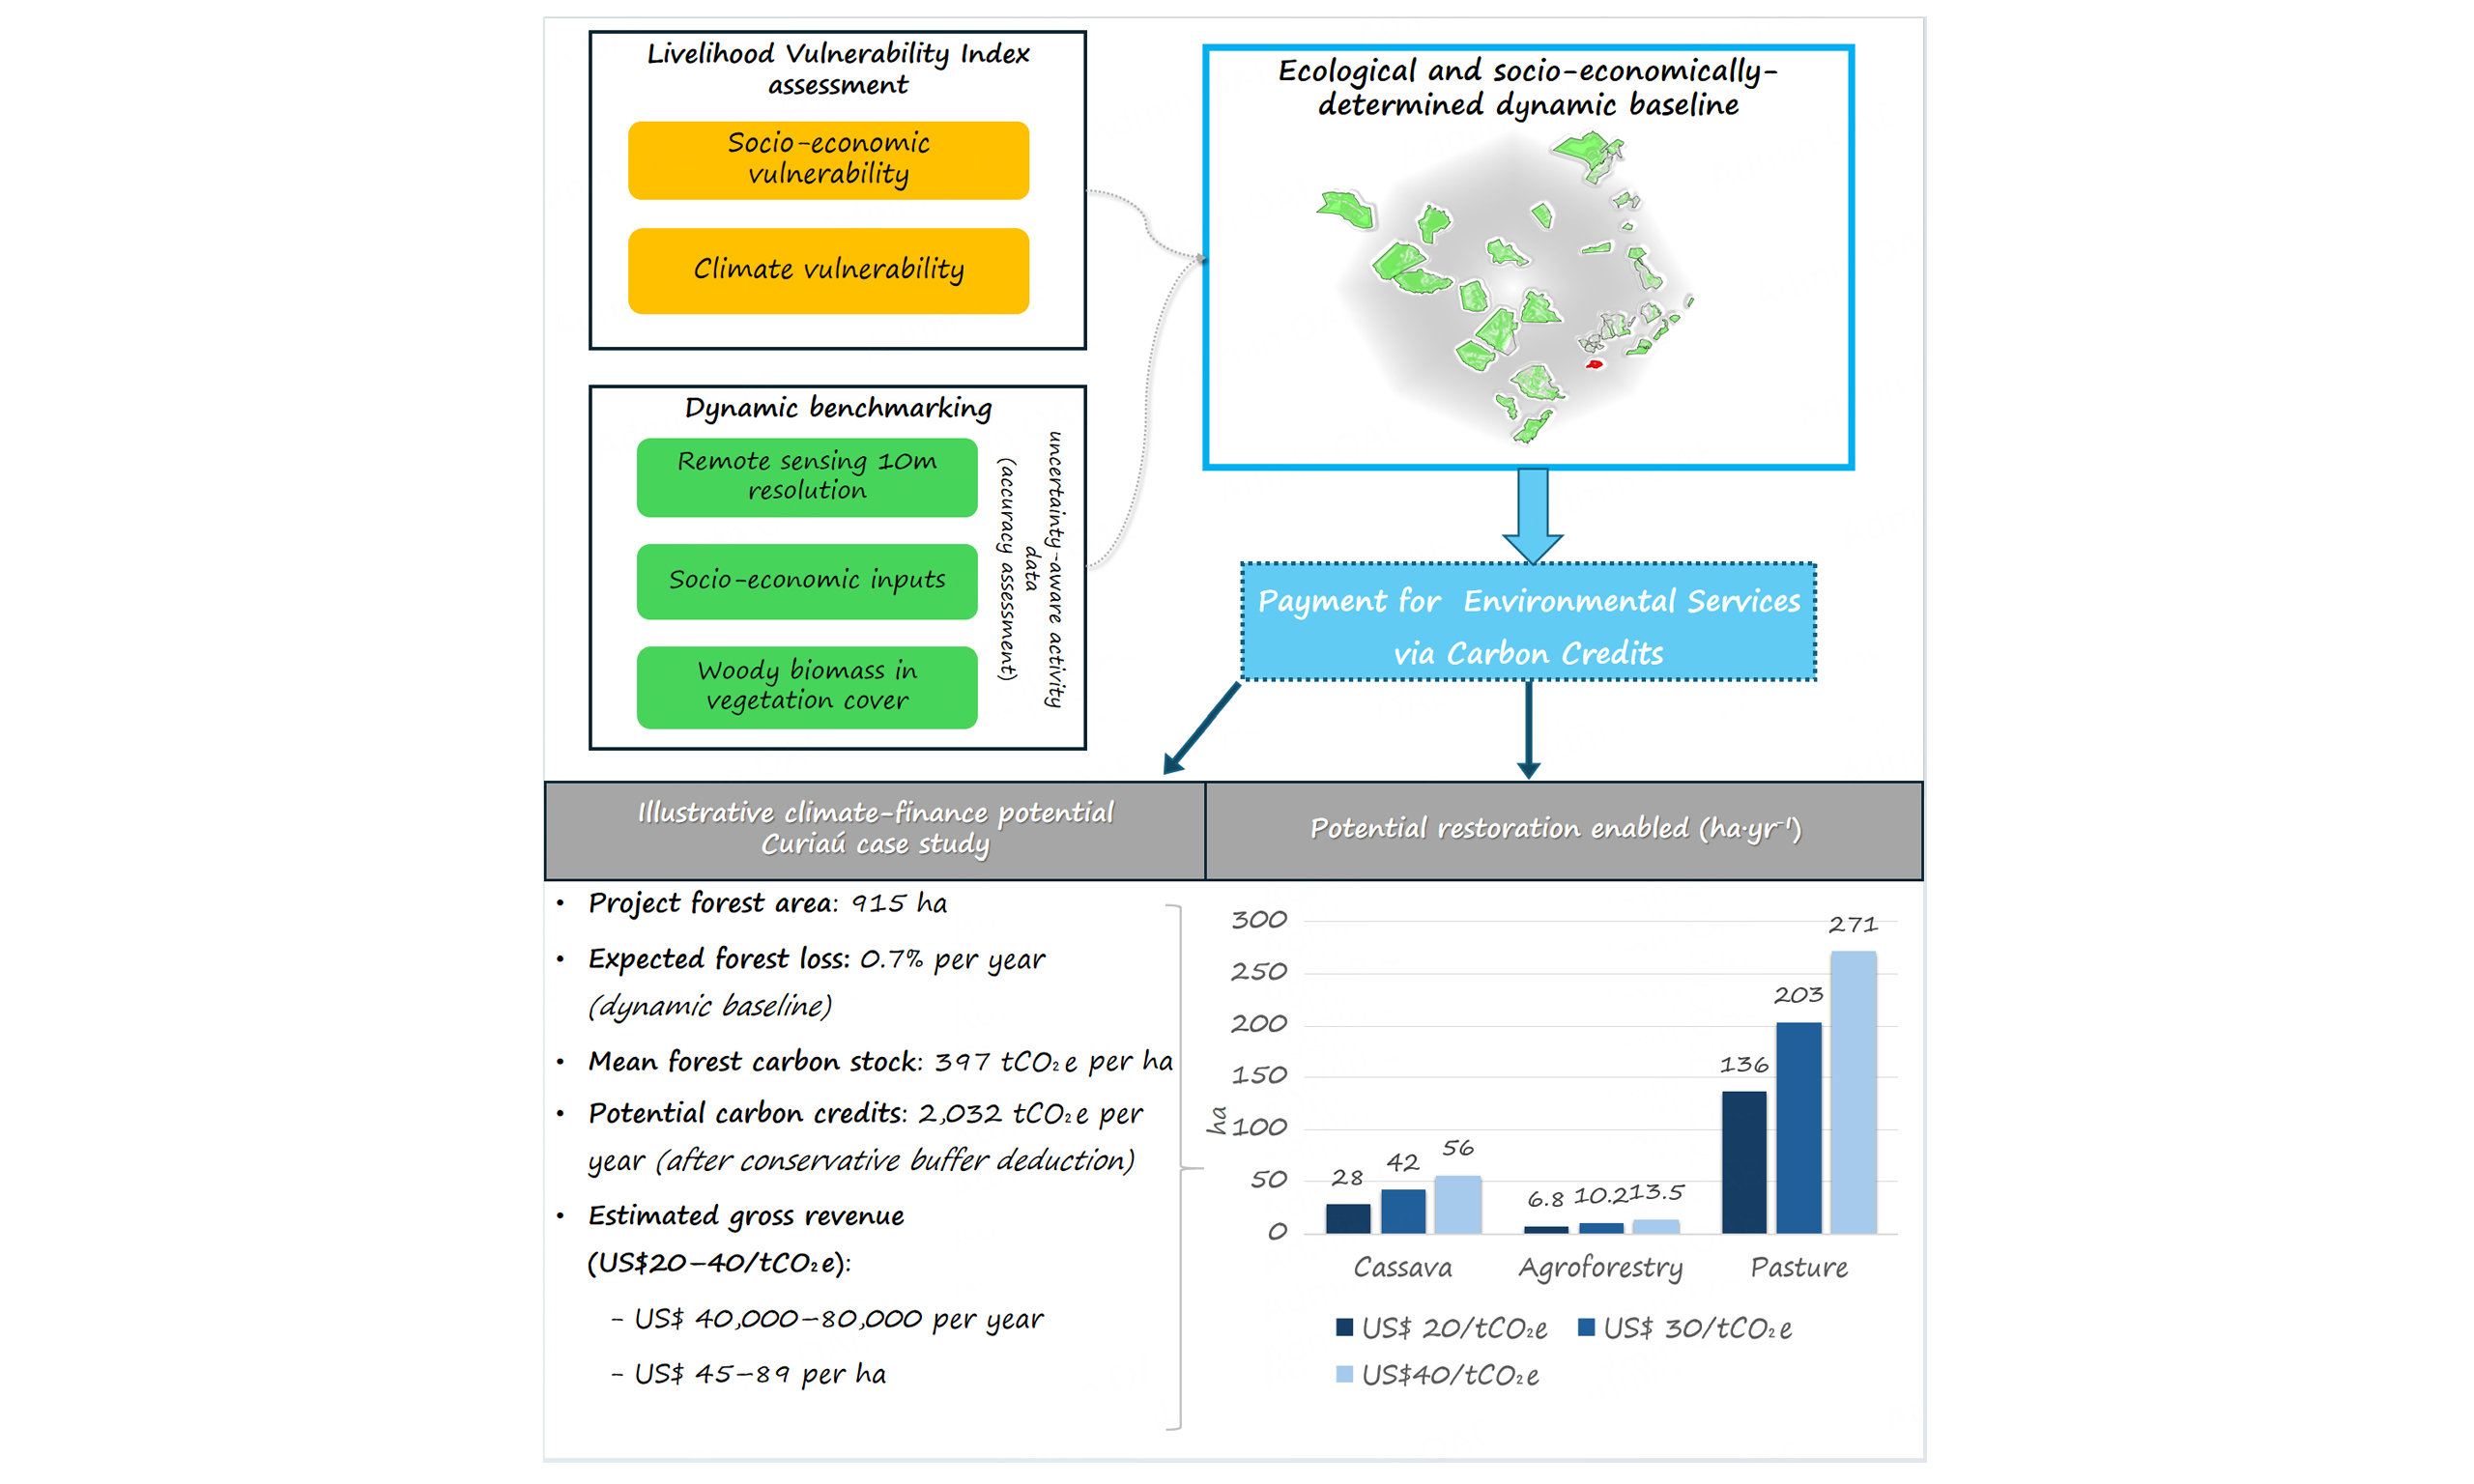
Under the dynamic baseline derived in this study, the issuance of 2,032 carbon credits per year would yield annual gross climate-finance inflows of approximately US$40,640, US$60,960 and US$81,280 at prices of US$20 tCO2e-1, US$30 tCO2e-1 and US$40 tCO2e-1, respectively [Table 5]. Using the cost benchmarks above, these amounts would be sufficient, in order of magnitude, to finance the re-establishment of roughly 30-60 ha of cassava-based cropping or about 7-14 ha of diversified agroforestry per year, while basic pasture rehabilitation could be implemented over on the order of 130-270 additional hectares given its lower per-hectare cost.
Estimated carbon credit revenues and restoration area under different price scenarios
| Price (US$ tCO2e-1) | Annual credits (tCO2e year-1) | Annual revenue (US$ year-1) | Estimated cassava area (ha) | Estimated agroforestry area (ha) | Estimated pasture area (ha) |
| 20 | 2,032 | 40,640 | 28 | 6.8 | 136 |
| 30 | 2,032 | 60,960 | 42 | 10.2 | 203 |
| 40 | 2,032 | 81,280 | 56 | 13.5 | 271 |
Limitations of carbon finance and the role of regenerative agriculture
In the Curiaú Quilombola territory, agriculture is dominated by small mosaics of cassava and maize fields interspersed with grazed pasture. Although land-use strategies vary across families, a severe flood scenario could affect a substantial share of cultivated and grazed land within a single year. The several dozen hectares that could be re-established annually with the US$40,000-80,000 would potentially correspond to only a fraction of the agricultural area on which households depend for food and income. This is because these illustrative preliminary calculations do not explicitly incorporate other post-event re-establishment costs - such as housing, basic infrastructure and equipment - the ongoing expenses of maintaining forest-conservation arrangements, or the transaction, monitoring and certification costs associated with high-integrity carbon projects. As a result, the net share of carbon-credit revenues that could be directed to re-establishing production systems is likely to be considerably smaller than the gross figures reported
For this reason, the analysis refrains from identifying a minimal break-even carbon price based solely on a small number of hectares of restored production and instead interprets the US$20-40 tCO2e-1 range as a normative benchmark under which carbon-credit revenues play a catalytic but clearly partial role. Consistent with risk-layering approaches in climate and disaster risk finance and in the emerging Loss and Damage literature, which distinguish resources for risk reduction and transformational adaptation, for managing residual risks and post-disaster recovery, and for addressing unavoidable losses and damages[77-79], an illustrative three-pillar allocation can be considered for the specific study case in which approximately one half of net carbon-credit revenues is directed to the re-establishment of annual cassava-based cropping and basic pasture rehabilitation after extreme events, while the remaining half is divided equally between maintaining forest-conservation arrangements (including community monitoring and enforcement) and financing gradual transitions towards more climate-resilient agroecological and agroforestry systems. This structure is also coherent with the literature on payments for environmental services and benefit-sharing, which emphasizes that high-integrity schemes should simultaneously reward the provision of environmental services, support local livelihoods and invest in longer-term changes in land-use practices[80,81].
Global meta-analyses of agroforestry systems and pasture management indicate that, on average, converting cropland or pasture to agroforestry and adopting more intensive or otherwise improved grazing management tend to increase above- and below-ground carbon stocks, while in many cases enhancing indicators of system resilience and livelihood stability[82,83]. Evidence from experimental and farm-level studies in the eastern Amazon is broadly consistent with these findings, reporting higher biomass and soil organic carbon, improved soil structure and greater species and functional diversity in agroforestry systems established on previously degraded pasture, as well as under improved pasture management, when compared with degraded pasture baselines[84,85]. In this sense, directing a defined share of carbon-credit revenues towards the gradual expansion of agroforestry and improved pasture management can be interpreted as an investment in both mitigation and adaptation co-benefits, when implemented within the financial and operational constraints discussed above, rather than as a purely short-term recovery measure.
Beyond the avoided deforestation component, this second mitigation lever in Curiaú, represented by the gradual adoption of regenerative practices on existing cropland and pasture, is subject to potential additional removals and incomes through incremental soil organic carbon (SOC) gains. Meta-analyses of cover cropping, diversified rotations and reduced soil disturbance in croplands generally report SOC sequestration rates in the upper 0-30 cm on the order of 0.30-0.60 tC ha-1 yr-1[86], with mean values around 0.32 tC ha-1 yr-1 for cover crops in global datasets and 0.56 tC ha-1 yr-1 when pooling a broader set of conservation-agriculture practices[87]. Converted to CO2-equivalent, these ranges correspond to approximately 1.1-2.2 tCO2e ha-1 yr-1 under well-implemented conservation agriculture on cropland[86,87]. Recent syntheses of agroforestry systems are broadly consistent with these magnitudes, showing substantial increases in SOC stocks when annual cropping systems are converted to tree-crop associations, with stock gains on the order of 25%-40% in the upper soil layers compared to conventional cropland[88] and global assessments highlighting a large technical potential for additional SOC storage in agroforestry soils[89].
In Brazilian pasture systems, a meta-analysis of 169 paired comparisons across 14 states found that degradation of grasslands leads to SOC losses of about 0.25 tC ha-1 yr-1 in the upper 0-30 cm, whereas recovering degraded pastures to nominal or improved management can sequester SOC at rates of roughly 0.25-0.54 tC ha-1 yr-1[90]. Converted to CO2-equivalent, these gains correspond to roughly
Applied to Curiaú’s 2023 land-use structure - where approximately 17 ha of temporary crops and 174 ha of pasture, as classified in the MapBiomas land-cover dataset[61], constitute the officially titled community area that is distinct from the 915 ha forest block used in the avoided deforestation analysis - a stylized scenario used only for order-of-magnitude illustration, in which all cropland shifts to conservation-agriculture management and all degraded or nominal pasture is restored to well-managed condition, would therefore imply on the order of 180-350 tCO2e yr-1 of additional soil-related removals. Under the same illustrative carbon-price band of US$20-40 tCO2e-1 used above, this corresponds to a supplementary revenue band of roughly US$4,000-14,000 yr-1, over and above the avoided deforestation potential estimated in Section “Potential emission reductions and carbon credit generation”.
Taken together, these stylized comparisons reinforce that revenues from avoided deforestation carbon credits in smallholder-dominated mosaics can play a partial yet potentially catalytic role in supporting climate-resilient livelihood trajectories in Curiaú community. Even under relatively favorable price assumptions, such revenues can finance the re-establishment of only a limited area of staple crops and pasture and the incremental expansion of agroforestry systems, while leaving limited room for covering transaction, monitoring and certification costs that are necessary for high-integrity projects and for enabling both forest-conservation and soil-management interventions. In this context, beyond the combination of high-integrity avoided deforestation and regenerative-agriculture methodologies, complementary private or public instruments become central. In Brazil, the National Policy on Payment for Environmental Services (PES) (Law 14.119/2021)[91] and program-level initiatives such as Floresta+ Amazônia[92] explicitly aim to channel payment-for-environmental-services resources to family farmers and traditional communities and can, in principle, contribute to covering enabling costs such as technical assistance, organizational support and certification-related expenses. Aligning methodologies such as SCM0011 with policies and programs would increase the likelihood that communities can appropriate a larger share of carbon and PES revenues, strengthening existing forest-conservation practices while facilitating a gradual transition towards agroecological, agroforestry and other regenerative production systems, in line with broader evidence on the design of effective payment for environmental services and benefit-sharing arrangements[80,81].
Limitations and implications for implementation
The present application has several limitations that should be made explicit. First, as discussed in Section “Livelihood vulnerability”, the LVI thresholds used here are operational screening values under the applied methodology rather than universally valid vulnerability cut-offs[43,45,50]. Relatedly, the LVI functions as a time-bound entry diagnostic, based on recent household conditions, and therefore does not capture the full temporal evolution of vulnerability over the project duration. Although the applied standard allows reassessment across project cycles, this design implies a trade-off between operational feasibility and temporal representativeness in the use of vulnerability as part of additionality. Second, the livelihood diagnosis is based on a non-probability household sample and should therefore be interpreted as characterizing the community rather than providing statistically representative estimates for all sub-groups. Third, the empirical application is restricted to a single Quilombola territory, which limits direct extrapolation of the observed LVI profile, baseline behavior and finance implications to other smallholder or traditional-community settings with different socio-ecological configurations.
Additional limitations arise from the baseline and finance components. As discussed in Section “Accuracy assessment and dynamic deforestation baseline”, the annual ex post baseline is more responsive to observed deforestation dynamics than multi-year averaging, but this same responsiveness may generate interannual variation in baseline levels, credit volumes and expected revenues, which can complicate long-term financial planning in community-based projects[28]. Baseline robustness also remains conditional on the stability and classification performance of the adopted land-use product, even when conservative accuracy adjustments are applied[29]. In turn, the climate-resilience analysis in Section “Climate-resilience finance” is intentionally illustrative: it does not fully internalize certification, transaction, monitoring and organizational costs, and therefore likely overstates the share of gross revenues that could be effectively appropriated for livelihood recovery and adaptation. The same applies to the regenerative-agriculture component, which is framed as exploratory and order-of-magnitude only, rather than as a project-crediting estimate. Taken together, these limitations do not invalidate the proposed framework, but indicate that its strongest contribution at present lies in structuring a credible and socially targeted entry point for smallholder forest carbon initiatives, rather than in offering a fully generalizable or financially complete implementation model.
CONCLUSION
The Curiaú case study shows that a vulnerability-based eligibility approach can be effectively operationalized within a Quilombola territory in a technically rigorous manner, while maintaining social equity as a central component of project design. The application of the Livelihood Vulnerability Indexes confirms Curiaú within the moderate vulnerability range according to commonly adopted classifications in the literature, while also meeting the module-defined thresholds for social eligibility. The results indicate that this approach is particularly suited to smallholder and traditional-community contexts where livelihood vulnerability, exposure to climate-related disturbances, and measurable forest-use pressures coexist, as observed in Curiaú, provided that a representative household-level survey is available to compose the LVI and that accurate high-resolution land-use and land-cover data are available to construct a dynamic baseline. In practical terms, this means that the approach is most applicable to forest-oriented communities with predominantly conservationist land-use dynamics, where baseline deforestation is limited or absent, but where the surrounding reference still presents sufficient deforestation pressure, as in the Amapá state.
Importantly, the LVIs provide a robust foundation for diagnosis and evaluation of the effectiveness of interventions, serving as a baseline against which changes in vulnerability can be tracked through repeated assessments over time. These assessments following interventions - such as the implementation of carbon credit schemes - can enable the measurement of impacts on community resilience. In this way, the LVIs function not only as a diagnostic instrument but also as a framework for assessing additionality and project effectiveness.
Additionally, the construction of an ex post dynamic deforestation baseline using open 10-metre land-cover data, independent accuracy assessment and design-based area estimation indicates that high-integrity avoided deforestation accounting is feasible in relatively small, heterogeneous landscapes dominated by smallholders and traditional communities, such as Quilombola territories. These procedures contribute to current debates on the integrity and transparency of baselines for small-scale REDD+-type initiatives. In combination with the LVI, the approach is consistent with core additionality and integrity expectations increasingly articulated by the ICVCM while explicitly incorporating social equity considerations. However, the results also show that the estimated carbon revenues, while relevant, are insufficient on their own to fully address the identified livelihood constraints, reinforcing their role as a complementary mechanism rather than a standalone solution.
Taken together, the Curiaú results indicate that maintaining forest conservation emerges as a central priority for payment for environmental services such as carbon credits, while the allocation of resulting revenues can directly reflect the key constraints identified at the community level. In this case, this includes directing support toward the recovery, resilience, and improved management of already converted agricultural areas, alongside strengthening adaptive capacity through the adoption of regenerative agricultural practices consistent with the constraints identified by the vulnerability assessment.
DECLARATIONS
Acknowledgments
We gratefully acknowledge the Quilombola community of Curiaú for their engagement in the survey and for their openness and collaboration, which were essential to the development of this study.
Authors’ contributions
Conceptual development and study design: Chaib, J.; Davies, M.; Wang, H.
Writing of the original draft and overall supervision: Chaib, J.; Wang, H.
Data collection and data analysis: Pinheiro, C.; Smith, G.; Chaib, J.
Reviewed, edited and approved the final manuscript: Chaib, J.; Corsini, C.; Davies, M.; Smith, G.; Pinheiro, C.; Centeno, D.; Ratsimbazafy, N.; Feldmann, R.; Wang, H.
Availability of data and materials
The datasets used and/or analyzed in the current study are available from the corresponding author upon reasonable request.
AI and AI-assisted tools statement
Not applicable.
Financial support and sponsorship
None.
Conflicts of interest
Smith, G. is affiliated with ReSeed P.B.C., Public Benefit Corporation, while the other authors have declared that they have no conflicts of interest.
Ethical approval and consent to participate
This study involved human participants through household-level survey questionnaires. Participation was voluntary, and informed consent was obtained from all participants prior to data collection. No personal identifiers were recorded, and responses were anonymized before analysis. The research did not involve clinical procedures, biological sampling, or interventions.
Consent for publication
Not applicable.
Copyright
© The Author(s) 2026.
Supplementary Materials
REFERENCES
1. Lowder, S. K.; Skoet, J.; Raney, T. The number, size, and distribution of farms, smallholder farms, and family farms worldwide. World. Dev. 2016, 87, 16-29.
2. Ricciardi, V.; Ramankutty, N.; Mehrabi, Z.; Jarvis, L.; Chookolingo, B. How much of the world's food do smallholders produce? Glob. Food. Secur. 2018, 17, 64-72.
3. Ricciardi, V.; Mehrabi, Z.; Wittman, H.; James, D.; Ramankutty, N. Higher yields and more biodiversity on smaller farms. Nat. Sustain. 2021, 4, 651-7.
4. Levers, C.; Romero-muñoz, A.; Baumann, M.; et al. Agricultural expansion and the ecological marginalization of forest-dependent people. Proc. Natl. Acad. Sci. USA. 2021, 118, e2100436118.
5. IPCC. IPCC climate change 2014: impacts, adaptation, and vulnerability; Part A: global and sectoral aspects contribution of working group II to the fifth assessment report of the IPCC. Cambridge University Press: Cambridge, UK, 2015.
6. Arima, E. Y.; Barreto, P.; Araújo, E.; Soares-Filho, B. Public policies can reduce tropical deforestation: lessons and challenges from Brazil. Land. Use. Policy. 2014, 41, 465-73.
7. Godar, J.; Gardner, T. A.; Tizado, E. J.; Pacheco, P. Actor-specific contributions to the deforestation slowdown in the Brazilian Amazon. Proc. Natl. Acad. Sci. USA. 2014, 111, 15591-6.
8. Tyukavina, A.; Hansen, M. C.; Potapov, P.; et al. Congo basin forest loss dominated by increasing smallholder clearing. Sci. Adv. 2018, 4, eaat2993.
9. Curtis, P. G.; Slay, C. M.; Harris, N. L.; Tyukavina, A.; Hansen, M. C. Classifying drivers of global forest loss. Science 2018, 361, 1108-11.
10. Amaral, S.; Metzger, J. P.; Rosa, M.; Adorno, B. V.; Gonçalves, G. C.; Guedes, Pinto. L. F. Alarming patterns of mature forest loss in the Brazilian Atlantic Forest. Nat. Sustain. 2025, 8, 256-64.
11. He, X.; Spracklen, D. V.; Holden, J.; Zeng, Z. Tropical montane forest loss dominated by increased 1-10 hectare-sized patches. Environ. Res. Lett. 2025, 20, 024039.
12. Wang, M.; Hu, C.; Barnes, B. B.; Mitchum, G.; Lapointe, B.; Montoya, J. P. The great Atlantic Sargassum belt. Science 2019, 365, 83-7.
13. Qin, Y.; Wang, D.; Ziegler, A. D.; Fu, B.; Zeng, Z. Impact of Amazonian deforestation on precipitation reverses between seasons. Nature 2025, 639, 102-8.
14. Grant, L.; Vanderkelen, I.; Gudmundsson, L.; Fischer, E.; Seneviratne, S. I.; Thiery, W. Global emergence of unprecedented lifetime exposure to climate extremes. Nature 2025, 641, 374-9.
15. Griscom, B. W.; Adams, J.; Ellis, P. W.; et al. Natural climate solutions. Proc. Natl. Acad. Sci. USA. 2017, 114, 11645-50.
16. Ricketts, T. H.; Soares-filho, B.; Da, Fonseca. G. A. B.; et al. Indigenous lands, protected areas, and slowing climate change. PLoS. Biol. 2010, 8, e1000331.
17. Nepstad, D.; Schwartzman, S.; Bamberger, B.; et al. Inhibition of Amazon deforestation and fire by parks and indigenous lands. Conserv. Biol. 2006, 20, 65-73.
18. Porter-Bolland, L.; Ellis, E. A.; Guariguata, M. R.; Ruiz-Mallén, I.; Negrete-Yankelevich, S.; Reyes-García, V. Community managed forests and forest protected areas: an assessment of their conservation effectiveness across the tropics. For. Ecol. Manag. 2012, 268, 6-17.
19. Blackman, A.; Corral, L.; Lima, E. S.; Asner, G. P. Titling indigenous communities protects forests in the Peruvian Amazon. Proc. Natl. Acad. Sci. USA. 2017, 114, 4123-8.
20. Pfaff, A.; Robalino, J.; Sanchez-Azofeifa, G. A.; Andam, K. S.; Ferraro, P. J. Park location affects forest protection: land characteristics cause differences in park impacts across costa rica. BE. J. Econ. Anal. Policy. 2009, 9.
21. Pfaff, A.; Robalino, J.; Herrera, D.; Sandoval, C. Protected areas’ impacts on Brazilian Amazon deforestation: examining conservation – development interactions to inform planning. PLoS. ONE. 2015, 10, e0129460.
22. Altieri, M.; Nicholls, C.; Montalba, R. Technological approaches to sustainable agriculture at a crossroads: an agroecological perspective. Sustainability 2017, 9, 349.
23. Torres, B.; Maza, O. J.; Aguirre, P.; Hinojosa, L.; Günter, S. Contribution of traditional agroforestry to climate change adaptation in the Ecuadorian Amazon: the chakra system. In: Leal Filho W, editors. Handbook of climate change adaptation. Berlin, Heidelberg: Springer; 2014. pp. 1-19.
24. IFAD; Climate Policy Initiative (CPI). Examining the climate finance gap for small-scale agriculture. London, UK: Climate Policy Initiative (CPI), 2020. Available from: https://www.ifad.org/en/web/knowledge/-/publication/examining-the-climate-finance-gap-for-small-scale-agriculture [Last accessed on 29 Apr 2026].
25. Berg, T.; Nieto, E. A.; Moura, S.; et al. Socio-ecological conflict in Quilombola territory: land titling and ecosystem health. Sustain. Sci. 2025, 20, 903-18.
26. West, T. A. P.; Börner, J.; Sills, E. O.; Kontoleon, A. Overstated carbon emission reductions from voluntary REDD+ projects in the Brazilian Amazon. Proc. Natl. Acad. Sci. USA. 2020, 117, 24188-94.
27. West, T. A.; Bomfim, B.; Haya, B. K. Methodological issues with deforestation baselines compromise the integrity of carbon offsets from REDD+. Global. Environ. Chang. 2024, 87, 102863.
28. Teo, H. C.; Tan, N. H. L.; Zheng, Q.; et al. Uncertainties in deforestation emission baseline methodologies and implications for carbon markets. Nat. Commun. 2023, 14, 8277.
29. Olofsson, P.; Foody, G. M.; Herold, M.; Stehman, S. V.; Woodcock, C. E.; Wulder, M. A. Good practices for estimating area and assessing accuracy of land change. Remote. Sens. Environ. 2014, 148, 42-57.
30. IPCC. 2019 Refinement to the 2006 IPCC Guidelines for National Greenhouse Gas Inventories; Geneva, Switzerland, 2019. Available from: https://www.ipcc.ch/report/2019-refinement-to-the-2006-ipcc-guidelines-for-national-greenhouse-gas-inventories [Last accessed on 29 Apr 2026].
31. Verra. VCS standard, version 4.5; Washington, DC, USA, 2023. Available from: https://verra.org/verra-releases-version-4-5-of-the-vcs-standard [Last accessed on 29 Apr 2026].
32. Verra. AFOLU non-permanence risk tool; Washington, DC, USA, 2023. Available from: https://verra.org/verra-releases-updated-afolu-non-permanence-risk-tool [Last accessed on 29 Apr 2026].
33. Gold Standard Foundation. Land use and forests activity requirements; Geneva, Switzerland, 2023. Available from: https://globalgoals.goldstandard.org/203-ar-luf-activity-requirements [Last accessed on 29 Apr 2026].
34. Plan Vivo Foundation. PV climate project requirements; Edinburgh, UK, 2024. Available from: https://s3.eu-west-2.amazonaws.com/assets.planvivo.org/documents/PV-Climate_Project-Requirements_V5.5.pdf [Last accessed on 29 Apr 2026].
35. Brumberg, H.; Hegwood, M.; Eichhorst, W.; Lopresti, A.; Erbaugh, J. T.; Kroeger, T. Global analysis of constraints to natural climate solution implementation. PNAS. Nexus. 2025, 4, pgaf173.
36. Ellis, P. W.; Page, A. M.; Wood, S.; et al. The principles of natural climate solutions. Nat. Commun. 2024, 15, 547.
37. Kroeger, T.; Erbaugh, J.; Luo, Z.; et al. Implementation constraints on natural climate solutions: a global literature review and survey. Review 2025.
38. Fisher, B.; Lewis, S. L.; Burgess, N. D.; et al. Implementation and opportunity costs of reducing deforestation and forest degradation in Tanzania. Nature. Clim. Chang. 2011, 1, 161-4.
39. Merger, E.; Held, C.; Tennigkeit, T.; Blomley, T. A bottom-up approach to estimating cost elements of REDD+ pilot projects in Tanzania. Carbon. Balance. Manag. 2012, 7, 9.
40. De Sy, V.; Herold, M.; Achard, F.; et al. Synergies of multiple remote sensing data sources for REDD+ monitoring. Curr. Opin. Environ. Sustain. 2012, 4, 696-706.
41. Köhl, M.; Neupane, P. R.; Mundhenk, P. REDD+ measurement, reporting and verification – A cost trap? Implications for financing REDD+MRV costs by result-based payments. Ecol. Econ. 2020, 168, 106513.
42. Social Carbon Foundation. SCM0011 - Methodology for avoided deforestation on smallholdings; London, UK, 2025. Available from: https://www.socialcarbon.org/scm0011 [Last accessed on 29 Apr 2026].
43. Social Carbon Foundation. SCD0004: smallholder livelihood vulnerability index module, version 1.0; London, UK, 2025. Available from: https://www.socialcarbon.org/scd0004 [Last accessed on 29 Apr 2026].
44. Scoones, I. Sustainable rural livelihoods: a framework for analysis; The Institute of Development Studies and Partner Organisations: Brighton, UK, 1998. Available from: https://www.ids.ac.uk/publications/sustainable-rural-livelihoods-a-framework-for-analysis/ [Last accessed on 29 Apr 2026].
45. Hahn, M. B.; Riederer, A. M.; Foster, S. O. The livelihood vulnerability index: a pragmatic approach to assessing risks from climate variability and change - A case study in Mozambique. Global. Environ. Chang. 2009, 19, 74-88.
46. Brazil. Constituição da República federativa do Brasil de 1988. Ato das Disposições Constitucionais Transitórias (ADCT); 1988. Available from: https://www.planalto.gov.br/ccivil_03/constituicao/constituicao.htm#adct [Last accessed on 6 May 2026] (in Portuguese).
48. Instituto Socioambiental (ISA). Comunidades quilombolas de São Paulo são atingidas por cheia do Rio Ribeira de Iguape. Available from: https://www.socioambiental.org/noticias-socioambientais/comunidades-quilombolas-de-sao-paulo-sao-atingidas-por-cheia-do-rio [Last accessed on 29 Apr 2026] (in Portuguese).
49. MapBiomas Project. Algorithm Theoretical Basis Document (ATBD): MapBiomas Brazil 10 m; São Paulo, Brazil, 2025. Available from: https://brasil.mapbiomas.org/wp-content/uploads/sites/4/2025/08/ATBD-Collection-10-v1.pdf [Last accessed on 29 Apr 2026].
50. Islam, A.; Ghosh, S. A comparison of performance measures of two livelihood vulnerability indices in the context of recurrent tropical flood hazards. Nat. Hazards. Res. 2024, 4, 498-506.
51. Ministério do Meio Ambiente e Mudança do Clima (MMA). Brazil’s forest reference emission level (FREL) for the Amazon Biome - 2024 Update; Brasília, Brazil, 2024. Available from: https://redd.unfccc.int/media/brazil-national-frel_modified_v3_clean-13-mar-2024.pdf [Last accessed on 29 Apr 2026] (in Portuguese).
52. Social Carbon Foundation. Social carbon standard; London, UK, 2024. Available from: https://www.socialcarbon.org/nature3 [Last accessed on 29 Apr 2026].
53. Oviedo, A. F.; Mitraud, S.; Mcgrath, D. G.; Bursztyn, M. Implementing climate variability adaptation at the community level in the Amazon floodplain. Environ. Sci. Policy. 2016, 63, 151-60.
54. Mansur, A. V.; Brondizio, E. S.; Roy, S.; De Miranda Araújo Soares, P. P.; Newton, A. Adapting to urban challenges in the Amazon: flood risk and infrastructure deficiencies in Belém, Brazil. Reg. Environ. Chang. 2017, 18, 1411-26.
55. Towner, J.; Cloke, H. L.; Lavado, W.; et al. Attribution of Amazon floods to modes of climate variability: A review. Meteorol. . Appl. 2020, 27, e1949.
56. Ávila, J. V. D. C.; Ticktin, T.; Steward, A. M.; Giehl, E. L. H.; Cantor, M.; Clement, C. R. Recovery of local agrobiodiversity after an extreme flood in Amazon floodplains. Biol. Conserv. 2024, 292, 110536.
57. Bravo-Peña, F.; Yoder, L. Agrobiodiversity and smallholder resilience: a scoping review. J. Environ. Manag. 2024, 351, 119882.
59. Impact Observatory. Land use land cover (LULC) maps on demand 2018-2022. Available from: https://www.esri.com/partners/impact-observatory-a2T5x0000084pJXEAY/land-use-land-cover--a2d5x000005juReAAI [Last accessed on 29 Apr 2026].
60. Instituto Nacional de Pesquisas Espaciais (INPE). Nota Técnica PRODES Amazônia 2023: estimativa de desmatamento na Amazônia Legal para 2023; São José dos Campos, Brazil, 2023. Available from: https://www.gov.br/inpe/pt-br/assuntos/ultimas-noticias/estimativa-de-desmatamento-na-amazonia-legal-para-2023-e-de-9-001-km2 [Last accessed on 29 Apr 2026] (in Portuguese).
61. MapBiomas Project. Projeto MapBiomas - collection 8.0: annual series of land use and land cover map; São Paulo, Brazil, 2024. Available from: https://brasil.mapbiomas.org/colecoes-mapbiomas [Last accessed on 29 Apr 2026].
62. Yang, G.; Crowther, T. W.; Lauber, T.; Zohner, C. M.; Smith, G. R. A globally consistent negative effect of edge on aboveground forest biomass. Nat. Ecol. Evol. 2025, 9, 2036-45.
63. Verra. Methodology for avoided unplanned deforestation; Washington, DC, USA, 2023. Available from: https://verra.org/methodologies/vm0015-methodology-for-avoided-unplanned-deforestation-v1-2 [Last accessed on 29 Apr 2026].
64. Verra. Jurisdictional and nested REDD+ baseline module; Washington, DC, USA, 2023. Available from: https://verra.org/programs/jurisdictional-nested-redd-framework [Last accessed on 29 Apr 2026].
65. Delacote, P.; Le, Velly. G.; Simonet, G. Distinguishing potential and effective additionality of forest conservation interventions. Environ. Dev. Econ. 2024, 29, 518-38.
66. American Carbon Registry (ACR). ACR non-permanence risk mitigation requirements; Arlington, VA, USA, 2020. Available from: https://acrcarbon.org/wp-content/uploads/2023/07/ACR-Standard-v7.0-Dec-2020.pdf [Last accessed on 29 Apr 2026].
67. Forestry Commission. Woodland carbon code: requirements for voluntary woodland creation projects; Edinburgh, UK, 2022. Available from: https://www.woodlandcarboncode.org.uk/sites/default/files/2025-05/Woodland_Carbon_Code_V2.2_April_2022.pdf [Last accessed on 29 Apr 2026].
68. Architecture for REDD+ Transactions (ART). Using carbon markets to protect forests at risk: a case study of jurisdictional REDD+ in Guyana; Washington, DC, USA, 2024. Available from: https://artredd.org/using-carbon-markets-to-protect-forests-at-risk-a-case-study-of-jurisdictional-redd-in-guyana/ [Last accessed on 29 Apr 2026].
69. Ecosystem Marketplace. State of the voluntary carbon markets 2023; Washington, DC, USA, 2023. Available from: https://www.ecosystemmarketplace.com/publications/state-of-the-voluntary-carbon-market-report-2027 [Last accessed on 29 Apr 2026].
70. World Bank. State and trends of carbon pricing 2017; Washington, DC, USA, 2017. Available from: https://documents1.worldbank.org/curated/en/468881509601753549/pdf/State-and-trends-of-carbon-pricing-2017.pdf [Last accessed on 29 Apr 2026].
71. World Bank. State and trends of carbon pricing 2023; Washington, DC, USA, 2023. Available from: https://ppp.worldbank.org/sites/default/files/2023-10/State%20and%20Trends%20of%20Carbon%20Pricing%202023.pdf [Last accessed on 29 Apr 2026].
72. Alves, R. N. B.; Modesto, Júnior. M. S.; eds. Mandioca: agregação de valor e rentabilidade de negócios; Embrapa: Brasília, DF, Brazil, 2019. Available from: https://www.embrapa.br/busca-de-publicacoes/-/publicacao/1108529/mandioca-agregacao-de-valor-e-rentabilidade-de-negocios [Last accessed on 29 Apr 2026] (in Portuguese).
73. Alves, R. N. B.; Modesto, Júnior. M. S.; Cravo, M. S. Custos de produção do sistema de derruba e queima: cultivo de mandioca no sistema de derruba e queima para processamento de raízes para extração de tucupi e colheita de folhas para maniçoba; Embrapa Amazônia Oriental: Belém, PA, Brazil, 2020. Available from: https://www.infoteca.cnptia.embrapa.br/infoteca/bitstream/doc/1127223/1/DOC456.pdf [Last accessed on 29 Apr 2026] (in Portuguese).
74. Ministério da Agricultura Pecuária e Abastecimento (MAPA). Viabilidade econômica de sistemas produtivos com cacau: pleno sol e sistemas agroflorestais nos estados da Bahia e do Pará. Available from: https://www.gov.br/agricultura/pt-br/assuntos/sustentabilidade/cocoaactionbrasil [Last accessed on 29 Apr 2026] (in Portuguese).
75. DATAGRO. Brazilian agriculture yearbook 2022; São Paulo, Brazil, 2022. Available from: http://portal.datagro.com.br [Last accessed on 29 Apr 2026].
76. Carlos, S. M.; Assad, E. D.; Estevam, C. G.; et al. Costs of recovering degraded pastures in the Brazilian States and biomes; Observatório de Conhecimento e Inovação em Bioeconomia, Fundação Getulio Vargas (FGV-EESP): São Paulo, Brazil, 2022. Available from: https://agro.fgv.br/sites/default/files/2023-02/costs_of_recovering_degraded_pastures_in_the_brazilian_states_and_biomes_0.pdf [Last accessed on 29 Apr 2026].
77. World Bank. Financial resilience against climate shocks and disasters: recent progress and new frontiers; Washington, DC, USA, 2023. Available from: https://documents1.worldbank.org/curated/en/099732511072314227/pdf/IDU0893ba78605dc8048f5091f70893ee26173ef.pdf [Last accessed on 29 Apr 2026].
78. Mechler, R.; Deubelli, T. M. Finance for Loss and Damage: a comprehensive risk analytical approach. Curr. Opin. Environ. Sustain. 2021, 50, 185-96.
79. Mechler, R.; Calliari, E.; Bouwer, L. M.; et al. Science for loss and damage. Findings and propositions. In: Mechler R, Bouwer LM, Schinko T, Surminski S, Linnerooth-Bayer J, editors. Loss and damage from climate change. Cham: Springer International Publishing; 2018. pp. 3-37.
80. Wunder, S. Revisiting the concept of payments for environmental services. Ecol. Econ. 2015, 117, 234-43.
81. Börner, J.; Baylis, K.; Corbera, E.; et al. The effectiveness of payments for environmental services. World. Dev. 2017, 96, 359-74.
82. Ramachandran Nair P, Nair VD, Mohan Kumar B, Showalter JM. Carbon sequestration in agroforestry systems. Elsevier; 2010. pp. 237-307.
83. Shi, L.; Feng, W.; Xu, J.; Kuzyakov, Y. Agroforestry systems: meta‐analysis of soil carbon stocks, sequestration processes, and future potentials. Land. Degrad. Dev. 2018, 29, 3886-97.
84. Celentano, D.; Rousseau, G. X.; Paixão, L. S.; et al. Carbon sequestration and nutrient cycling in agroforestry systems on degraded soils of Eastern Amazon, Brazil. Agrofor. Syst. 2020, 94, 1781-92.
85. Marques, J. D.; Dias, V. H. R.; Gomes, M. F.; et al. Soil quality in an agroforestry system in the scenario of family farming in the eastern Amazon. Agrofor. Syst. 2025, 99, 174.
86. Poeplau, C.; Don, A. Carbon sequestration in agricultural soils via cultivation of cover crops - A meta-analysis. Agric. Ecosyst. Environ. 2015, 200, 33-41.
87. Jian, J.; Du, X.; Reiter, M. S.; Stewart, R. D. A meta-analysis of global cropland soil carbon changes due to cover cropping. Soil. Biol. Biochem. 2020, 143, 107735.
88. De Stefano, A.; Jacobson, M. G. Soil carbon sequestration in agroforestry systems: a meta-analysis. Agrofor. Syst. 2017, 147, 285-99.
89. Lorenz, K.; Lal, R. Soil organic carbon sequestration in agroforestry systems. A review. Agron. Sustain. Dev. 2014, 34, 443-54.
90. De Oliveira, D. C.; Maia, S. M. F.; Freitas, R. D. C. A.; Cerri, C. E. P. Changes in soil carbon and soil carbon sequestration potential under different types of pasture management in Brazil. Reg. Environ. Chang. 2022, 22, 87.
91. Brazil. Lei nº 14.119, de 13 de janeiro de 2021: institui a política nacional de pagamento por serviços ambientais e cria o programa federal de pagamento por serviços ambientais. 2021. Available from: https://www.planalto.gov.br/ccivil_03/_ato2019-2022/2021/lei/l14119.htm [Last accessed on 29 Apr 2026] (in Portuguese).
92. Ministério do Meio Ambiente e Mudança do Clima (MMA). Floresta+ Amazônia: pagamentos por serviços ambientais para conservação e recuperação da vegetação nativa na Amazônia legal; Brasília, DF, Brazil, 2023. Available from: https://florestamaisamazonia.mma.gov.br [Last accessed on 29 Apr 2026] (in Portuguese).
Cite This Article
How to Cite
Download Citation
Export Citation File:
Type of Import
Tips on Downloading Citation
Citation Manager File Format
Type of Import
Direct Import: When the Direct Import option is selected (the default state), a dialogue box will give you the option to Save or Open the downloaded citation data. Choosing Open will either launch your citation manager or give you a choice of applications with which to use the metadata. The Save option saves the file locally for later use.
Indirect Import: When the Indirect Import option is selected, the metadata is displayed and may be copied and pasted as needed.
About This Article
Special Topic
Copyright

Data & Comments
Data
0


Comments
Comments must be written in English. Spam, offensive content, impersonation, and private information will not be permitted. If any comment is reported and identified as inappropriate content by OAE staff, the comment will be removed without notice. If you have any queries or need any help, please contact us at support@oaepublish.com.