

fig3
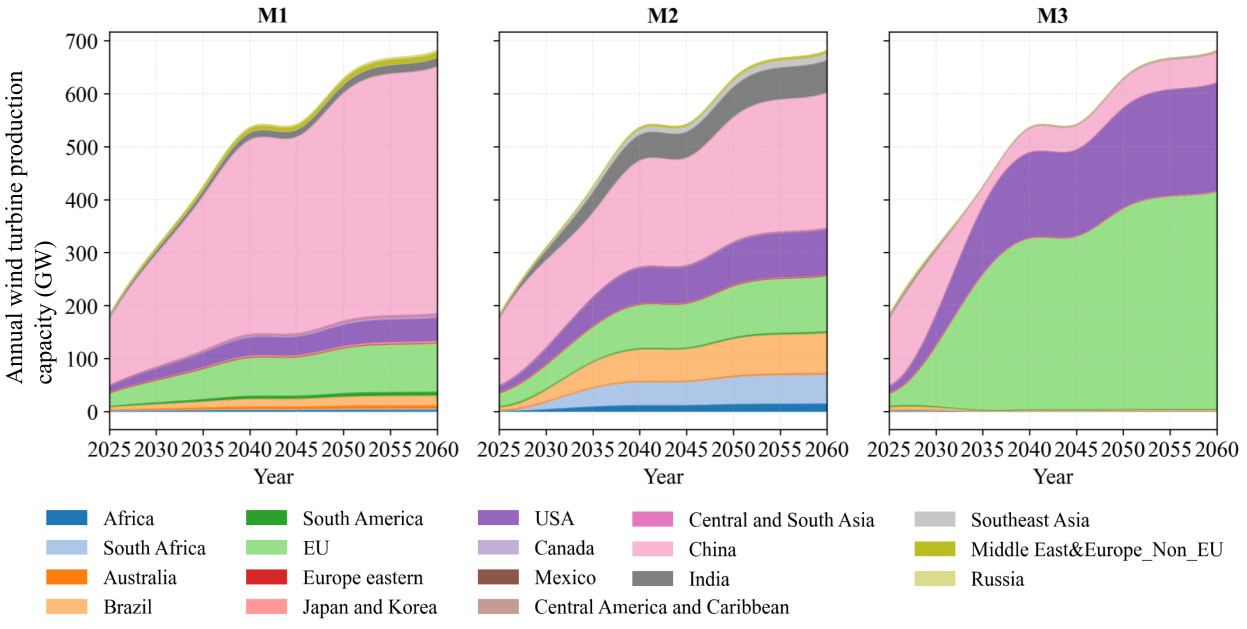
Figure 3. Annual wind turbine production capacity across regions from 2025-2060. In M1 (baseline production scenario), production follows historical regional shares, reflecting existing industrial and supply-chain inertia. In M2 (spatially diversified production scenario), production expands into Southeast Asia and Africa, forming a geographically diversified supply-chain structure. In M3 (clean-oriented production scenario), production is concentrated in low-carbon electricity regions, primarily Europe and North America, to minimize manufacturing-related life cycle carbon emissions.