



fig6
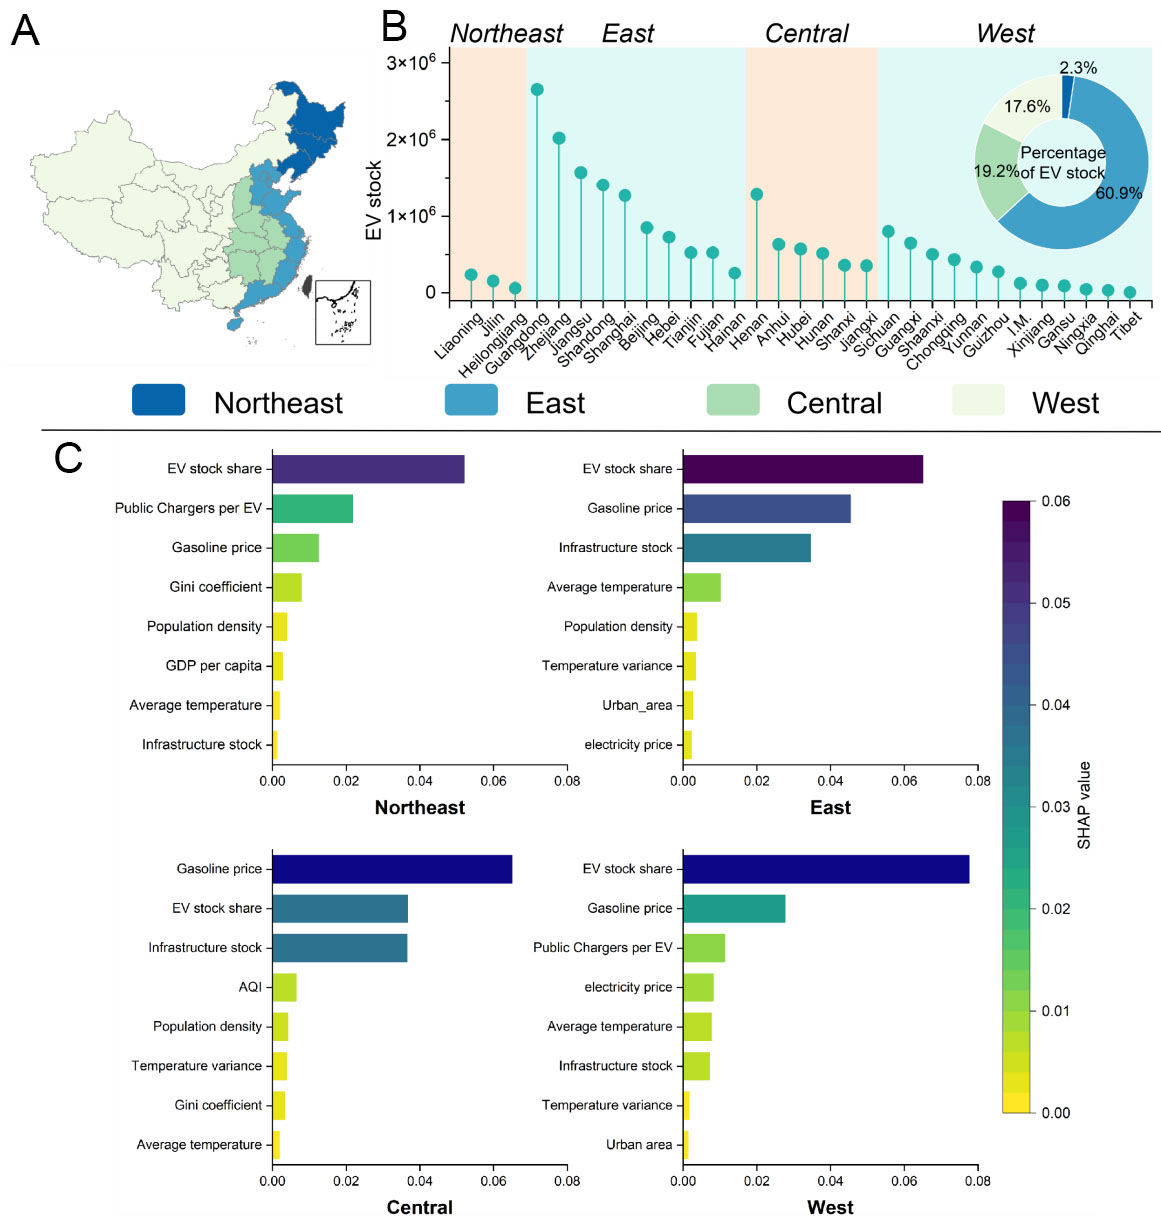
Figure 6. Regional classification and regional variation in key predictors of EV penetration. (A) Geographic distribution of the four regions: Northeast, East, Central, and West; (B) Total EV stock by province and the regional share of national EV stock in 2024; (C) Mean absolute SHAP values of the top eight predictors in each of the four region-specific random forest models. The geographic base maps were derived from the standard map of China approved under map approval number GS(2019)1822 and obtained from the Standard Map Service System of the Ministry of Natural Resources of the People’s Republic of China(http://bzdt.ch.mnr.gov.cn/download.html?searchText=GS(2019)1822). The base map boundaries were not modified. EV: Electric vehicle; AQI: air quality index; SHAP: SHapley Additive exPlanations.





