fig2

Improving utility and value of wastewater-based epidemiology data for community stakeholders

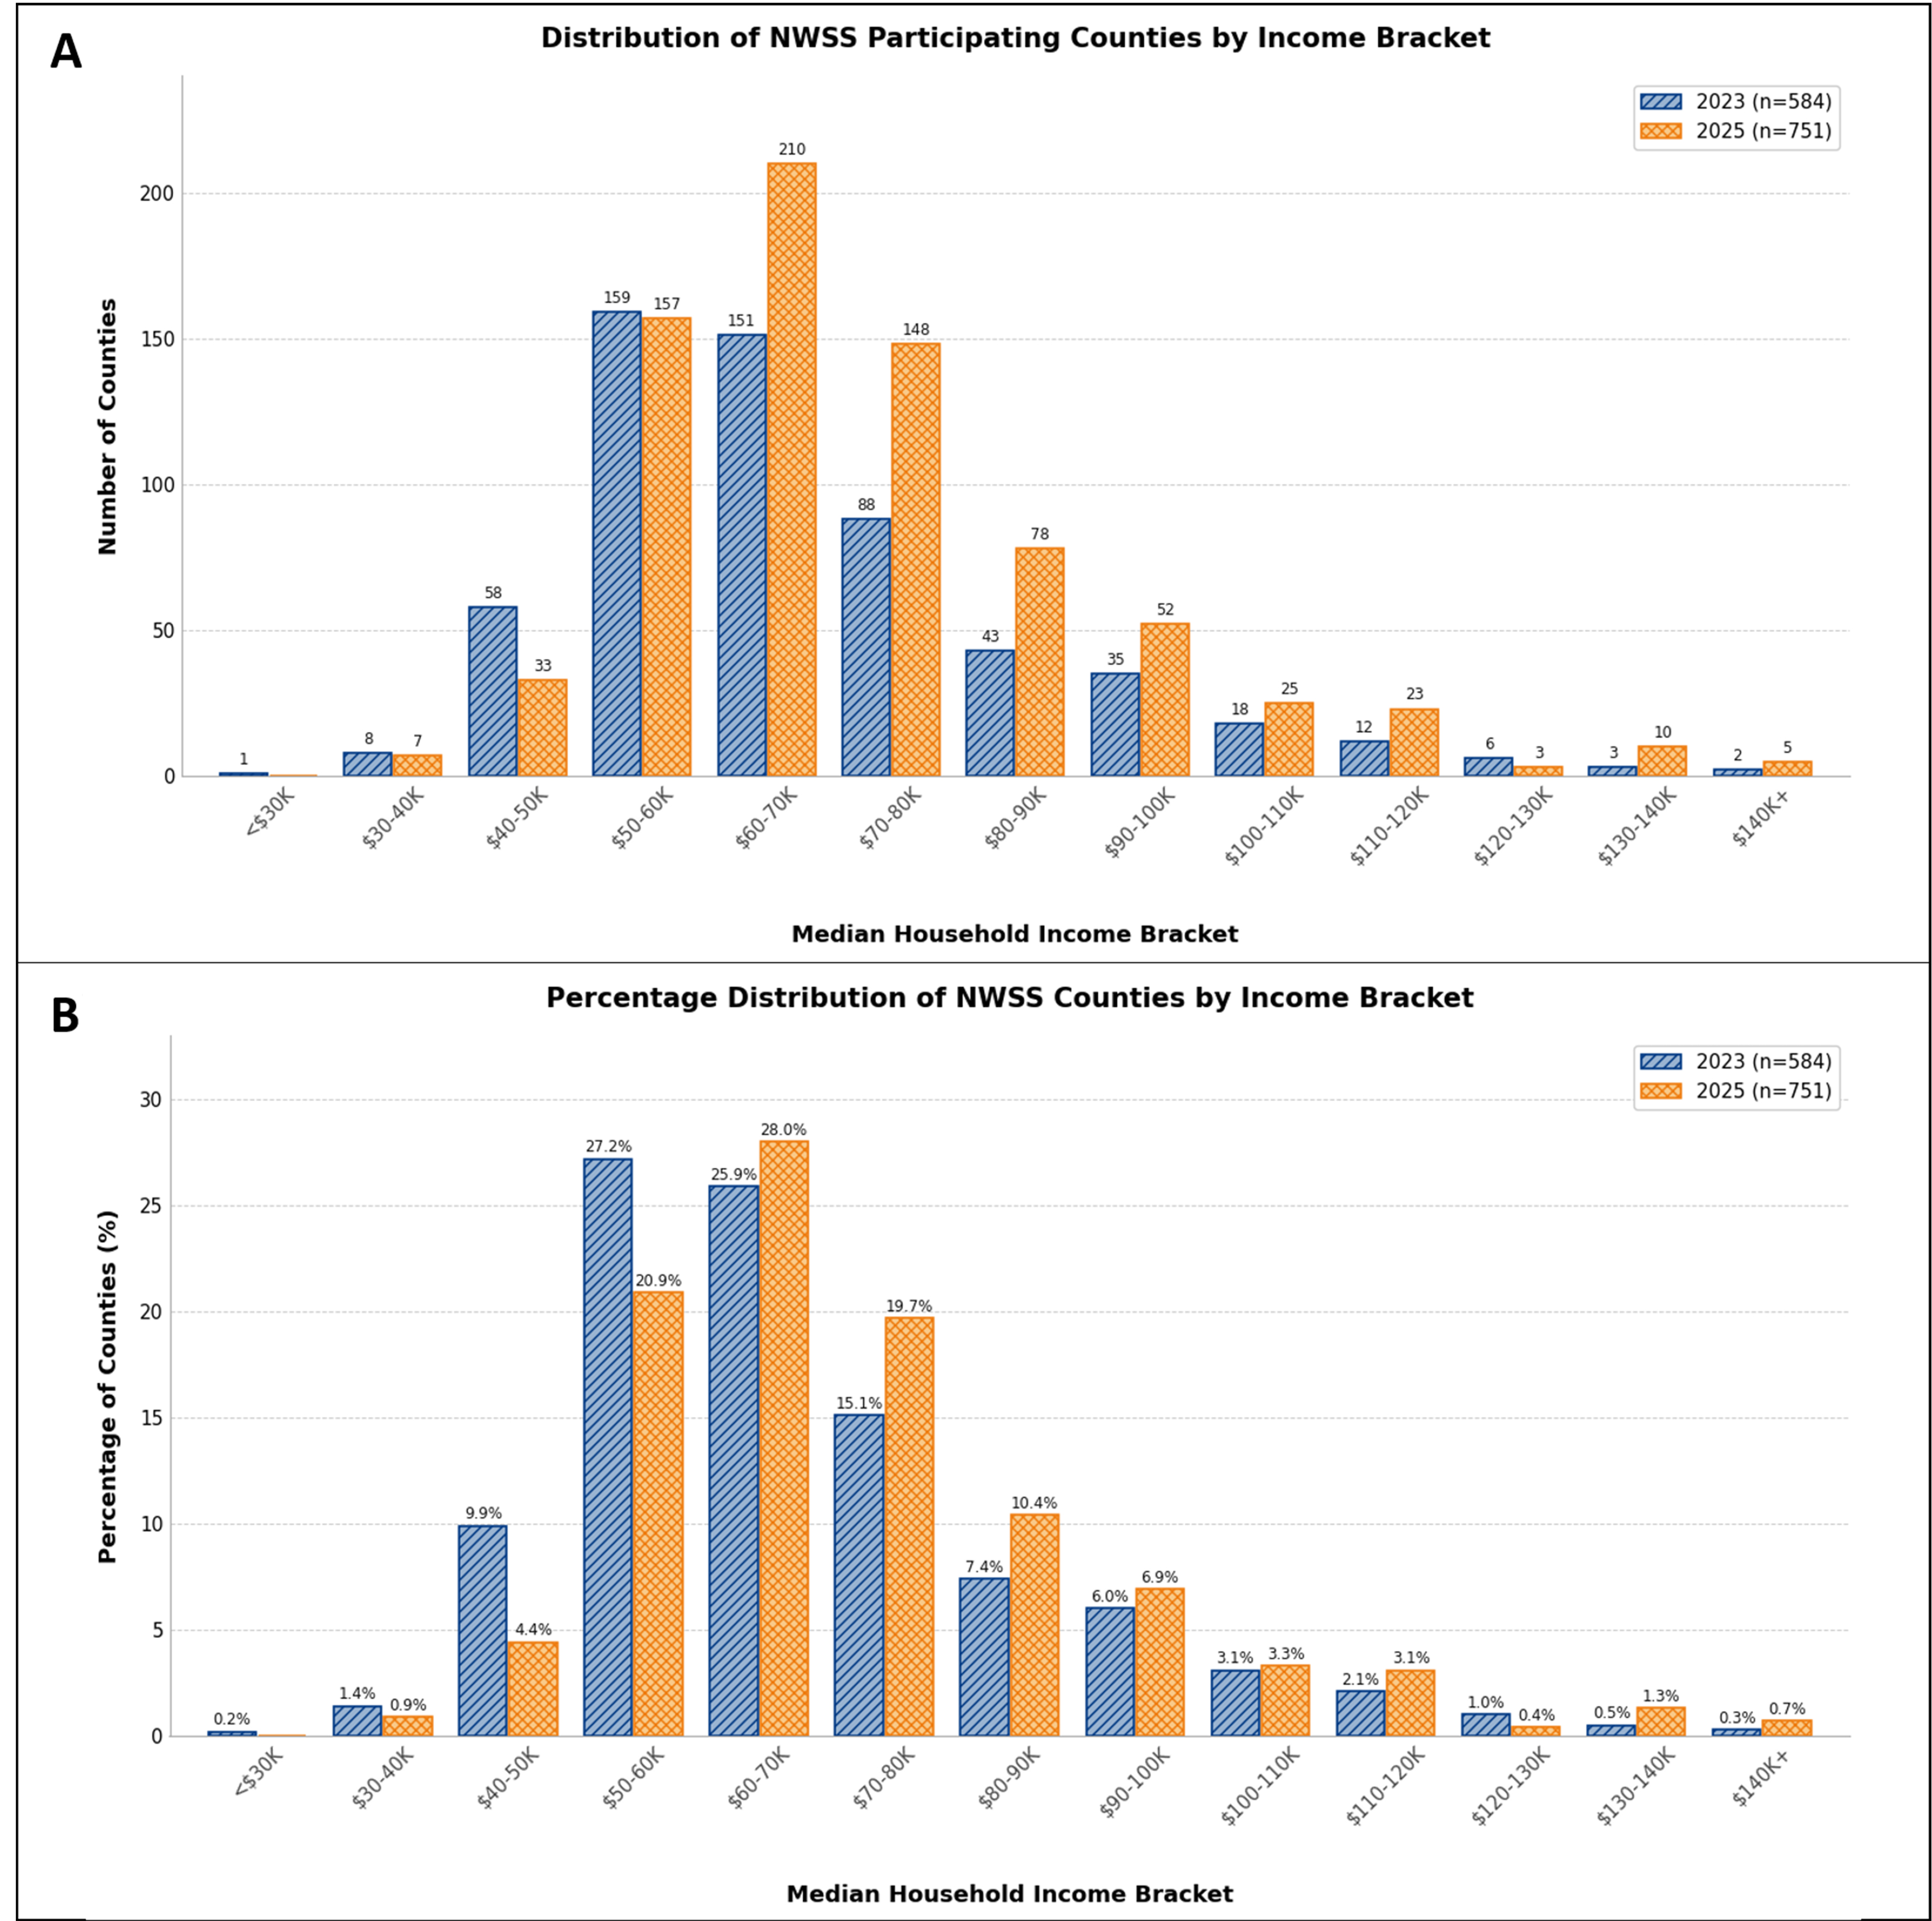
Figure 2. (A) Absolute number of NWSS-participating counties in each median household income bracket in 2023 (n = 584) and 2025 (n = 751), revealing that program expansion disproportionately added higher-income counties, with the largest growth occurring in the $60-80 K bracket while lower-income brackets (< $50 K) saw minimal expansion or decline; (B) Percentage distribution of NWSS-participating counties across median household income brackets in 2023 and 2025, normalizing for the difference in total county counts between years. NWSS: National Wastewater Surveillance System.

Emerging Contaminants and Environmental Health
ISSN 3070-3549 (Online)

Portico

All published articles are preserved here permanently:

https://www.portico.org/publishers/oae/

Portico

All published articles are preserved here permanently:

https://www.portico.org/publishers/oae/