

fig3
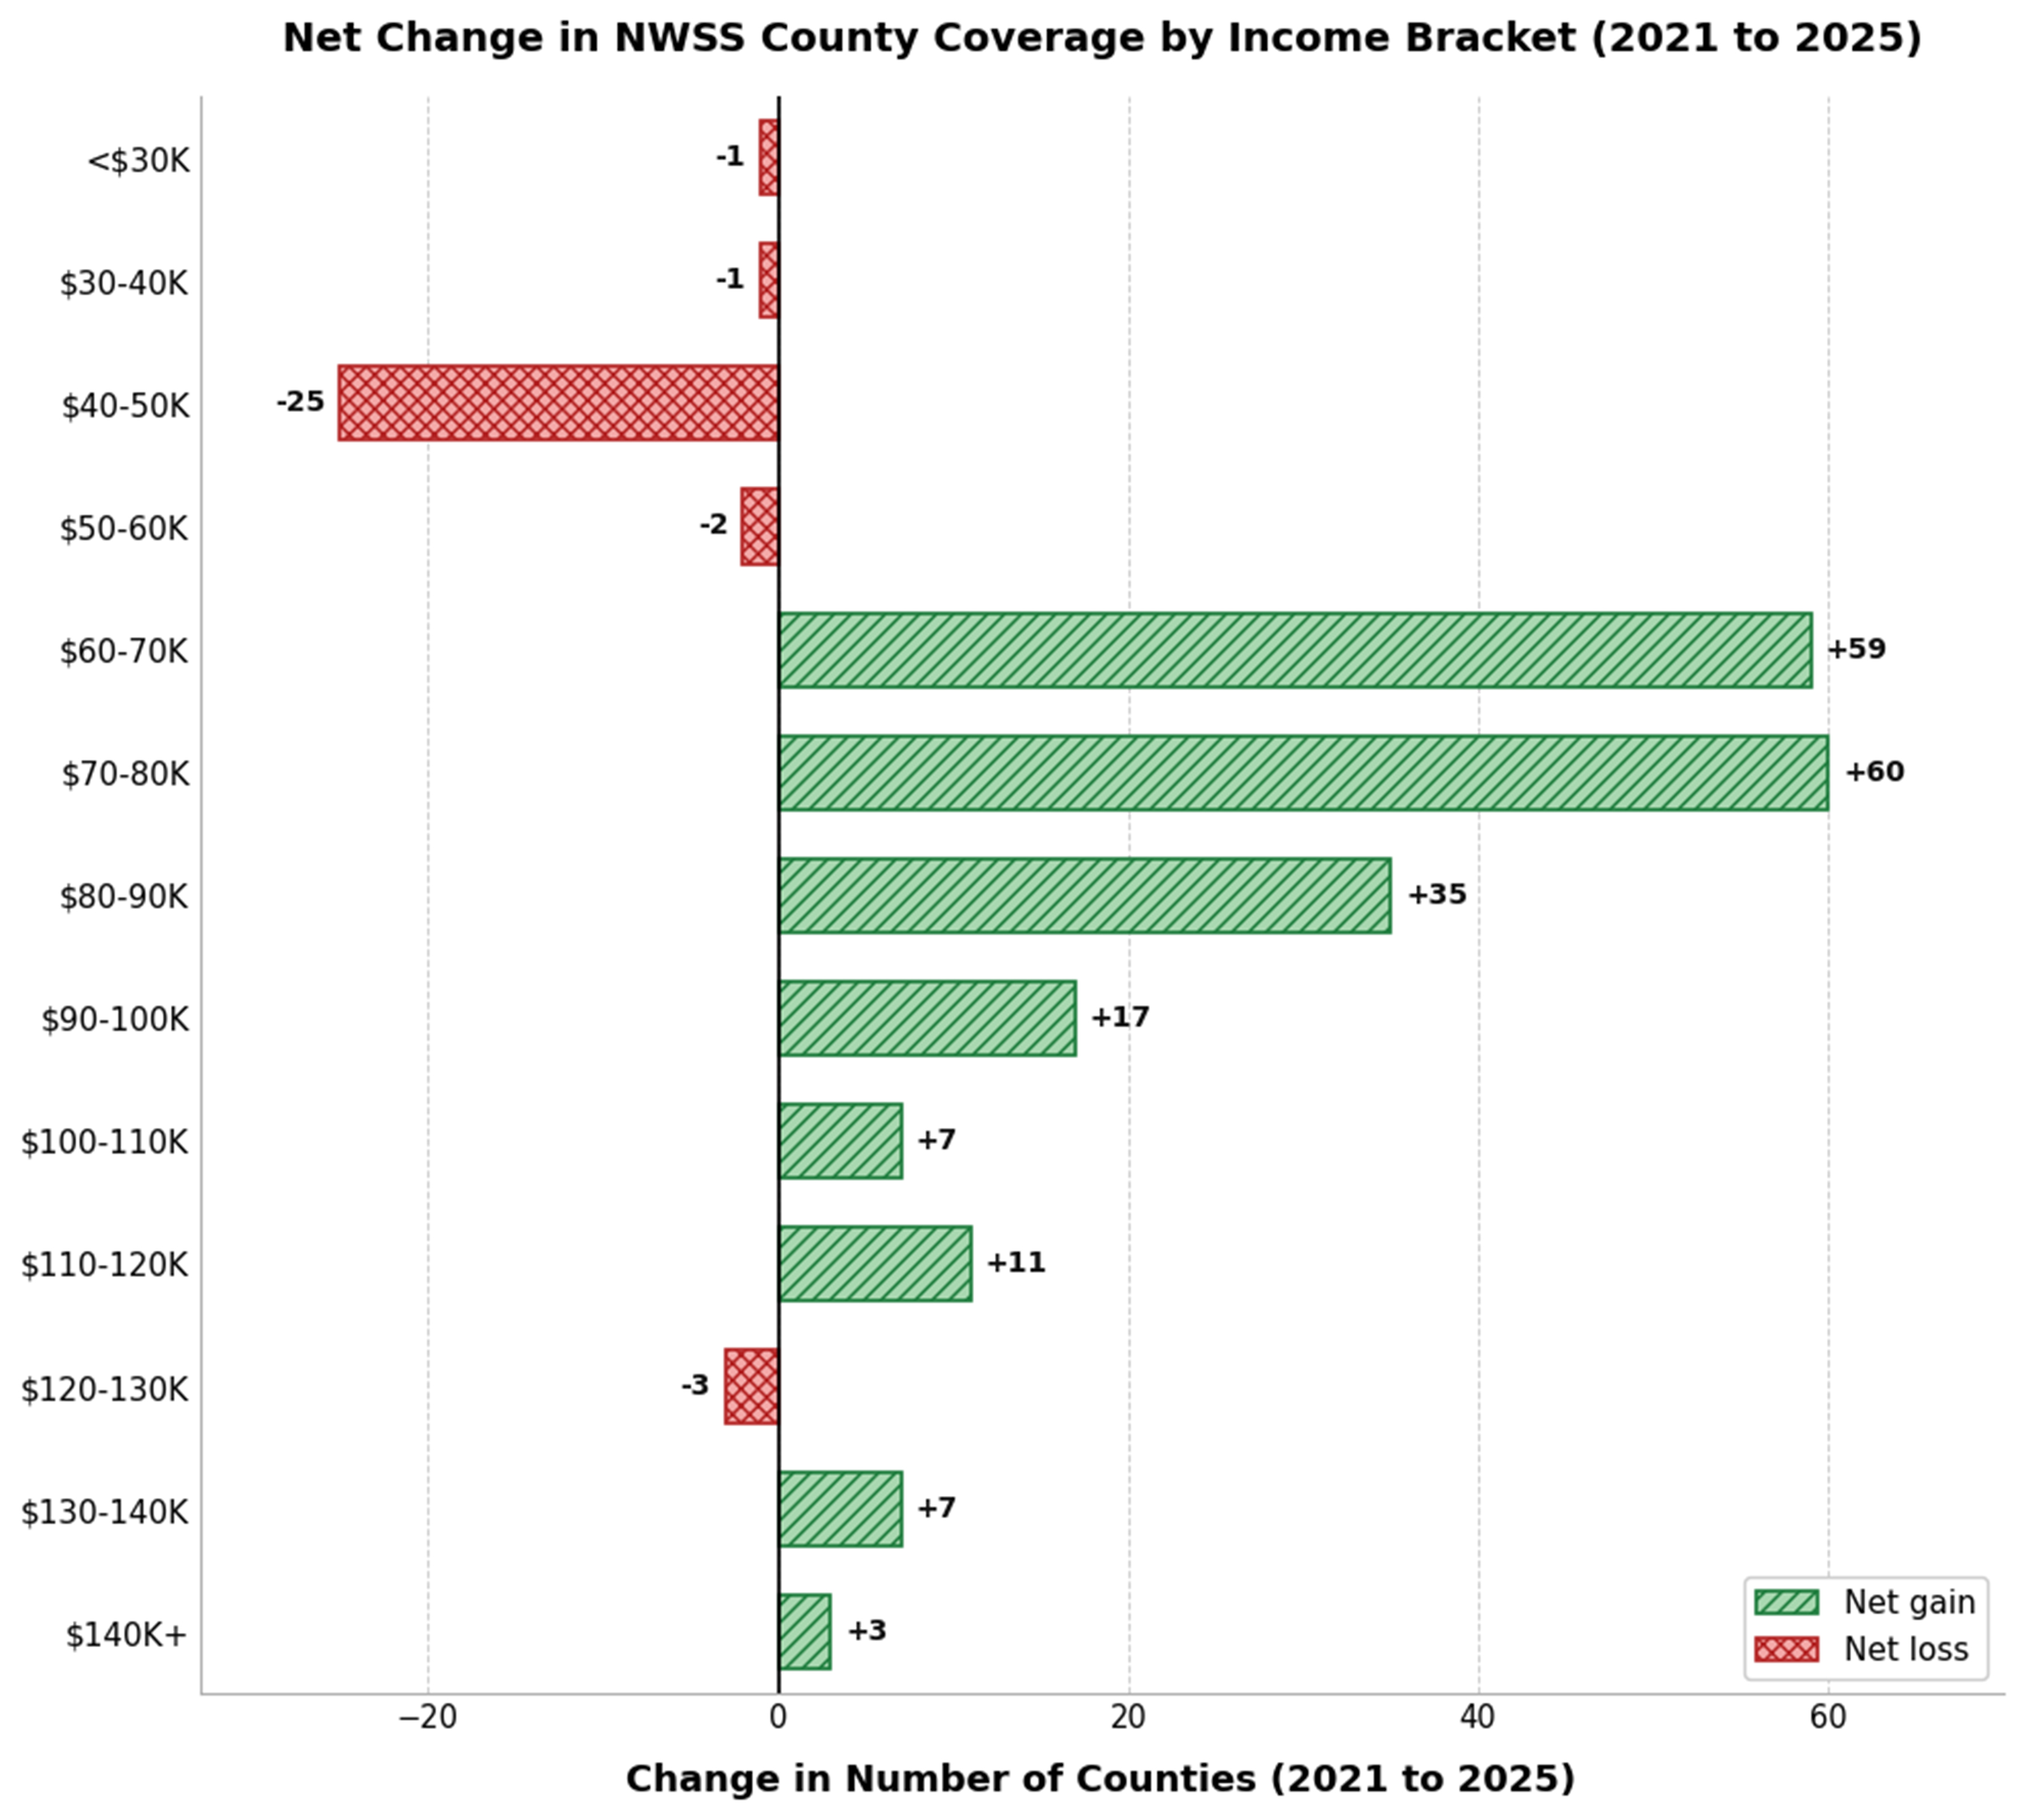
Figure 3. Net change in NWSS county coverage by median household income bracket from 2023 to 2025. Green bars indicate net gains in participating counties while red bars indicate net losses, demonstrating that program expansion heavily favored higher-income communities (≥ $60 K) while lower-income counties (< $60 K) experienced stagnation or decline, with the $40-50 K bracket losing 25 counties. NWSS: National Wastewater Surveillance System.


