

fig4
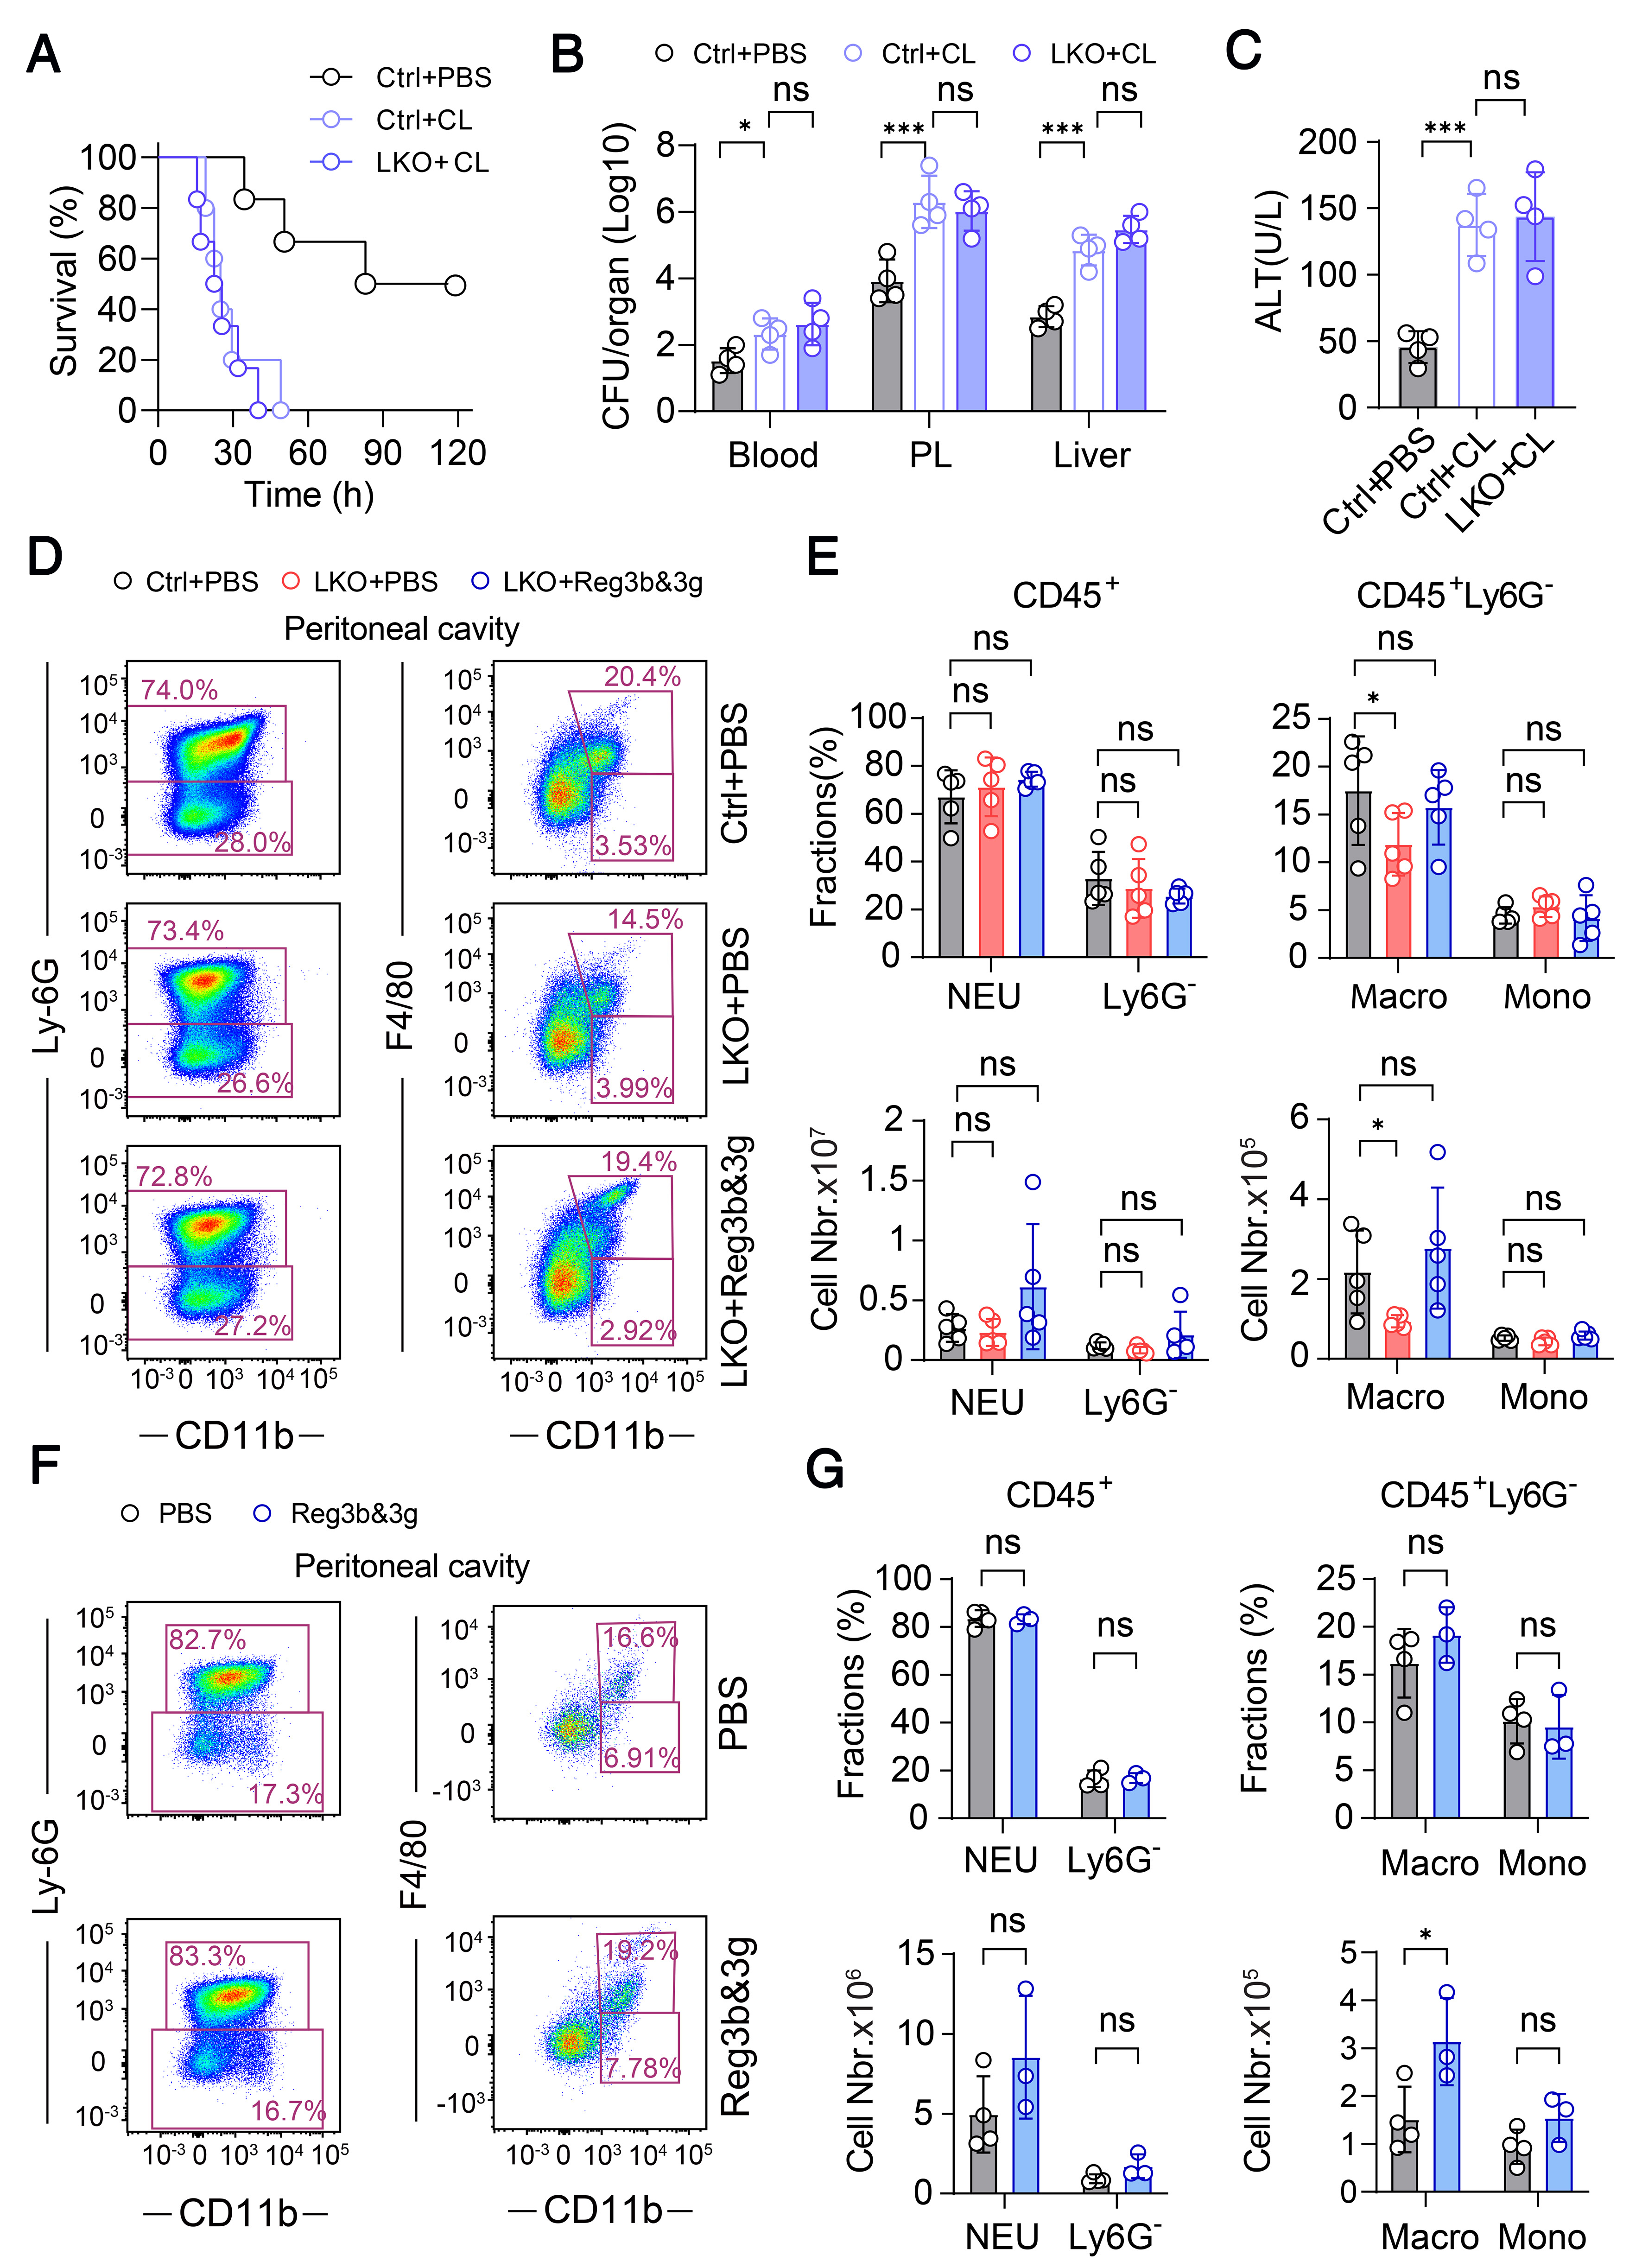
Figure 4. Reg3b and Reg3g exert anti-bacterial activity through recruiting macrophages.
(A) The Kaplan-Meier survival curve of control mice (n = 6) , LKO mice treated with PBS (LKO + PBS) (n = 5) and LKO mice treated with clodronate liposomes (LKO + CL) (n = 6) upon E. coli infection; (B) Bacterial CFU counts were measured in the peritoneal fluid, blood and liver of control (n = 4), LKO + PBS (n = 4) and LKO + CL mice (n = 4) 12 h post E. coli infection; (C) The level of ALT and AST in the serum of control (n = 4), LKO + PBS (n = 4) and LKO + CL mice (n = 4) 12 h post infection; (D) Representative flow cytometry dot plot of neutrophils, macrophages and monocytes in the peritoneal fluid of control, LKO + PBS and LKO + rReg3b and rReg3g mice; (E) The corresponding proportion and cell number of neutrophils, macrophages and monocytes in the peritoneal fluid of control (n = 5), LKO + PBS (n = 5) and LKO + rReg3b and rReg3g mice (n = 5); (F) Representative flow cytometry dot plot of neutrophils, macrophages and monocytes in the peritoneal fluid of WT + PBS (n = 4) and WT + rReg3b and rReg3g mice (n = 3); (G) The corresponding proportion and cell number of neutrophils, macrophages and monocytes in the peritoneal fluid of WT + PBS (n = 4) and WT + rReg3b and rReg3g mice (n = 3). Circles correspond to individual mouse. Results are represented as mean ± SD. P values in (A) were determined using log-rank (Mantel-Cox) test. The P values in (C) were determined using one-way ANOVA. The P values in (B, E and G) were determined using two-way ANOVA. *P < 0.05; ***P < 0.001. NS: Not significant; E. coli: Escherichia coli; ALT: alanine transaminase; AST: aspartate transaminase; CFU: colony forming unit; WT: wild type; LKO: liver-specific Smad4 knockout; PBS: phosphate buffered saline.

