


fig3
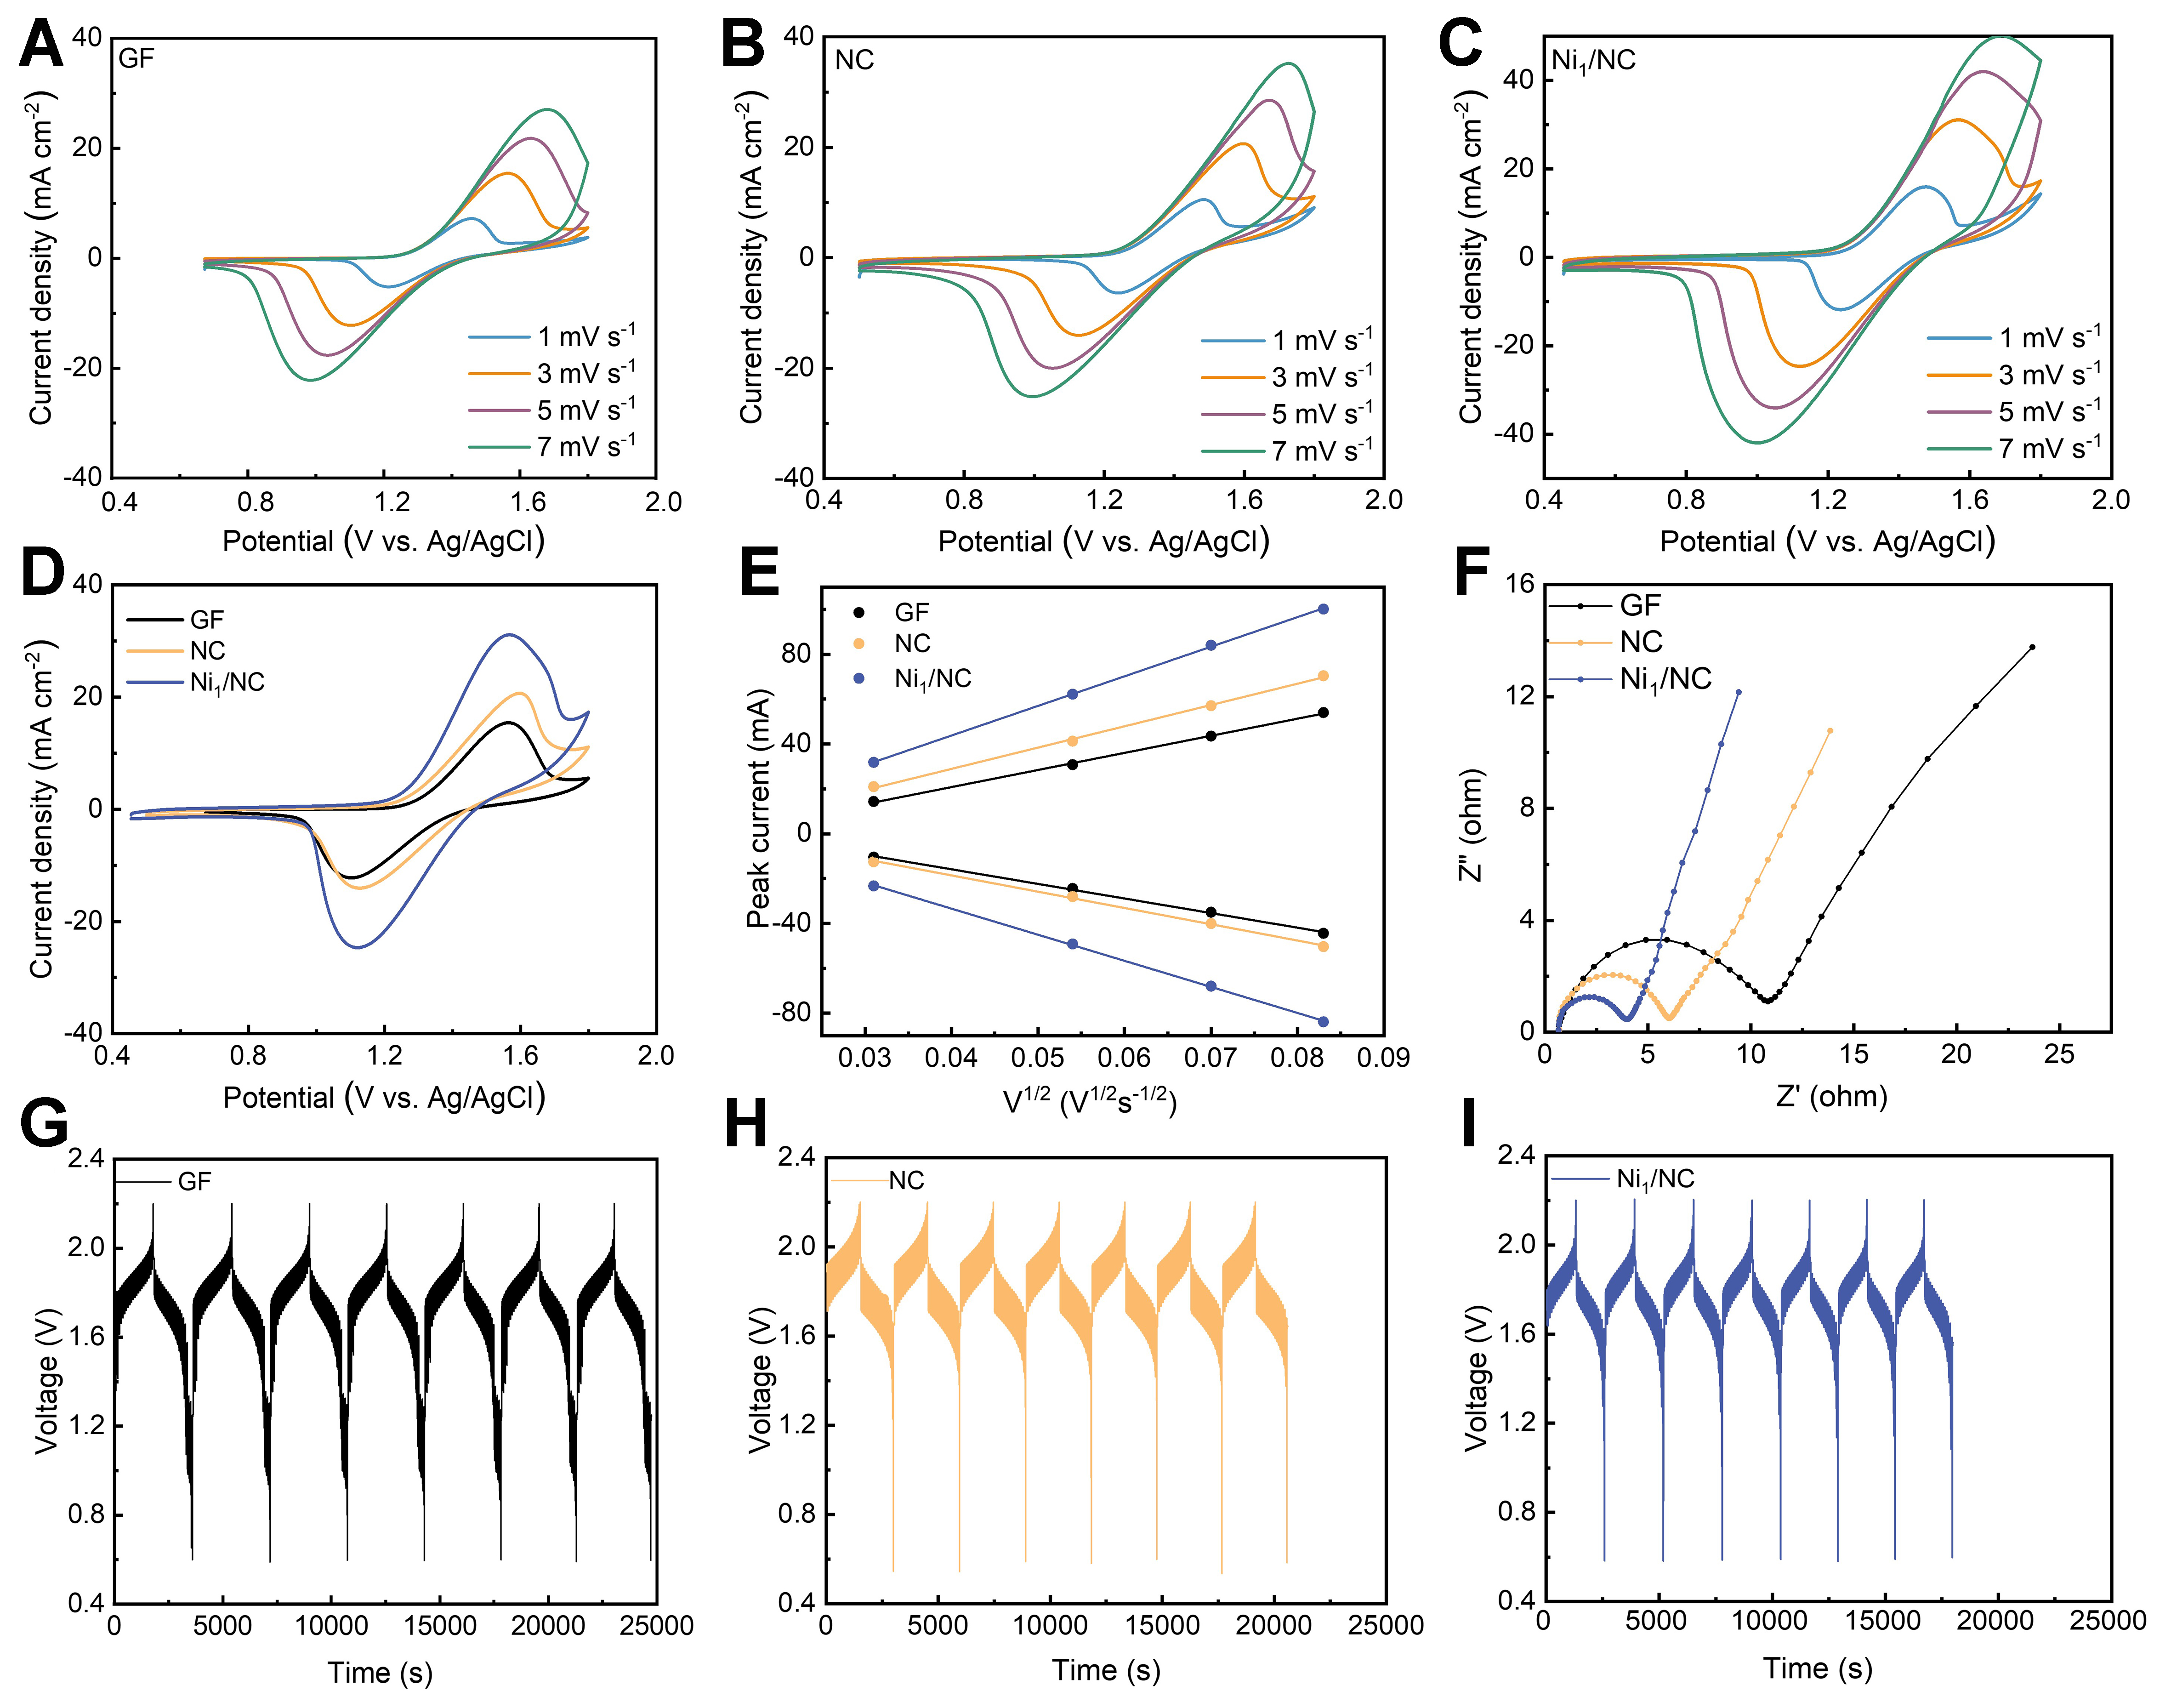
Figure 3. CV curves of (A) GF, (B) NC, and (C) Ni1/NC; (D) CV curves of Ni1/NC, NC, and GF at a scan rate of 3 mV s-1; (E) Peak current density vs. the square root of scan rate derived from the CV curves in (D); (F) Nyquist plots of Ni1/NC, NC, and GF (measured at open circuit potential); (G-I) Voltage profiles vs. time for the GF, NC, and Ni1/NC electrodes at 80 mA cm-2. CV: Cyclic voltammetry; GF: graphite felt; NC: nitrogen-doped carbon.


