

fig3
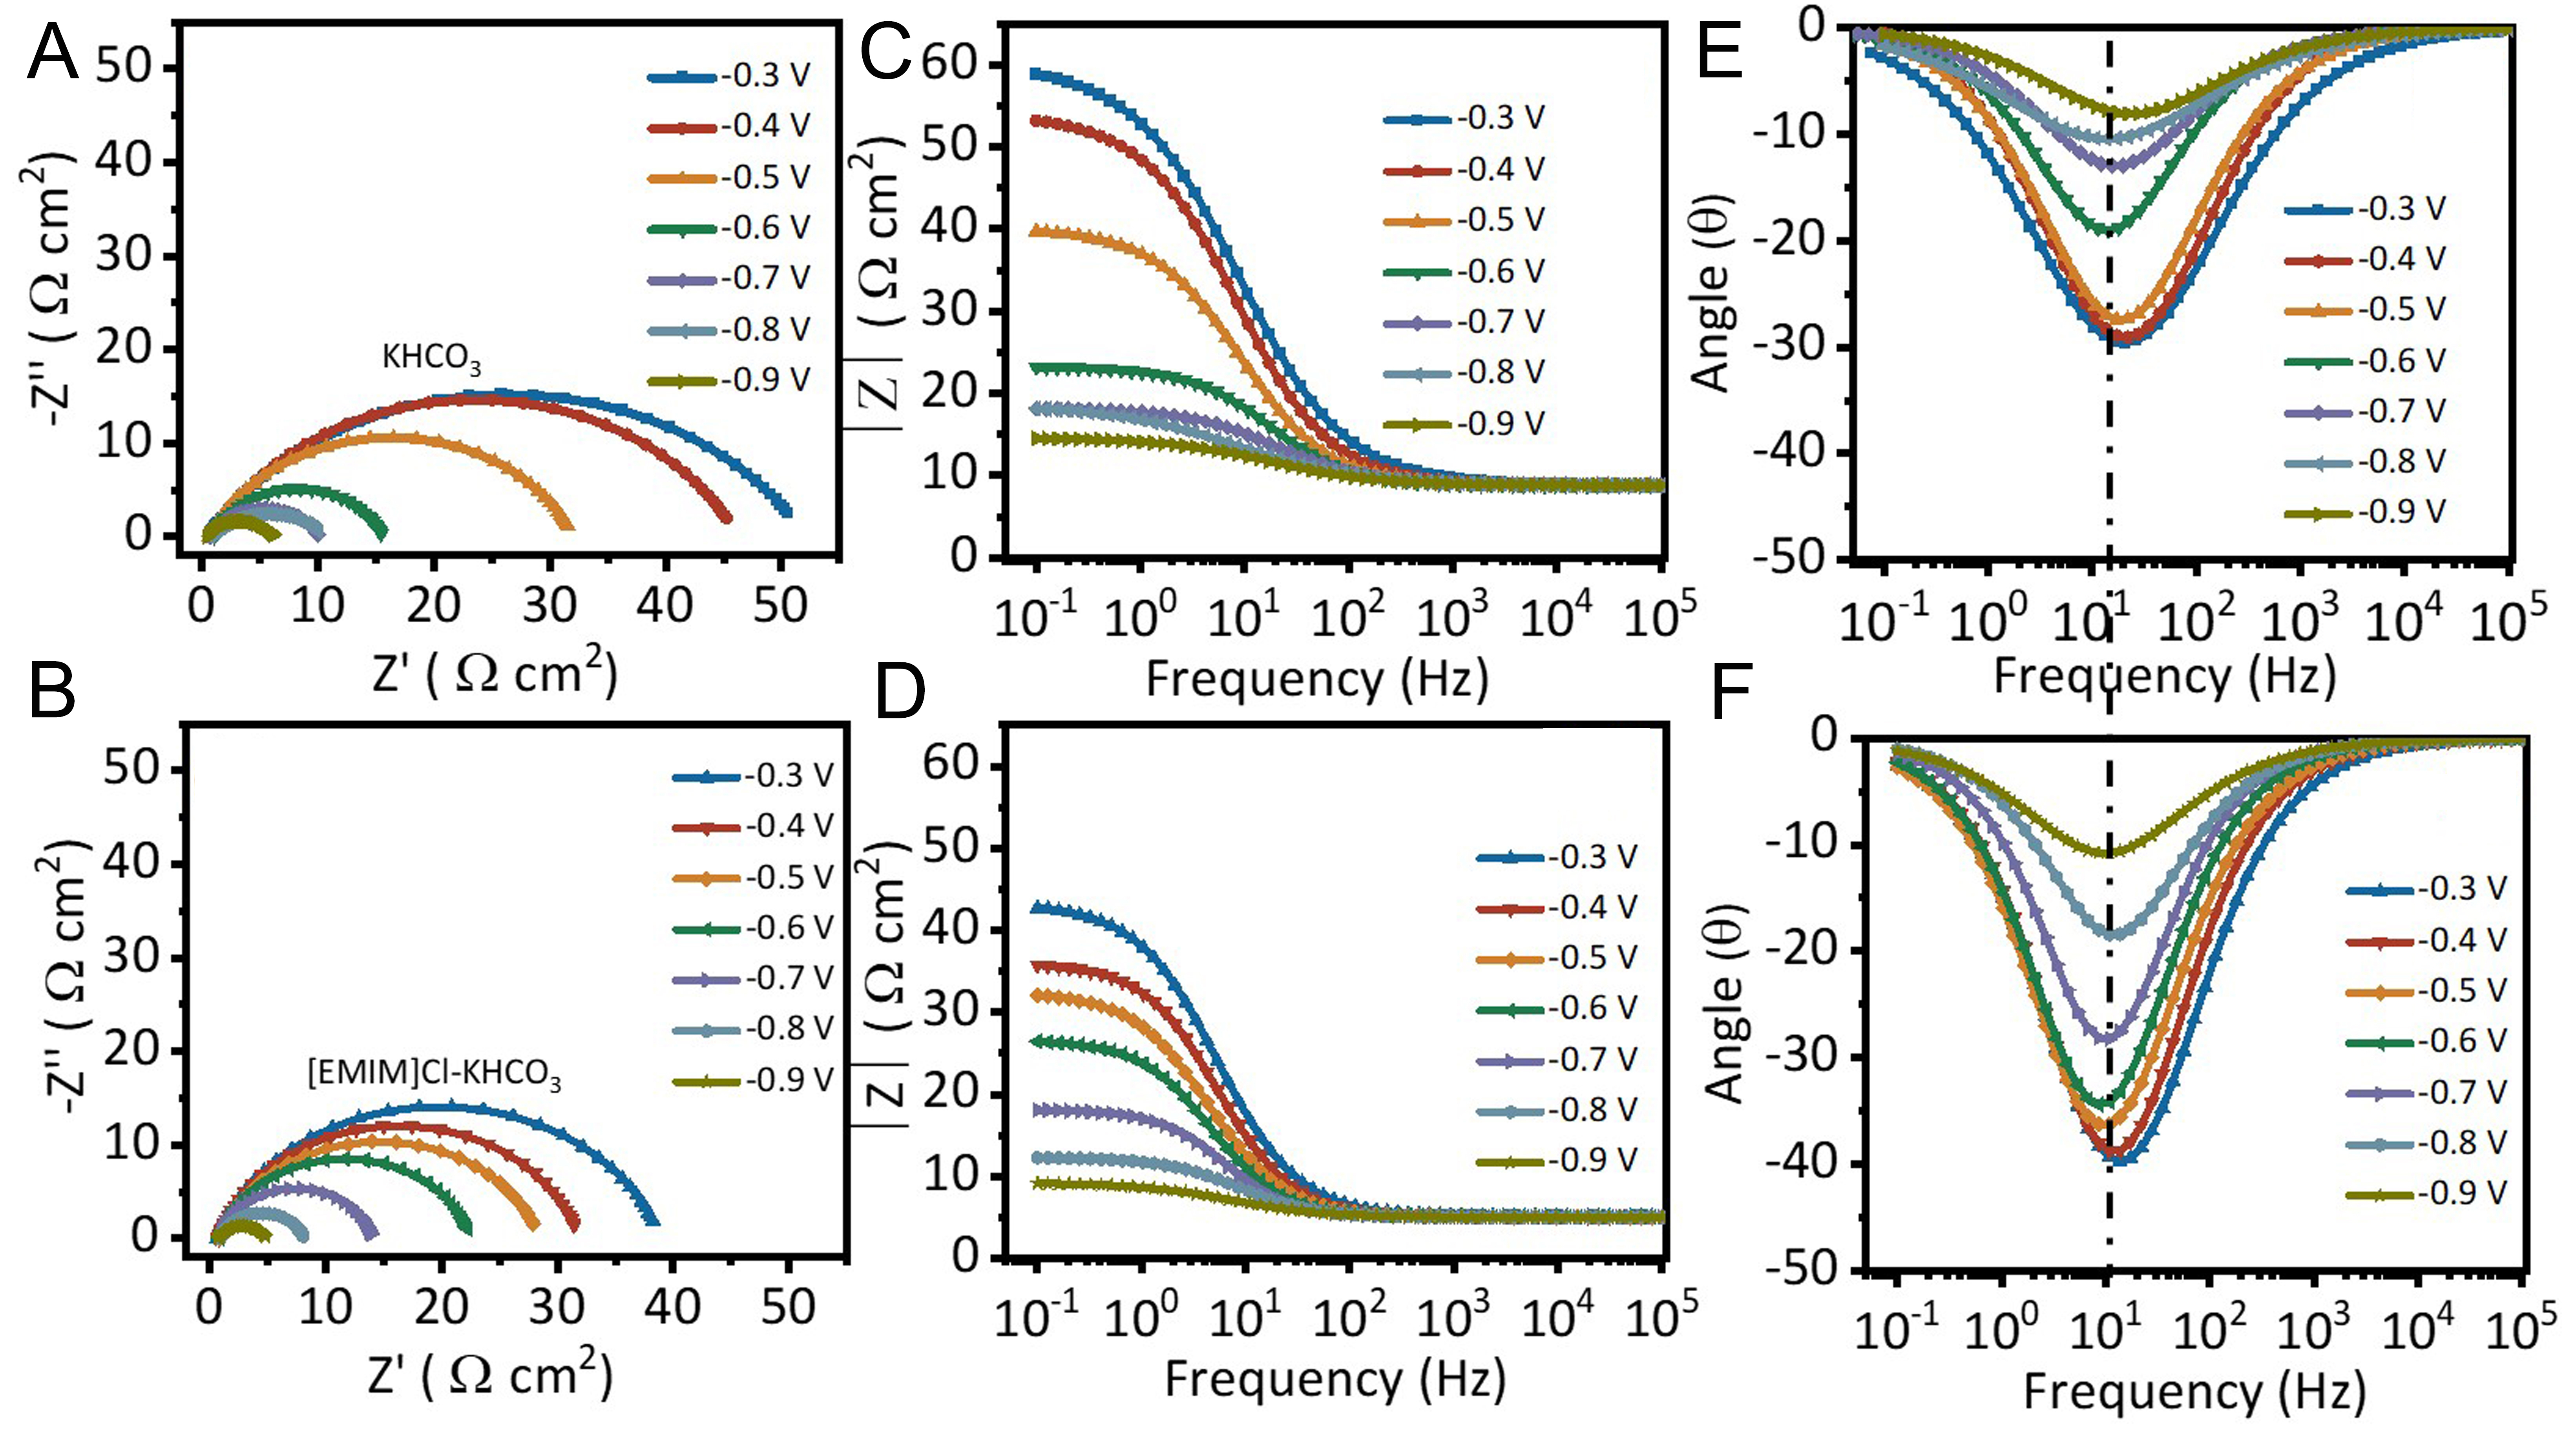
Figure 3. Electrochemical impedance spectroscopy of the catalyst with a Co/Zn molar ratio of 2:1 in (A, C, E) 0.1 M KHCO3 and (B, D, F) 0.06 M KHCO3 + 0.1 M [EMIM]Cl electrolyte. (A and B) Nyquist plot, (C and D) Bode magnitude plot, and (E and F) Bode phase angle plot.