

fig4
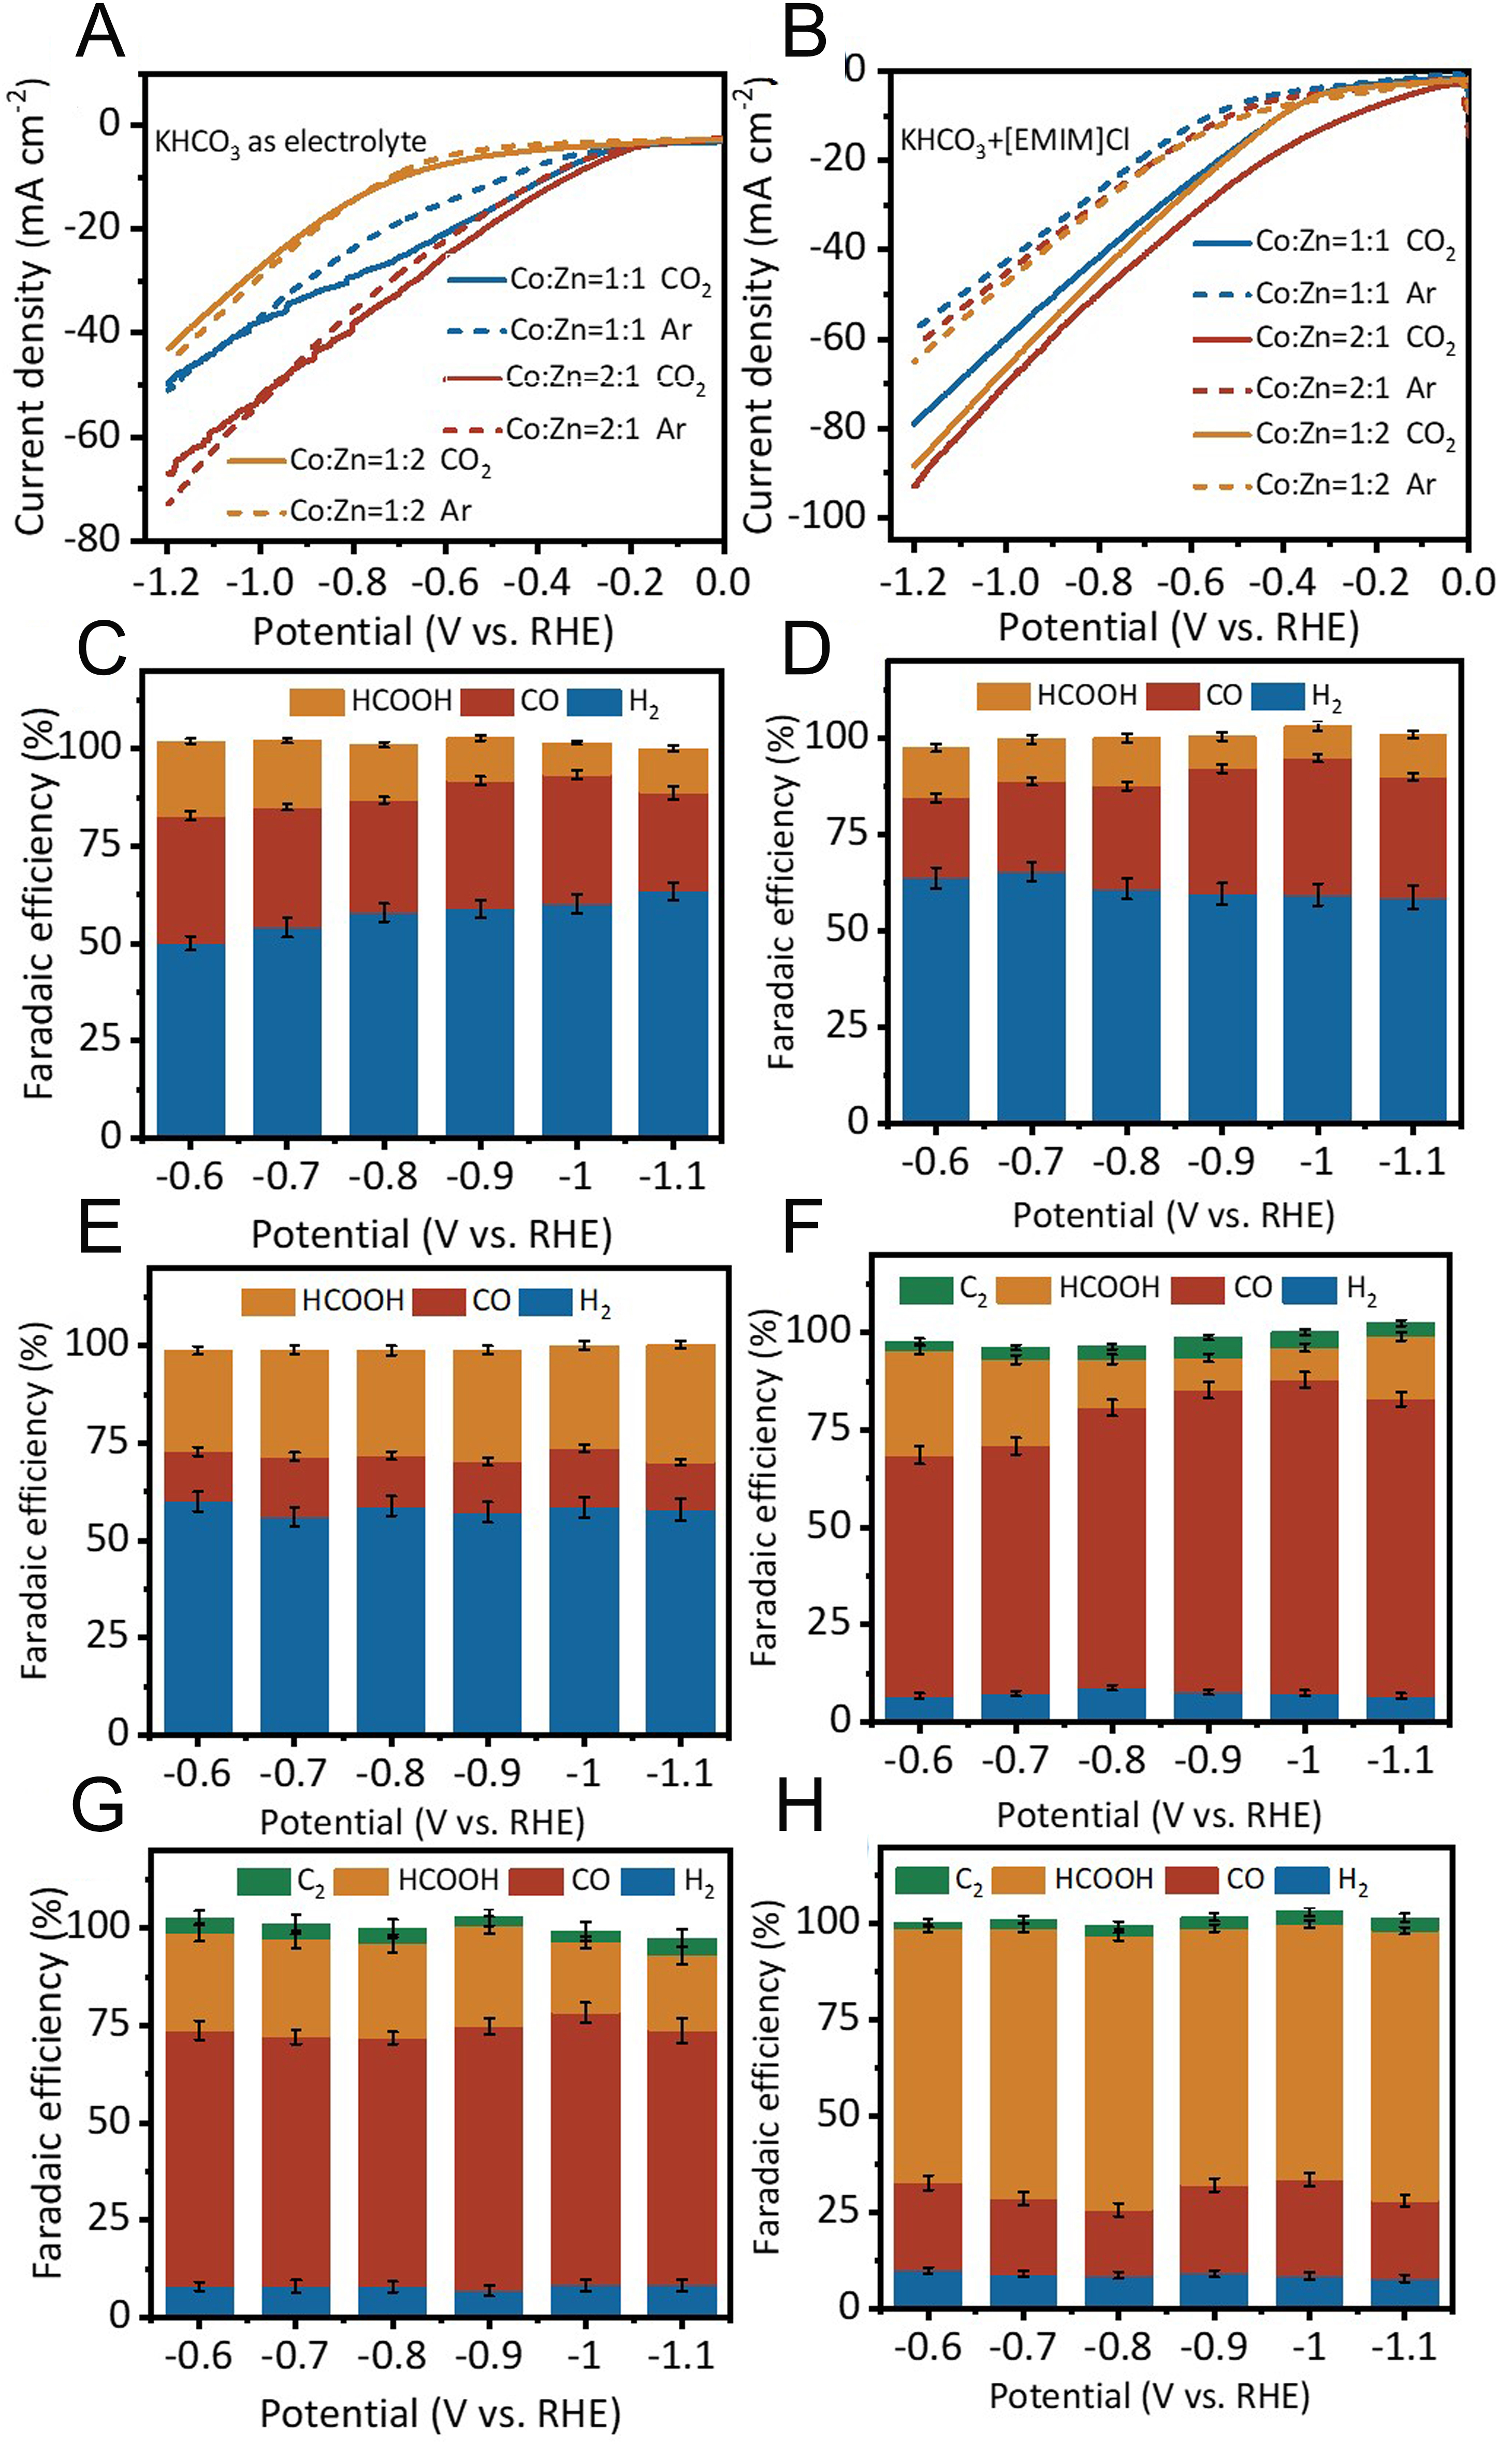
Figure 4. (A) CO2RR polarization curves of catalysts with different Co/Zn molar ratios in 0.1 M KHCO3 electrolyte. (B) CO2RR polarization curves of catalysts with different Co/Zn molar ratios in the composite electrolyte of 0.06 M KHCO3 + 0.1 M [EMIM]Cl. (C-E) Faradaic efficiencies for major products at various applied potentials in 0.1 M KHCO3 electrolyte: (C) Co:Zn = 2:1, (D) Co:Zn = 1:1, (E) Co:Zn = 1:2. (F-H) Faradaic efficiencies for major products at various applied potentials in the composite electrolyte: (F) Co:Zn = 2:1, (G) Co:Zn = 1:1, (H) Co:Zn = 1:2. All potentials are reported vs. the reversible hydrogen electrode (RHE). All error bars represent the standard deviation (SD) from n = 3 independent measurements performed using separately prepared catalyst samples and fresh electrolytes.