

fig5
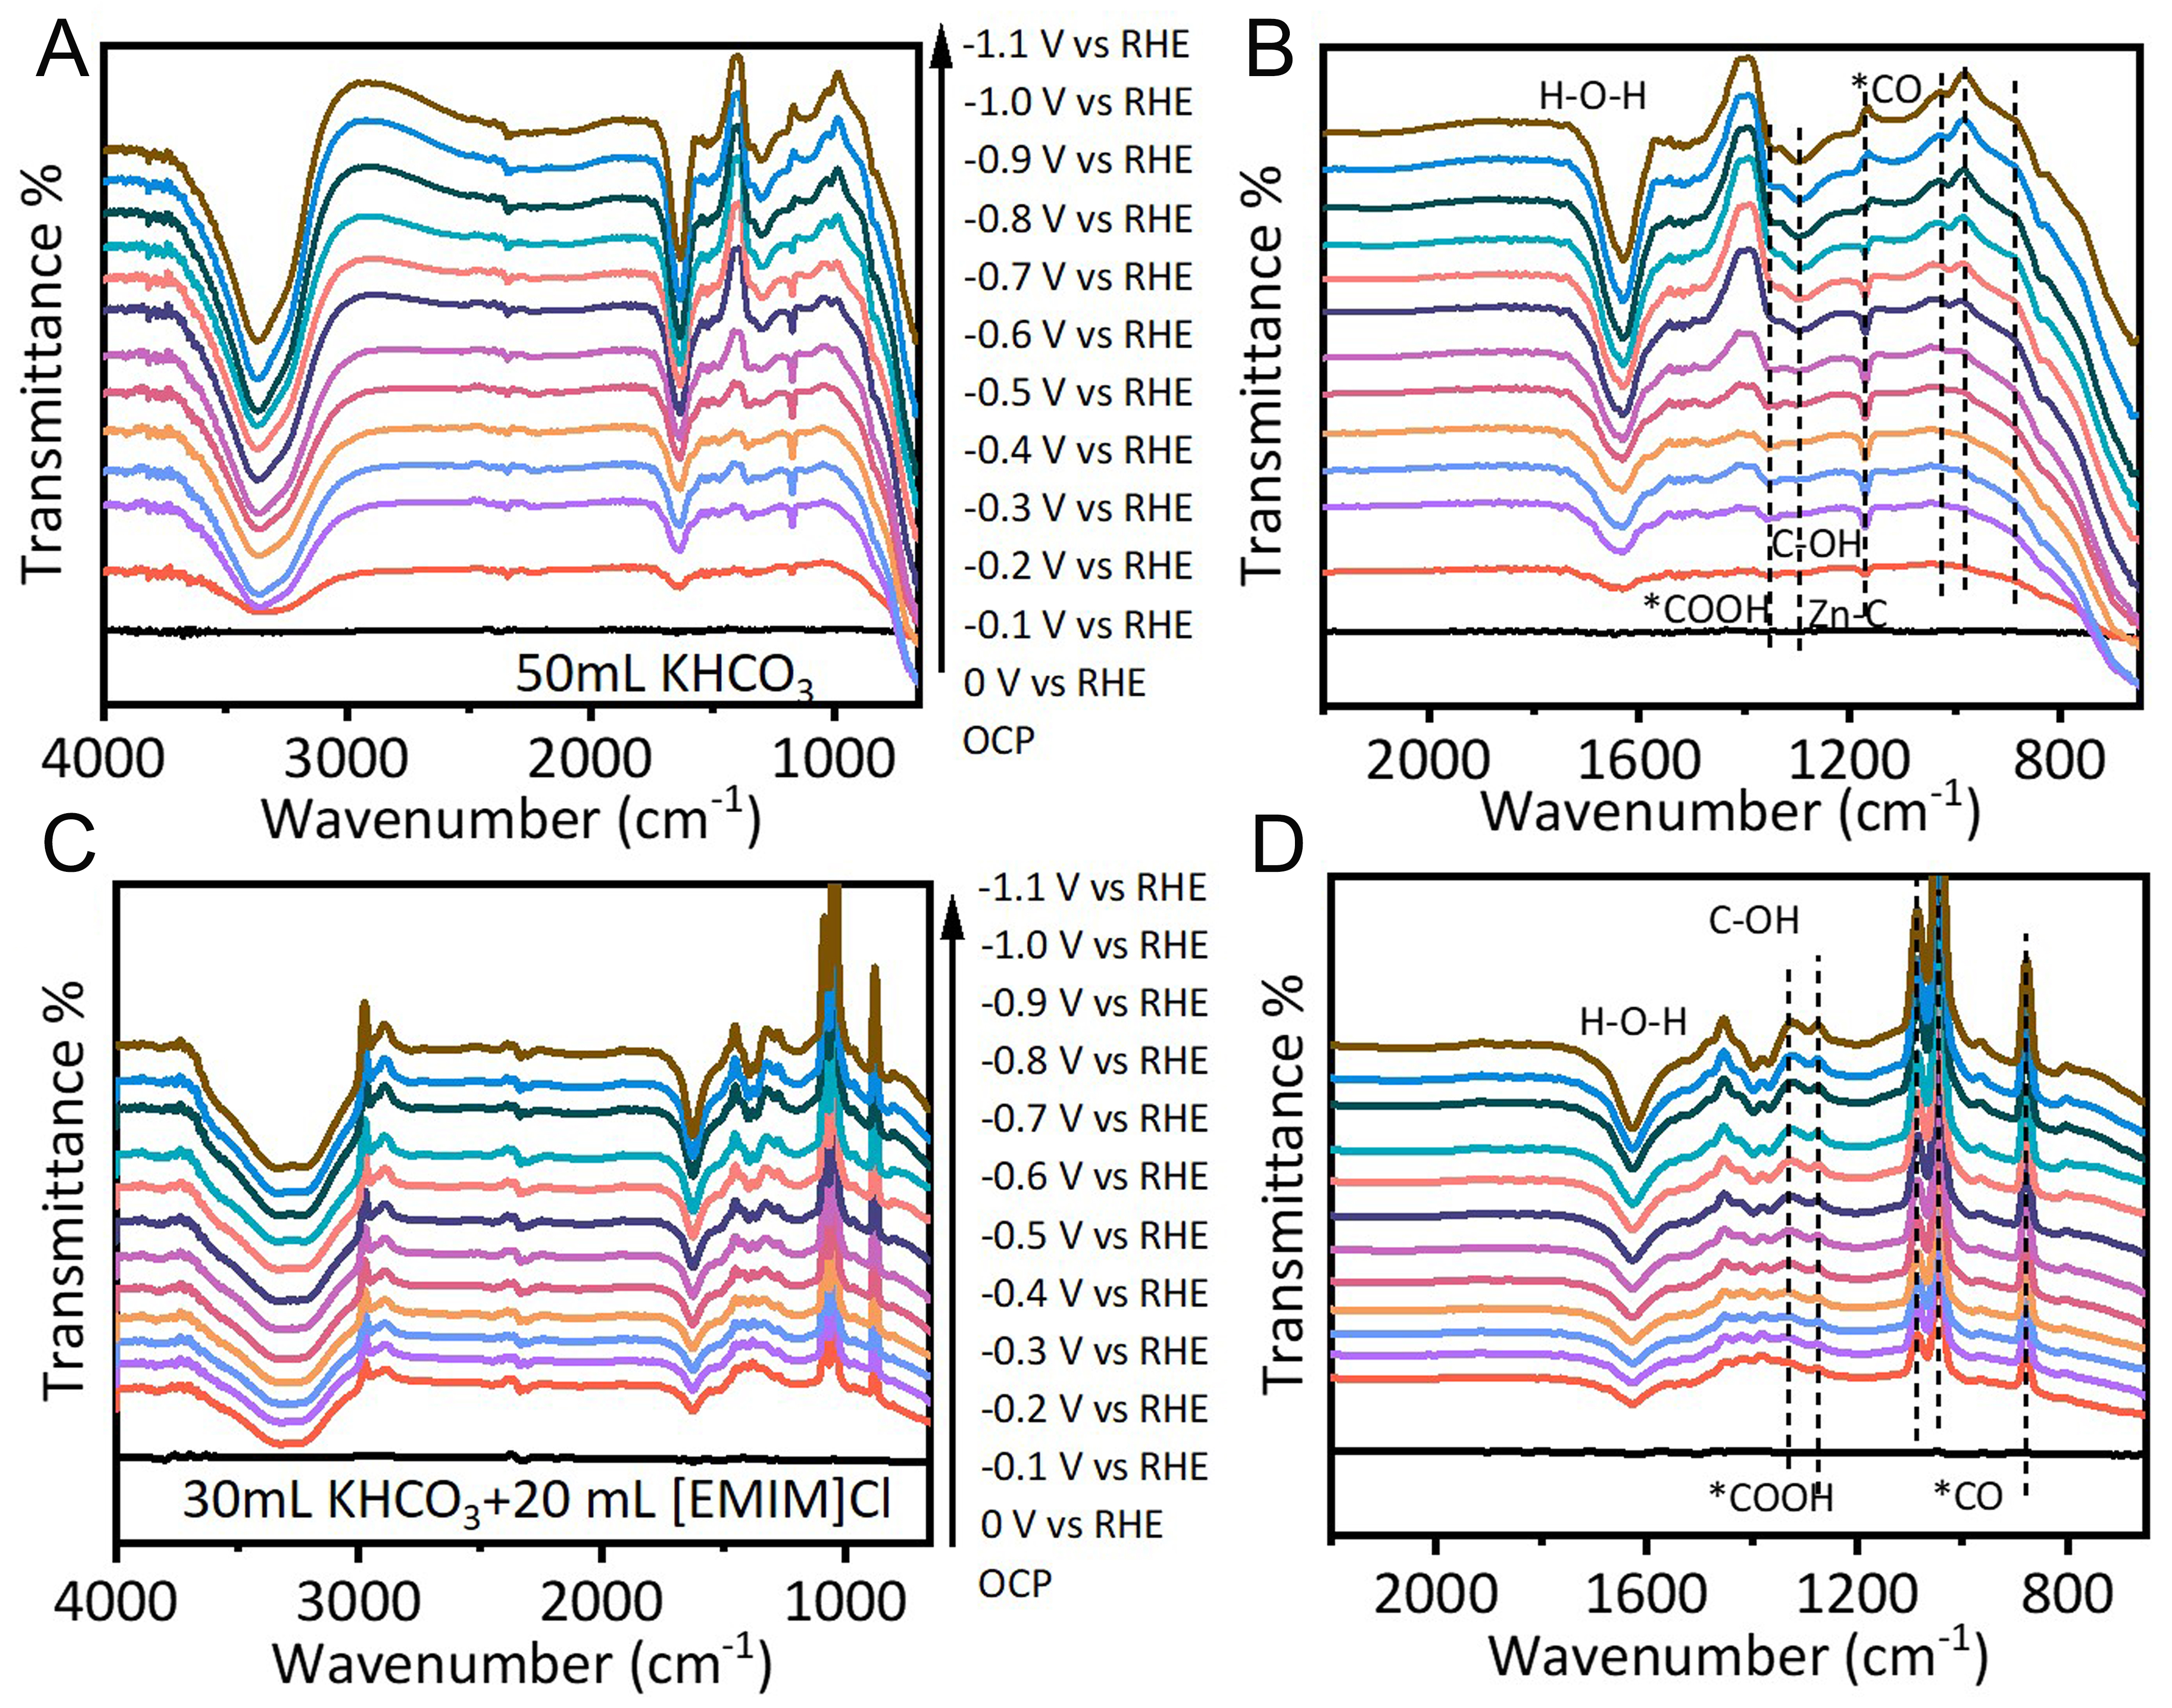
Figure 5. In situ infrared spectra acquired at different applied potentials for the catalyst with Co:Zn = 2:1 in (A and B) KHCO3 and (C and D) KHCO3/[EMIM]Cl electrolyte, showing (A and C) the full-range spectra and (B and D) the spectral features in specific wavenumber regions. All four subfigures share the same color scheme, where each color corresponds to a specific applied potential (from 0 to -1.1 V vs. RHE, as indicated in the legend of (A), which applies to all panels.