

fig2
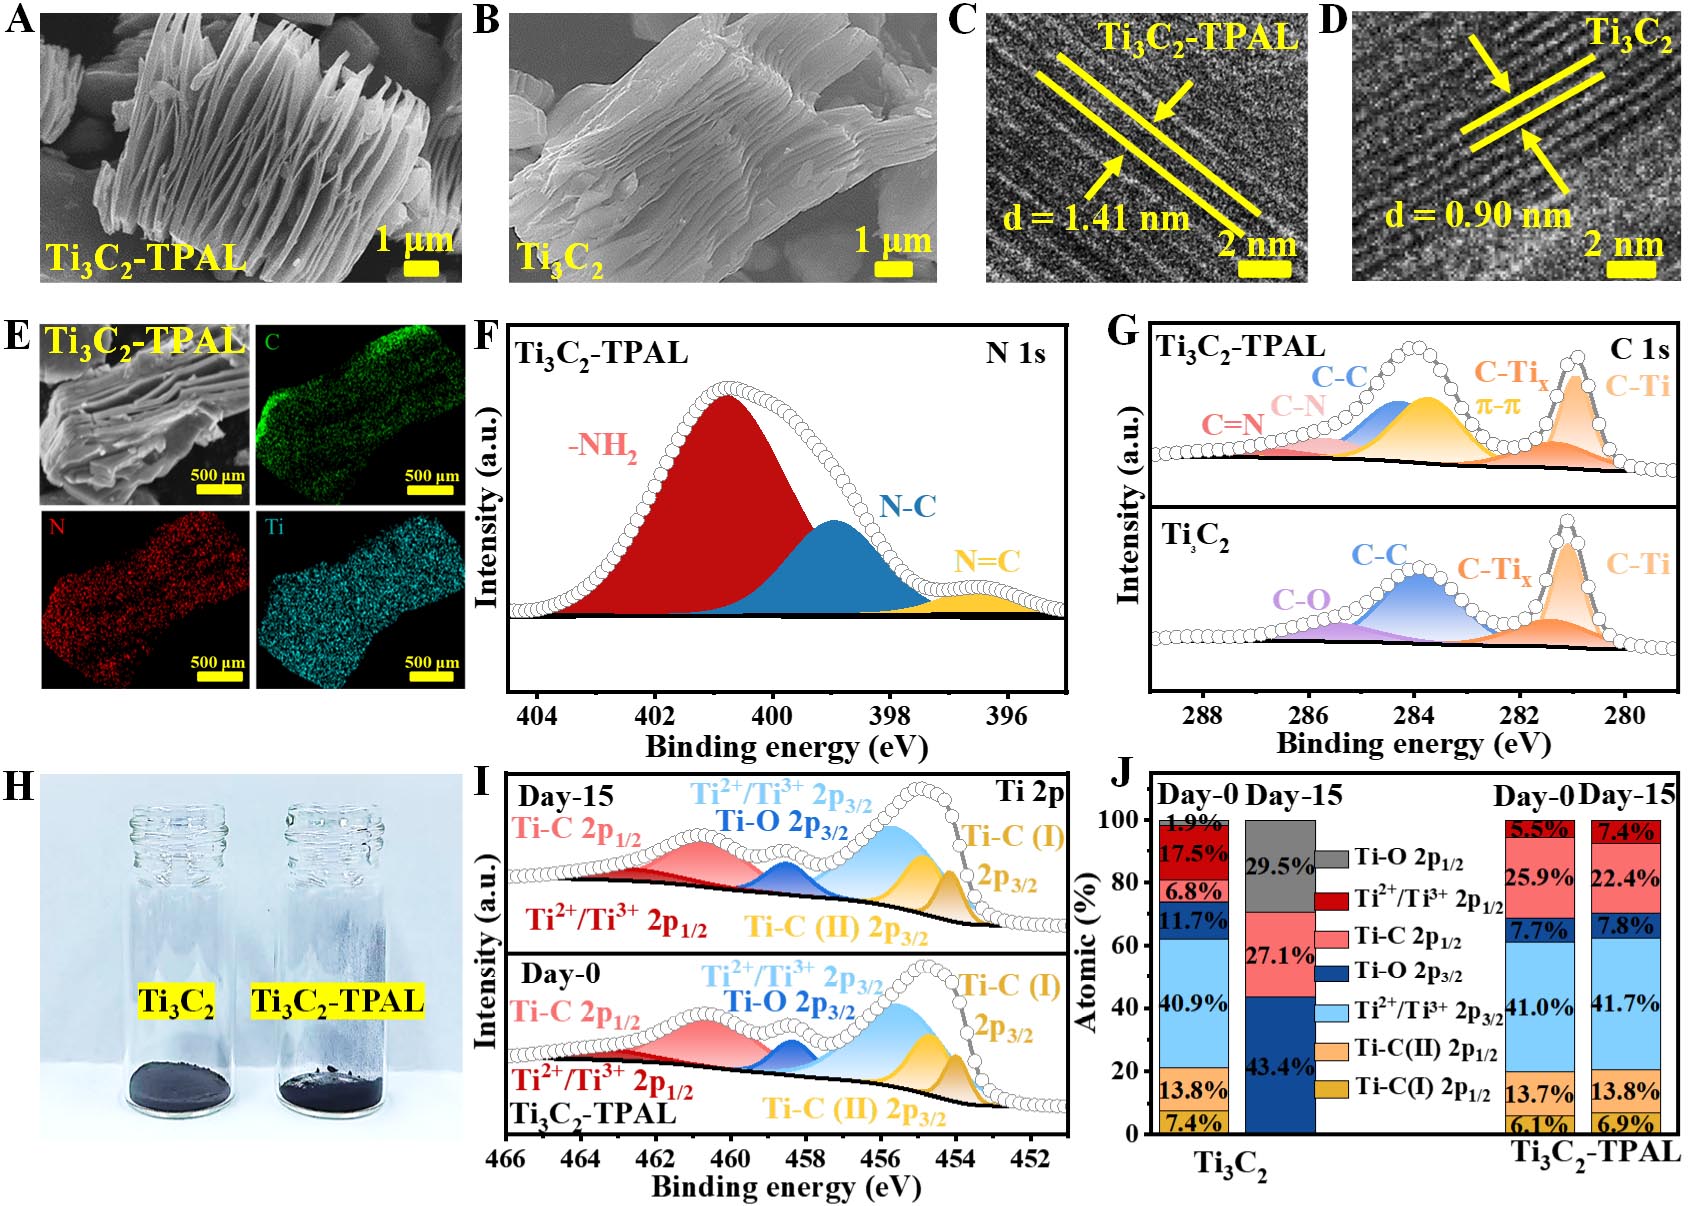
Figure 2. SEM images of (A) Ti3C2-TPAL and (B) Ti3C2. HRTEM images of (C) Ti3C2-TPAL and (D) Ti3C2. (E) SEM image and elemental mappings of Ti3C2-TPAL. High-resolution XPS spectra of Ti3C2-TPAL in the (F) N 1s and (G) C 1s regions. (H) Digital photographs of Ti3C2 and Ti3C2-TPAL after aging under ambient conditions. (I) Fitted Ti 2p XPS spectra and (J) relative atomic percentages of Ti species derived from Ti 2p fitting for Ti3C2 and Ti3C2-TPAL before and after aging.