

fig11
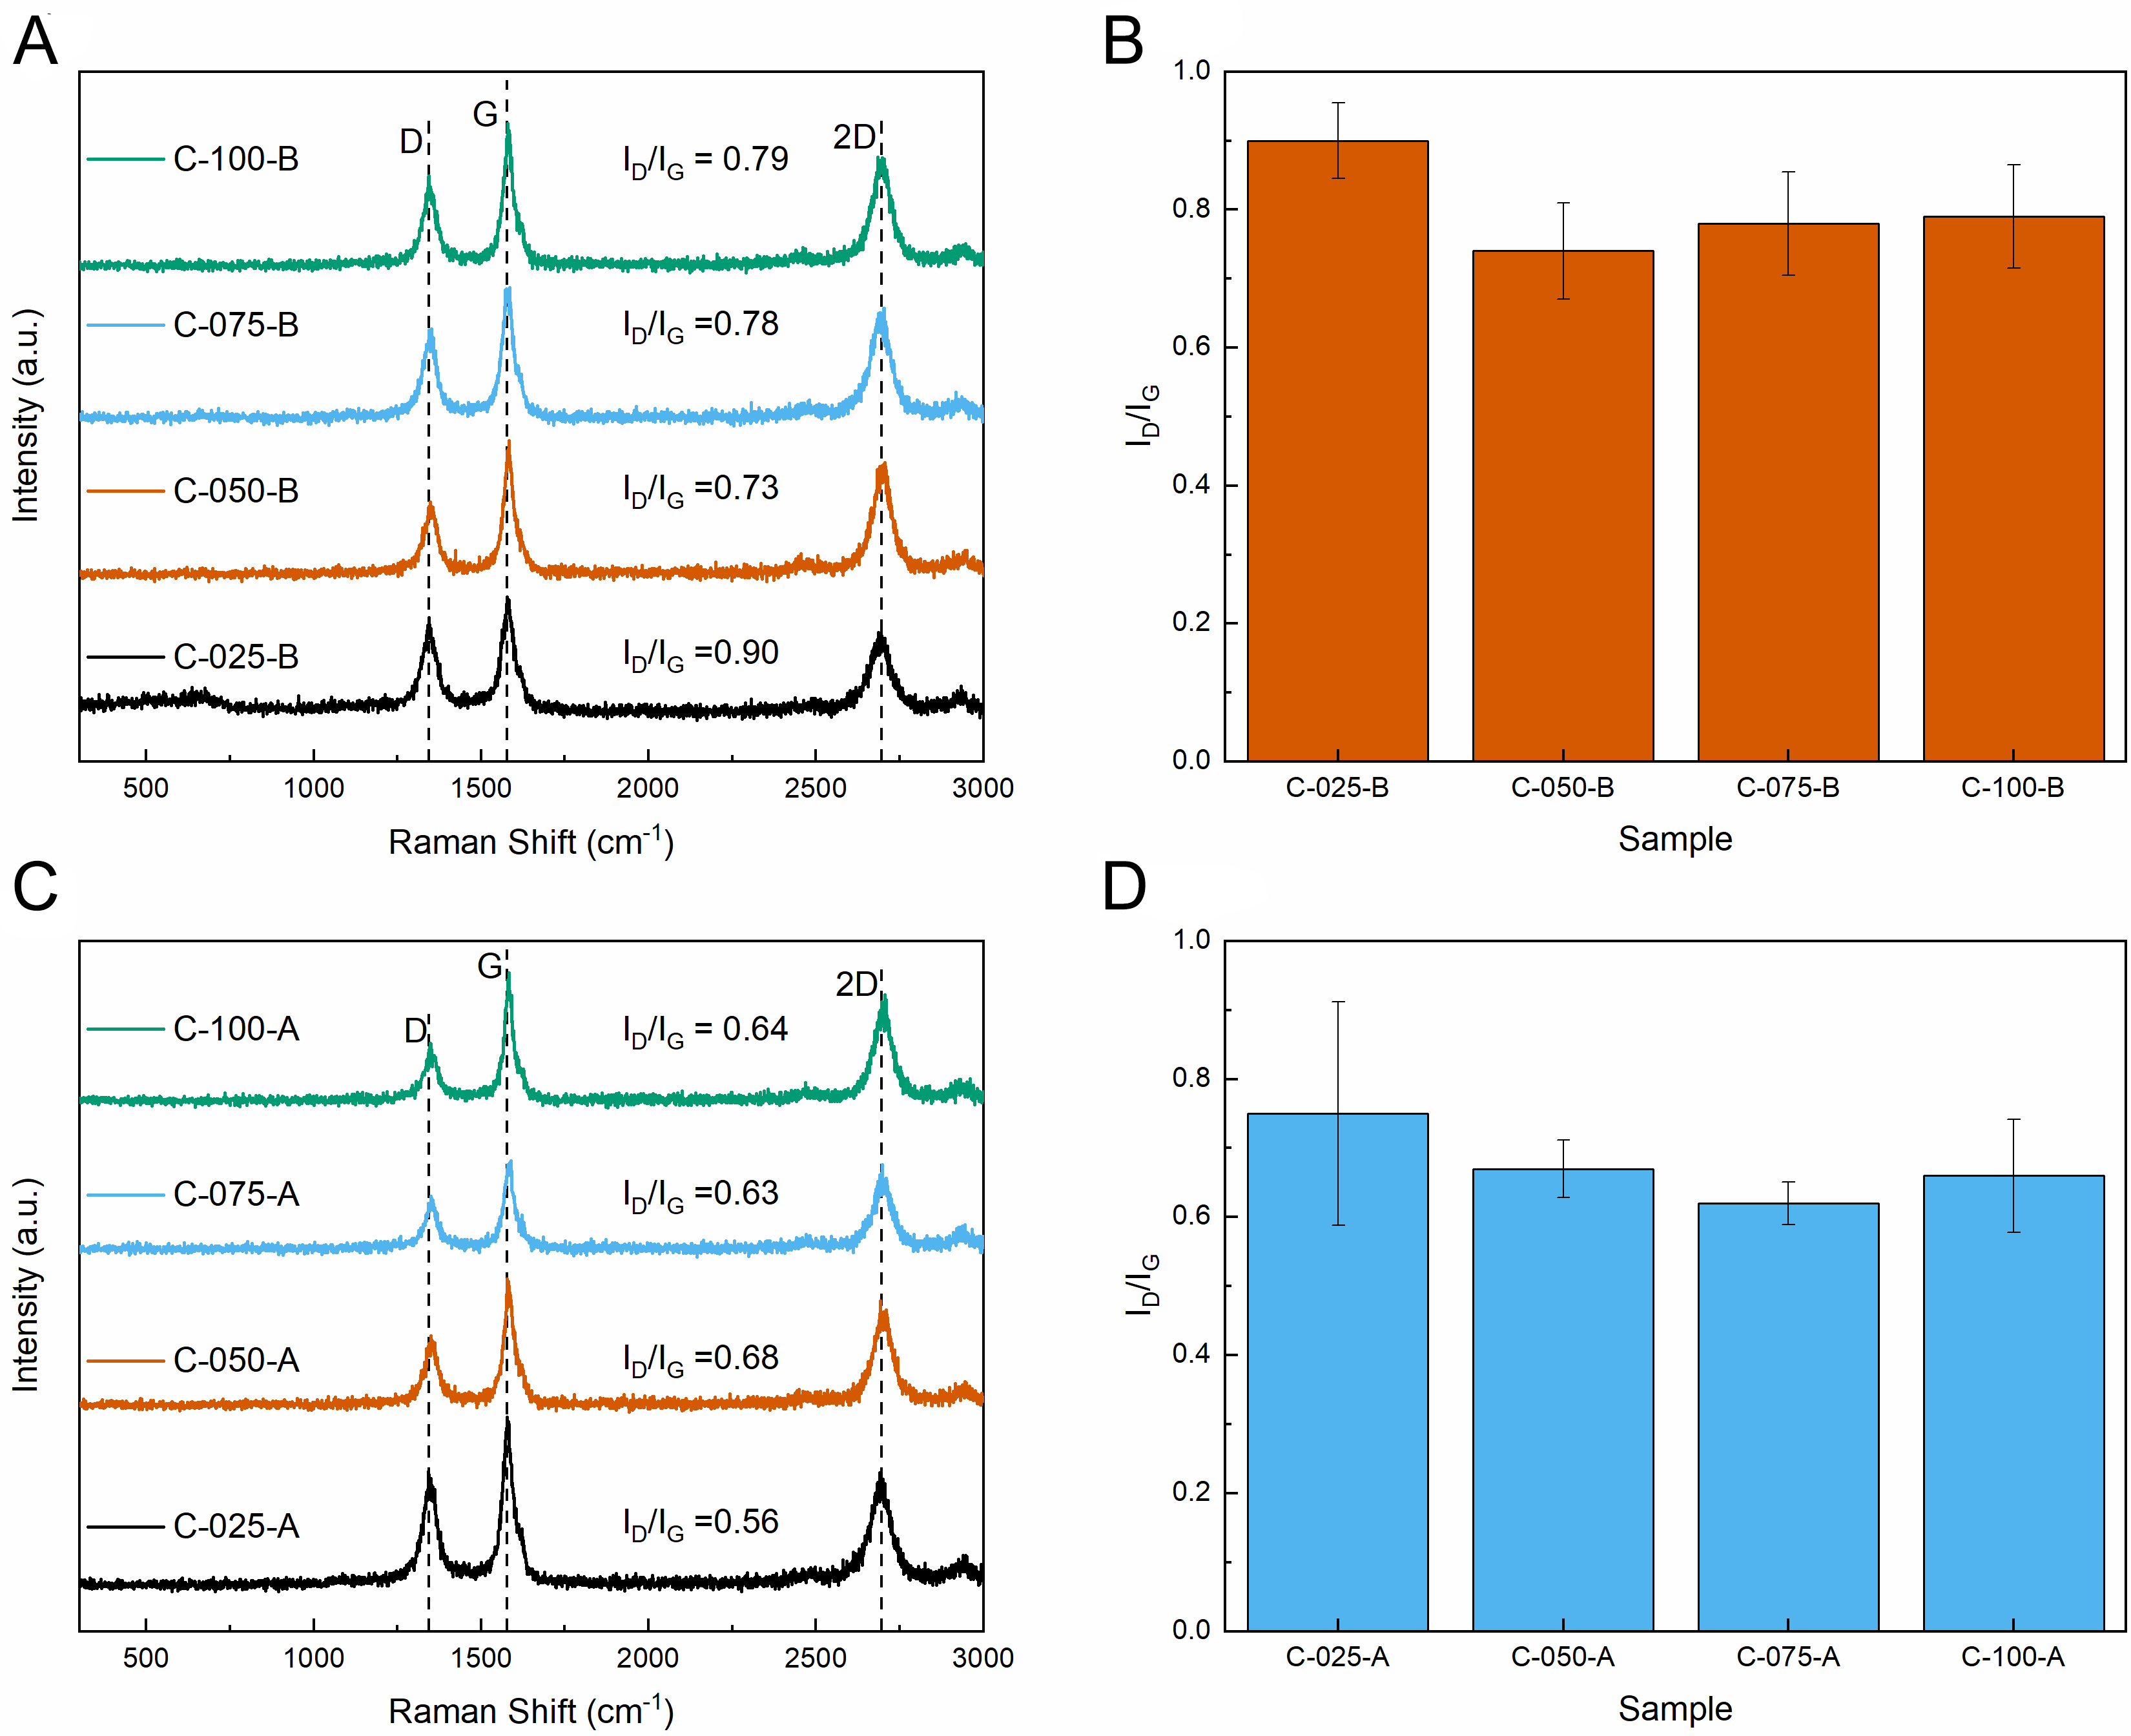
Figure 11. Raman spectra of carbon-catalyst mixtures after 8 h CDM reaction and acid-washed carbon treated with 5 M HNO3: (A and C) Raman spectra before and after acid treatment, respectively; (B and D) corresponding ID/IG ratios. The D, G, and 2D bands are indicated. The ID/IG values annotated in (A and C) correspond to the representative spectra shown, whereas the bars in (B and D) represent the mean ID/IG values obtained from three Raman spectra collected from different regions of each sample; error bars indicate the corresponding standard deviations. CDM: Catalytic decomposition of methane.