


fig3
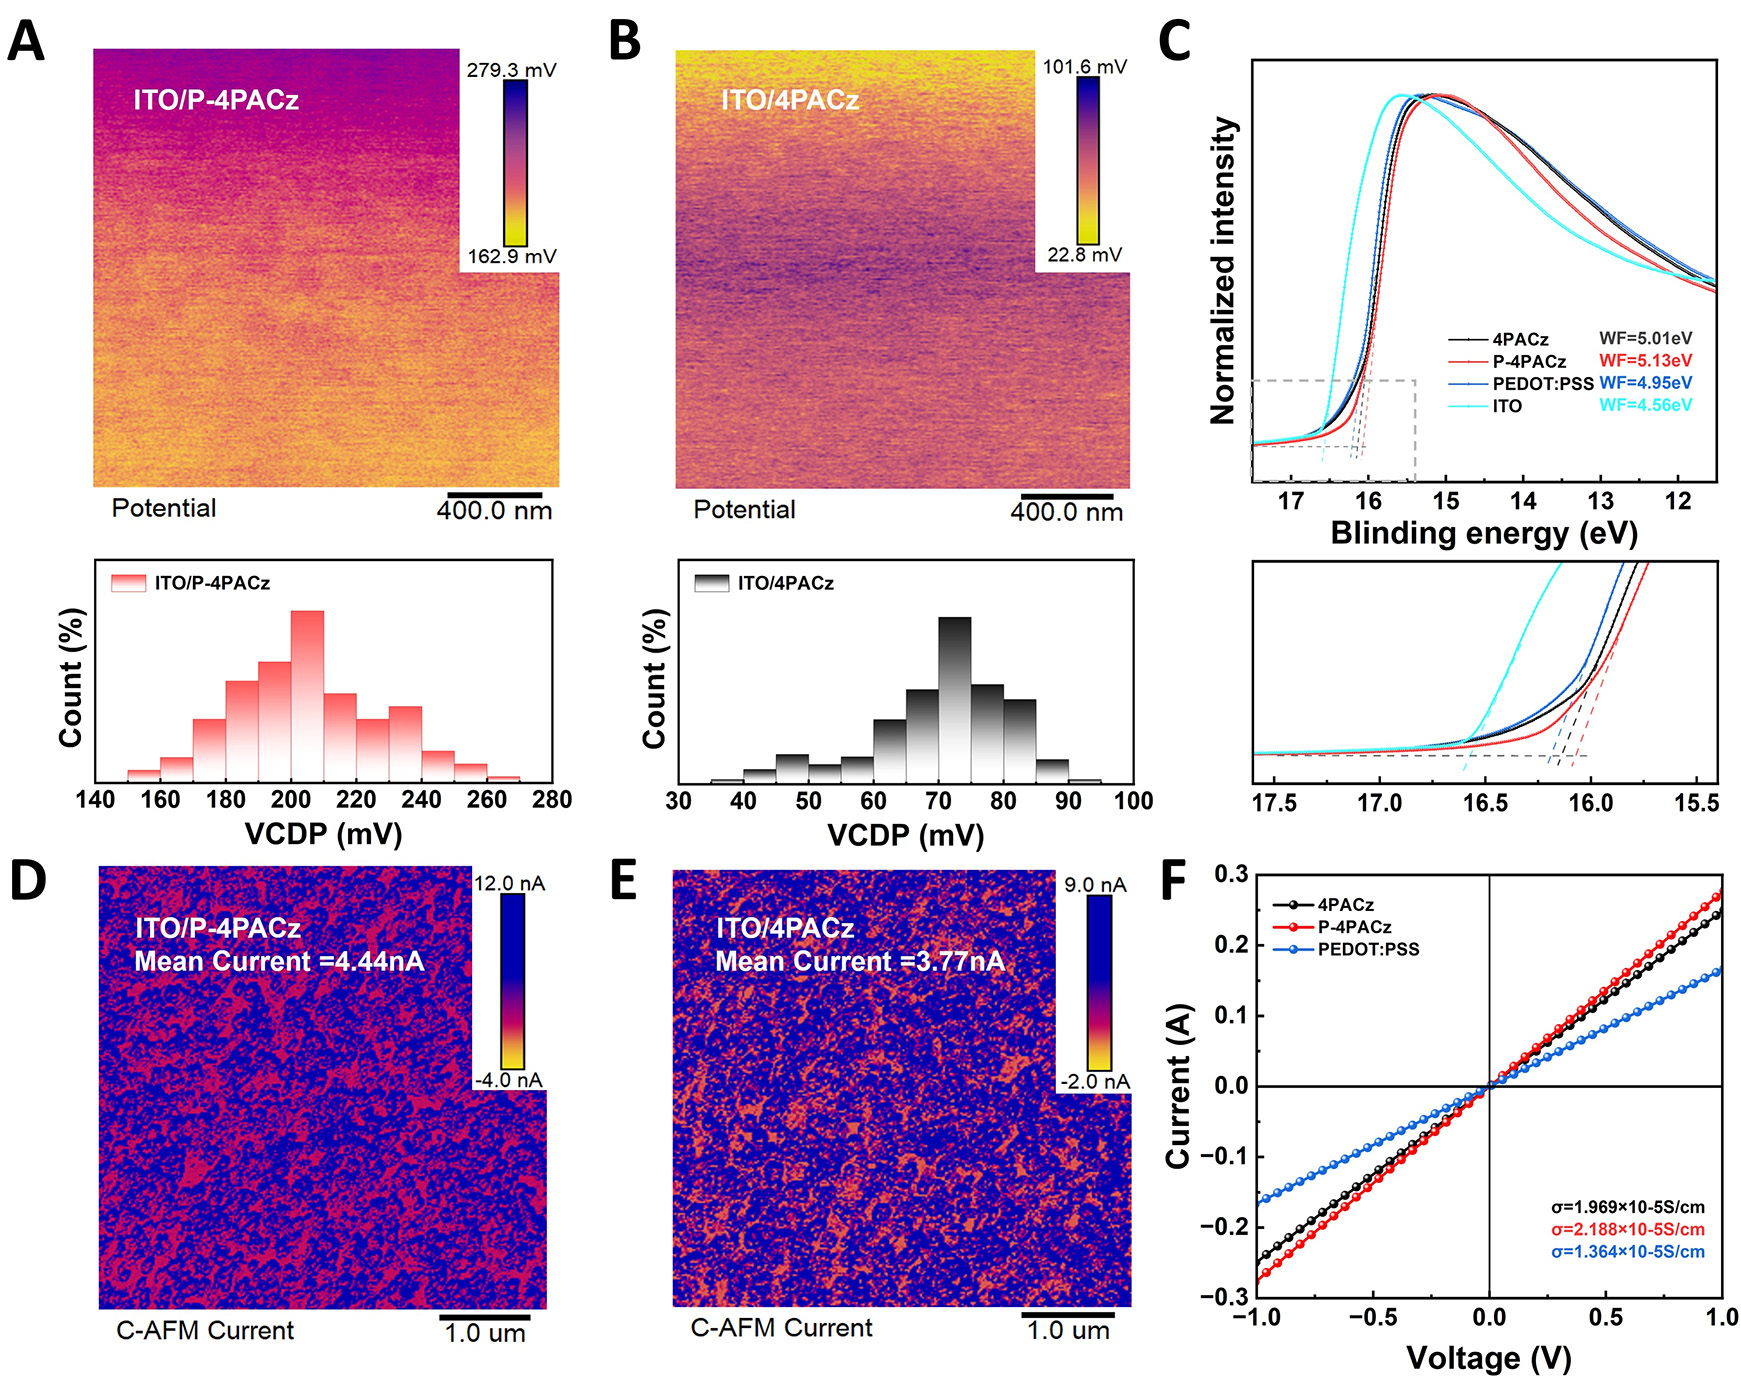
Figure 3. (A and B) Kelvin Probe Force Microscopy images and surface contact potential distributions of ITO/4PACz and ITO/P-4PACz, (C) Ultraviolet Photoelectron Spectroscopy spectra of ITO/HTLs substrates, (D and E) C-AFM images at 8.7 mV, (F) I-V characteristics of devices utilizing different HTLs, under an architecture of ITO/HTL/Ag.


