


fig4
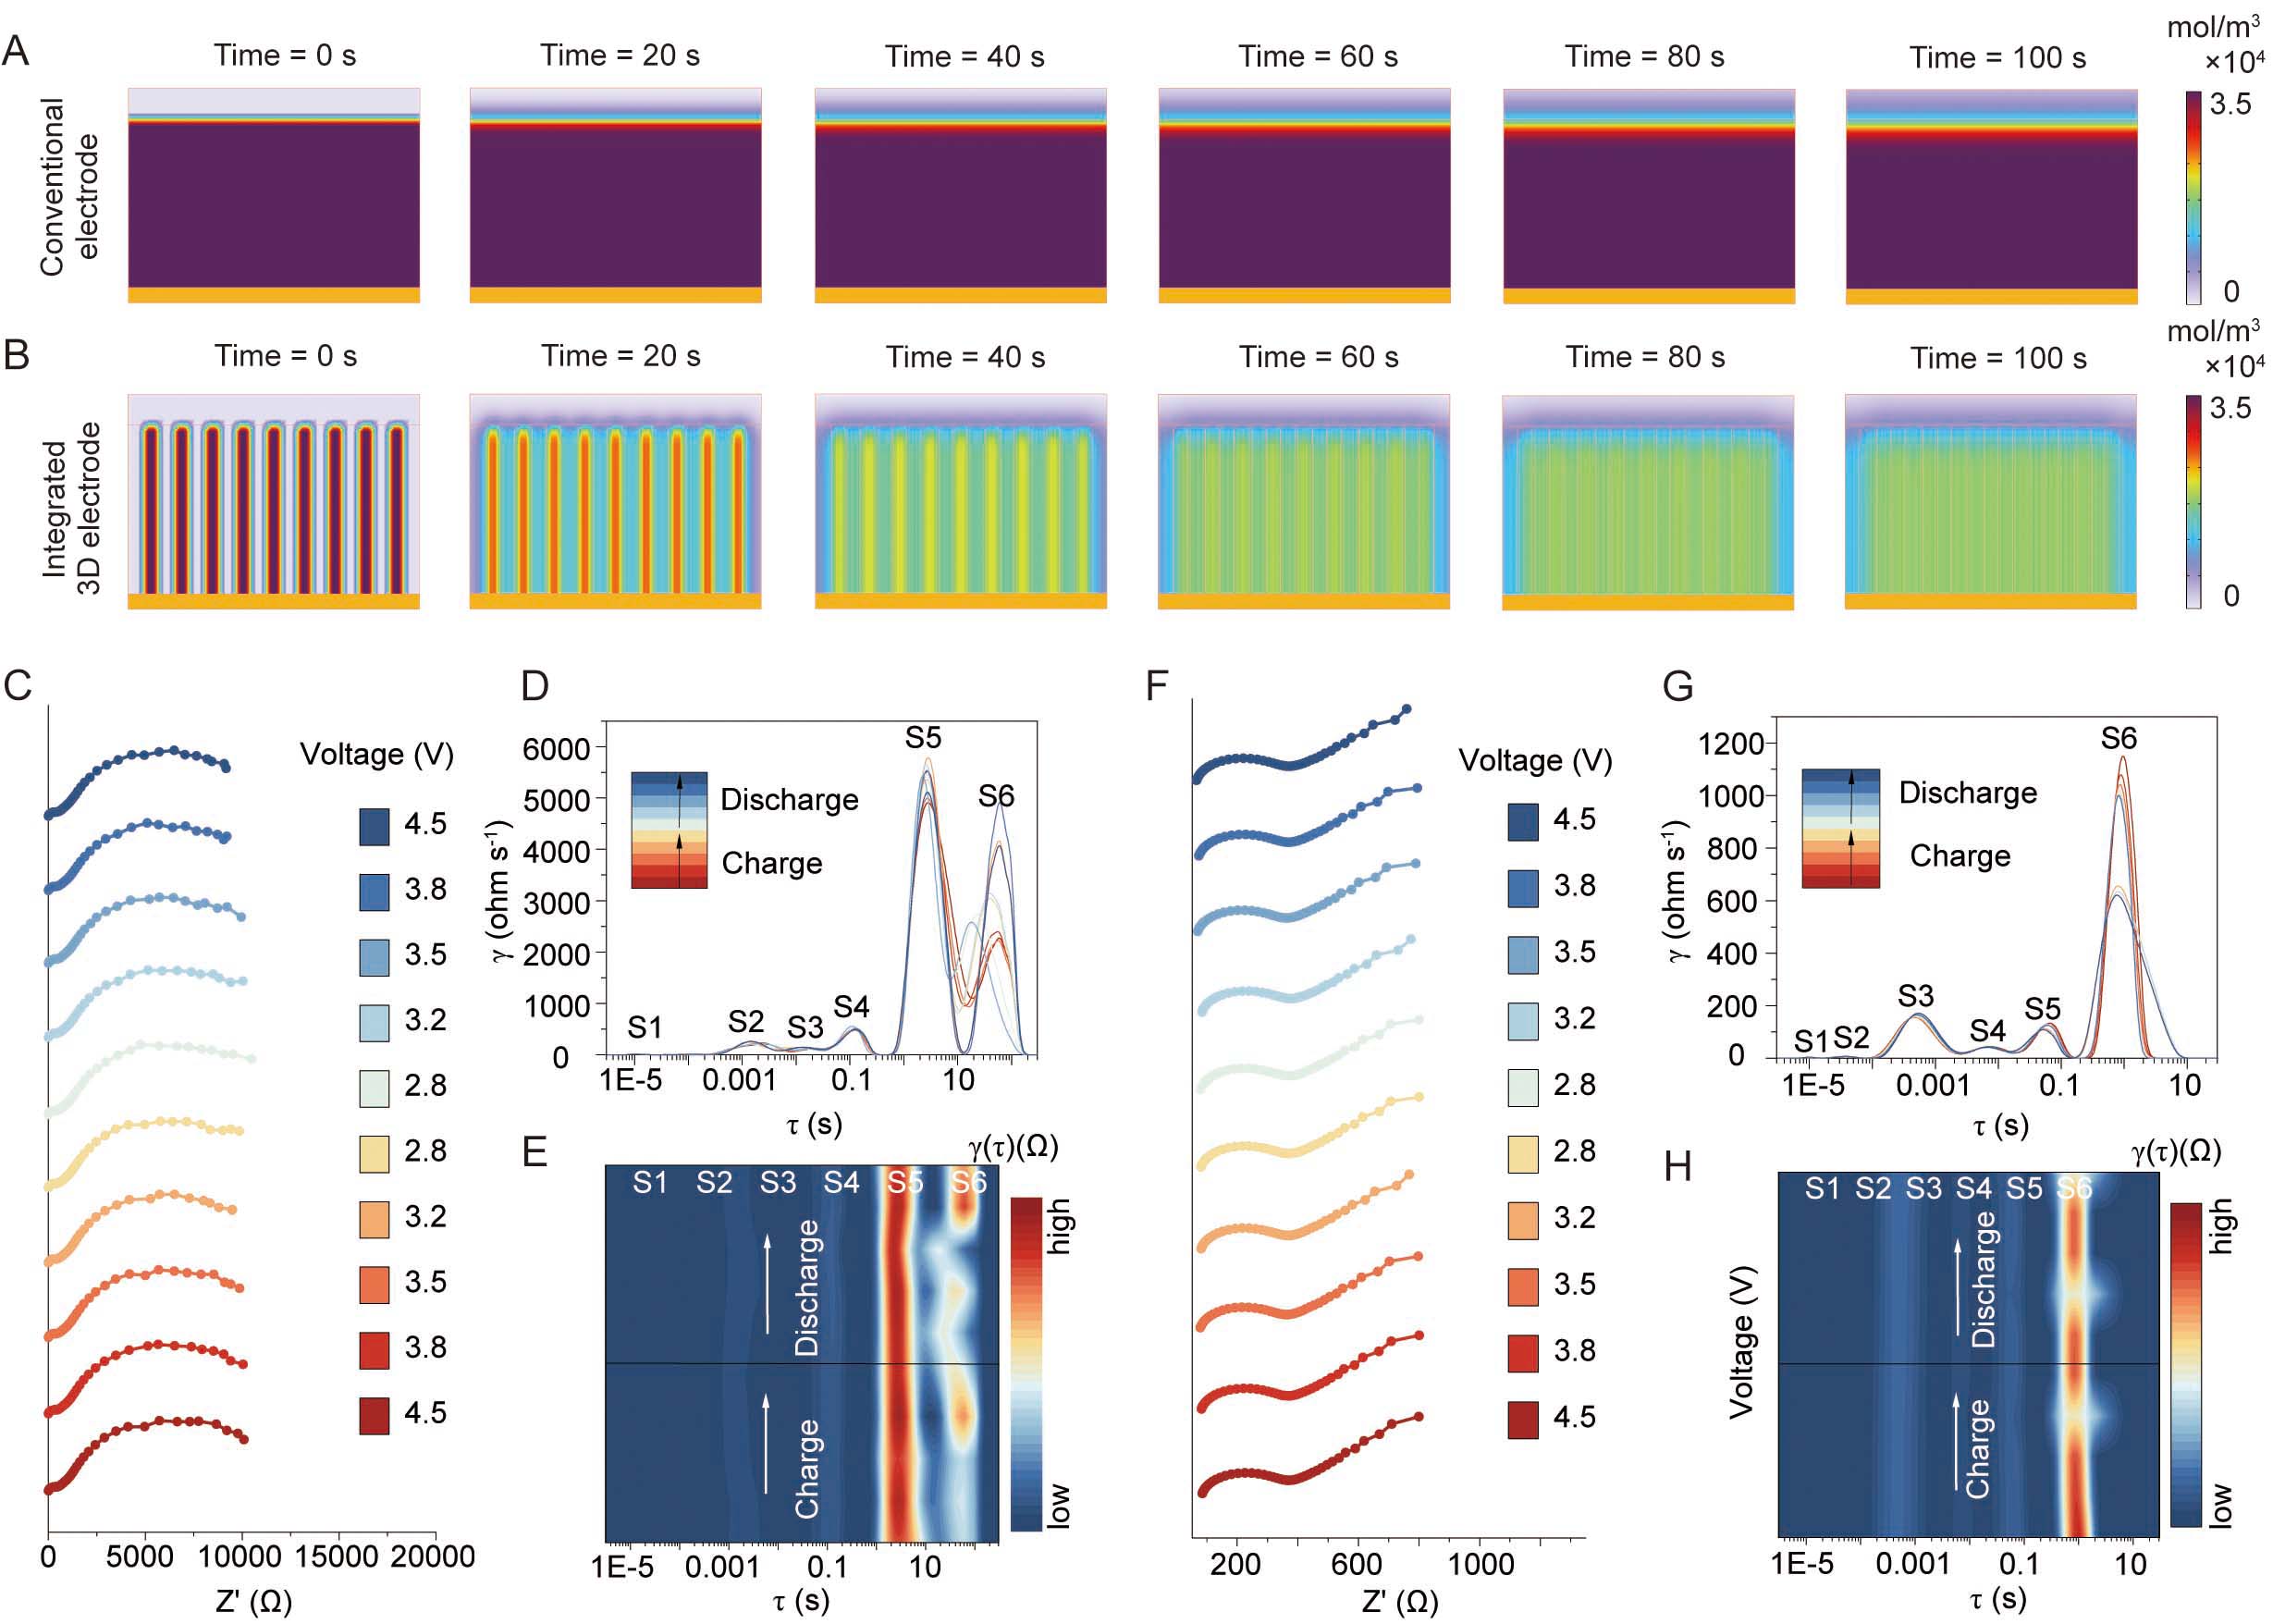
Figure 4. Mass transport simulations and operando kinetic analysis. (A and B) Simulated spatiotemporal evolution of Li+ concentration in the conventional (A) and integrated 3D (B) electrodes. (C-H) Operando electrochemical impedance spectroscopy (EIS) during charge and discharge: Nyquist plots, distribution of relaxation times (DRT) profiles, and 2D DRT contour maps for the conventional (C-E) and integrated 3D (F-H) electrodes, demonstrating drastically reduced impedance and accelerated interfacial kinetics in the 3D architecture.


