



fig11
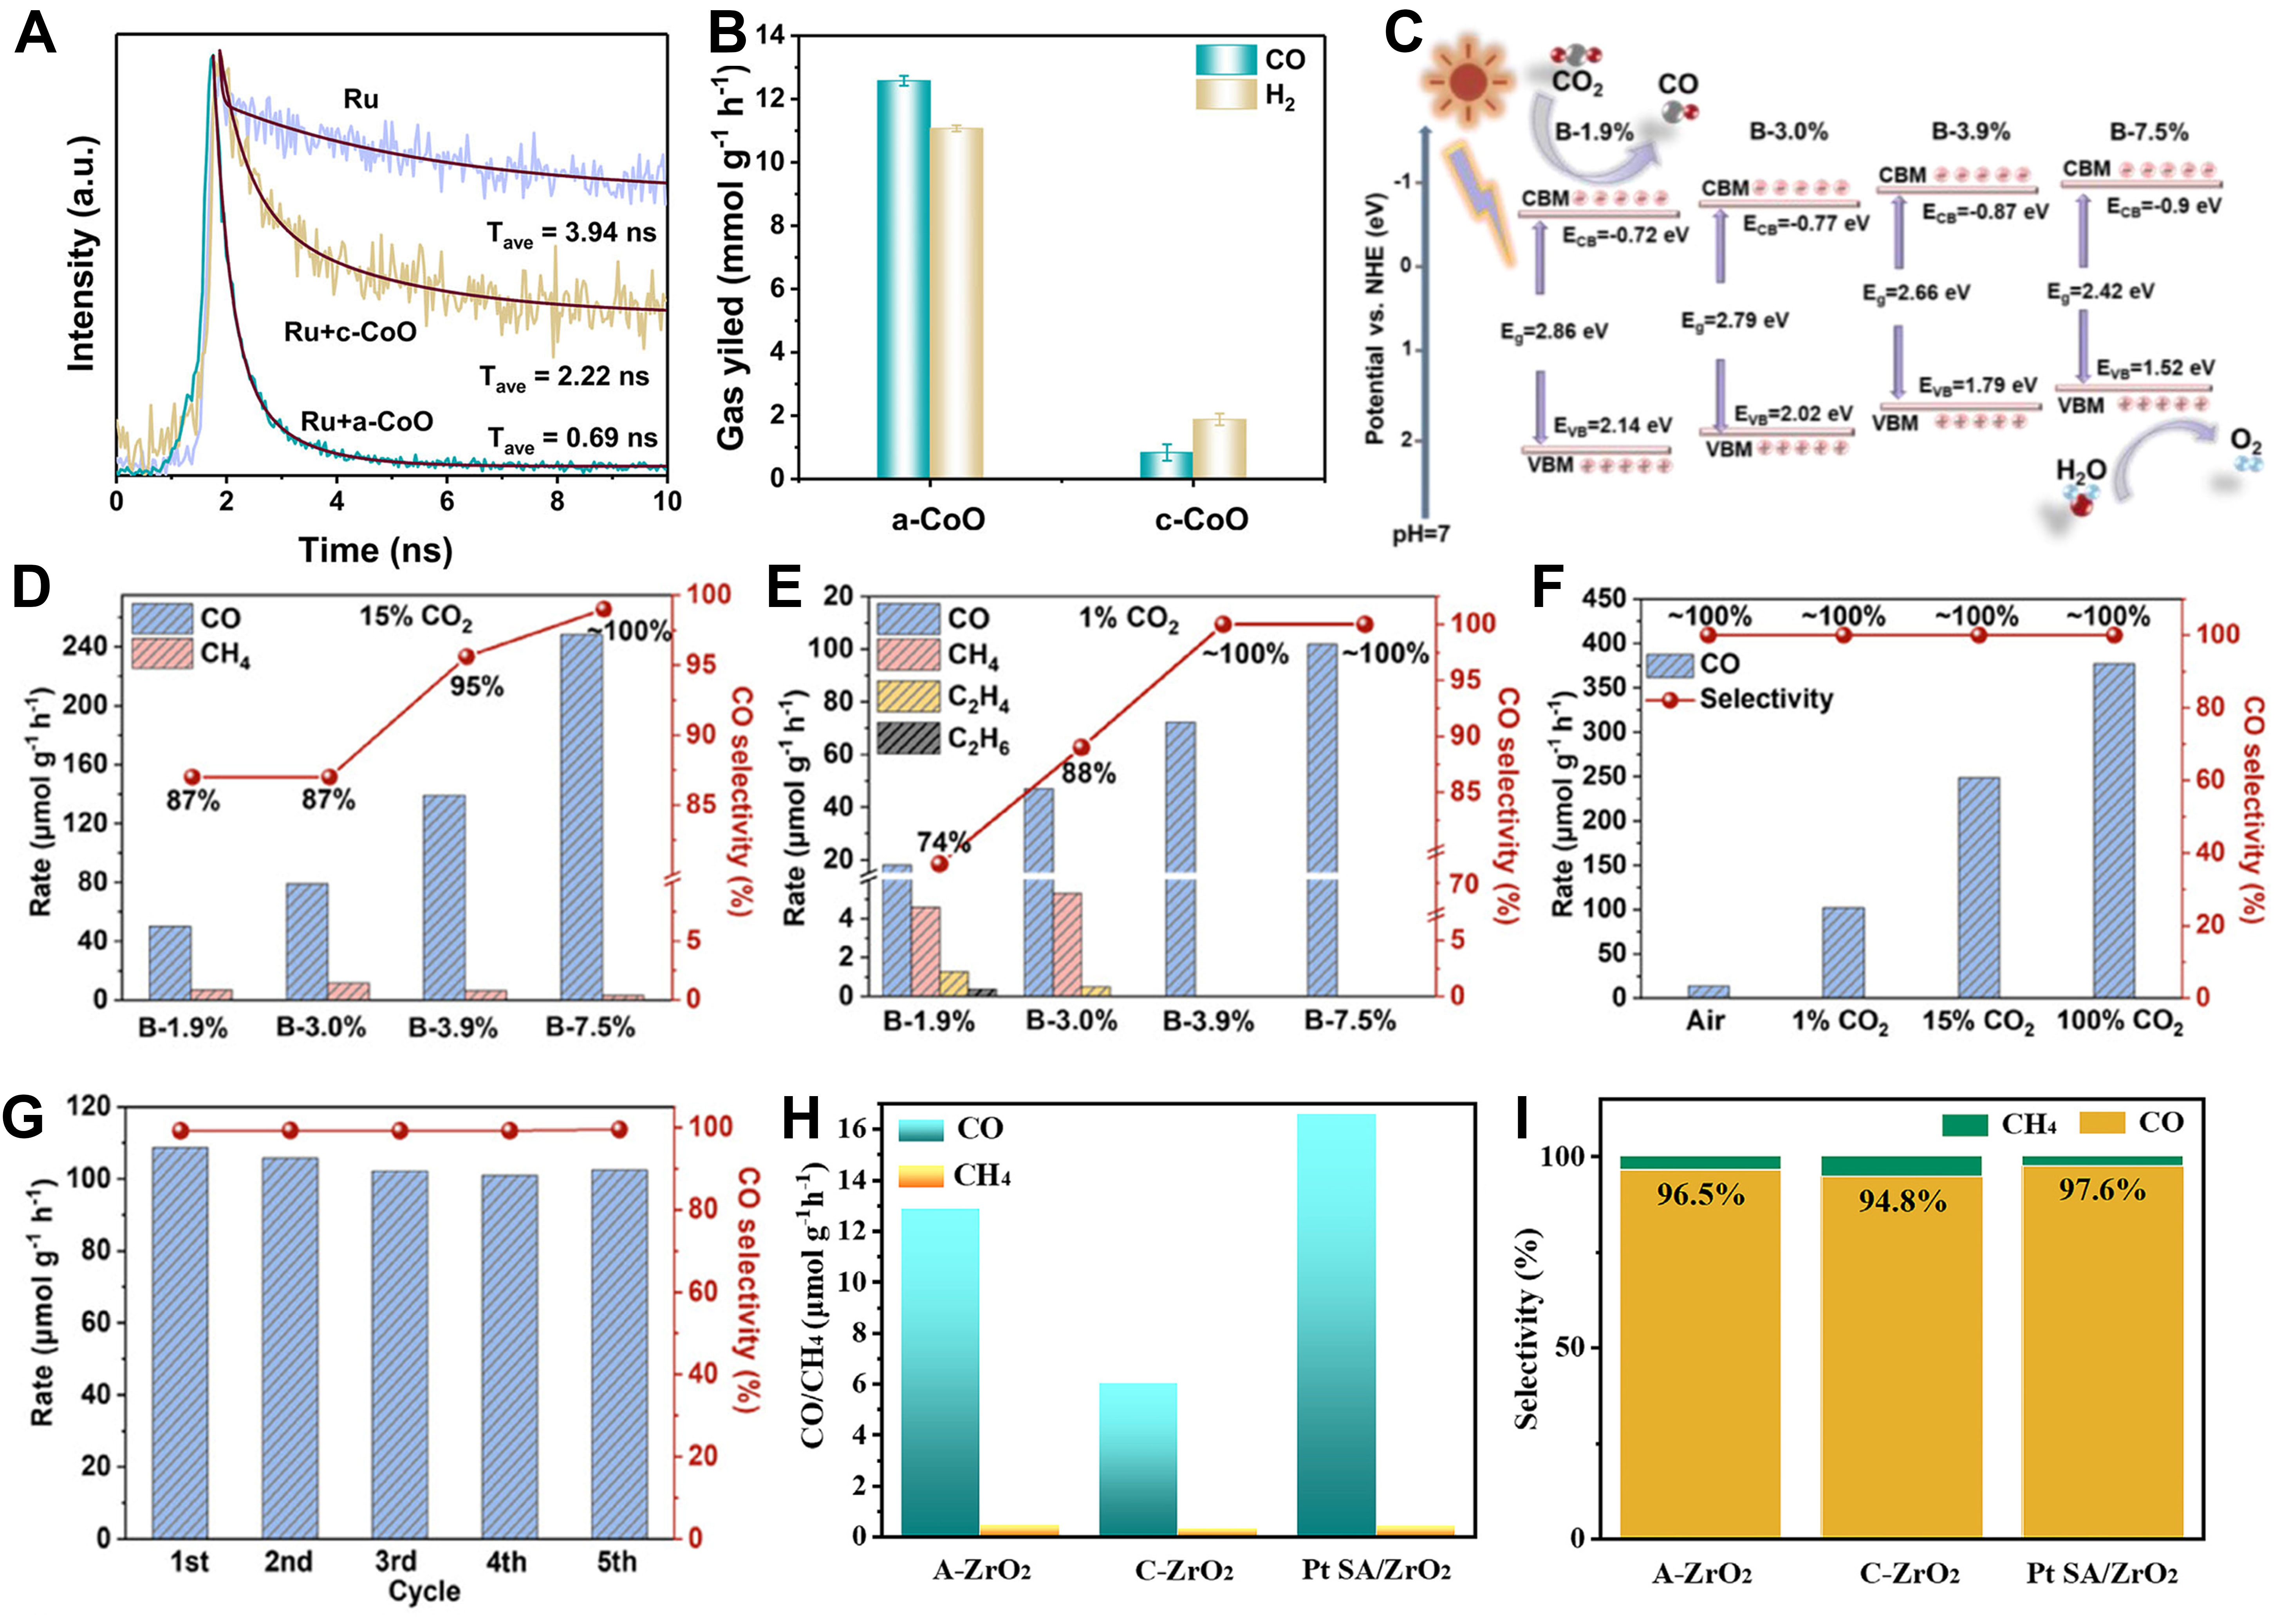
Figure 11. (A) TRPL decay spectra were measured for an aqueous system composed of 0.5 mM Ru with 1 mg mL-1 photocatalyst present; (B) A comparison of CO and H2 yields is presented across a range of different catalysts. Figure 11A and B is reprinted with permission[45]. Copyright 2025, John Wiley and Sons; (C) Presented is the band structure of B-doped CeO2/GO. Comparison of CO production rate under CO2 concentration of (D) 15% and (E) 1%, respectively; (F) CO production rate of B-7.5% measured under four different CO2 concentrations. (G) Cycling stability of amorphous CeO2/GO tested under 1% CO2. Figure 11C-G is reprinted with permission[46]. Copyright 2025, John Wiley and Sons; (H) Photocatalytic CO2 reduction products obtained over AeZrO2, CeZrO2, and Pt SA/ZrO2 after 2 h of visible light illumination; (I) Selectivity of AeZrO2, CeZrO2, and Pt SA/ZrO2 toward CO and CH4. Figure 11H and I is reprinted with permission[86]. Copyright 2022, Elsevier. VBM: Valence band maximum; CBM: conduction band minimum; SA: single atom; TRPL: time-resolved photoluminescence; GO: graphene oxide.





