



fig9
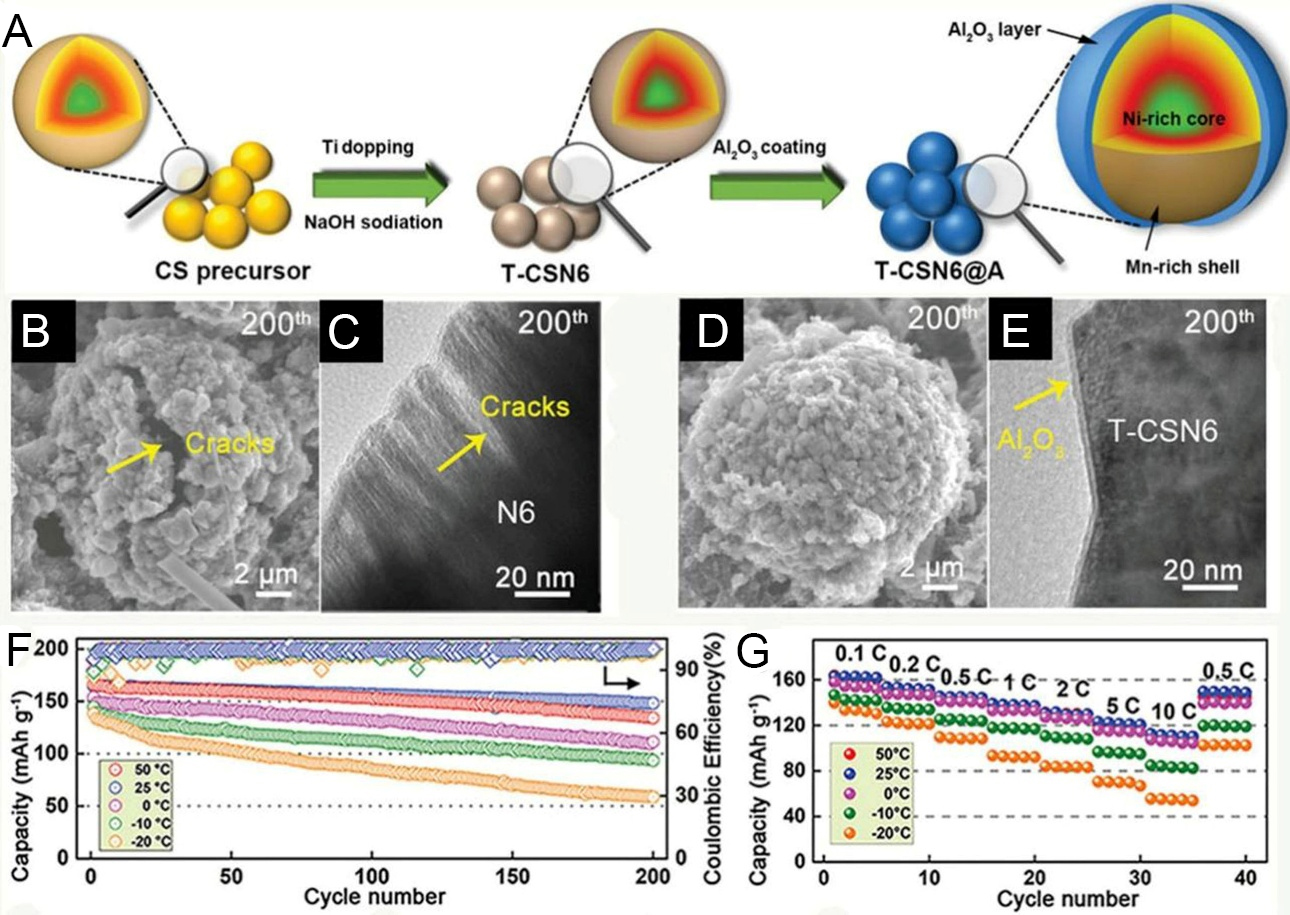
Figure 9. (A) Schematic illustration for the synthetic procedure. Typical FESEM images, TEM images, and corresponding XRD patterns of N6 (B and C), and T-CSN6@A (D and E) harvested from matching post-cycled electrodes after 200th cycles, respectively. (F) Cycling performance (0.5 C) of T-CSN6@A. (G) rate behaviors at different temperatures of T-CSN6@A. This figure is reproduced with permission from Ref.[154]. Copyright 2023, Wiley-VCH GmbH. FESEM: Field emission scanning electron microscope; TEM: transmission electron microscope; XRD: X-ray diffraction.





