

fig7
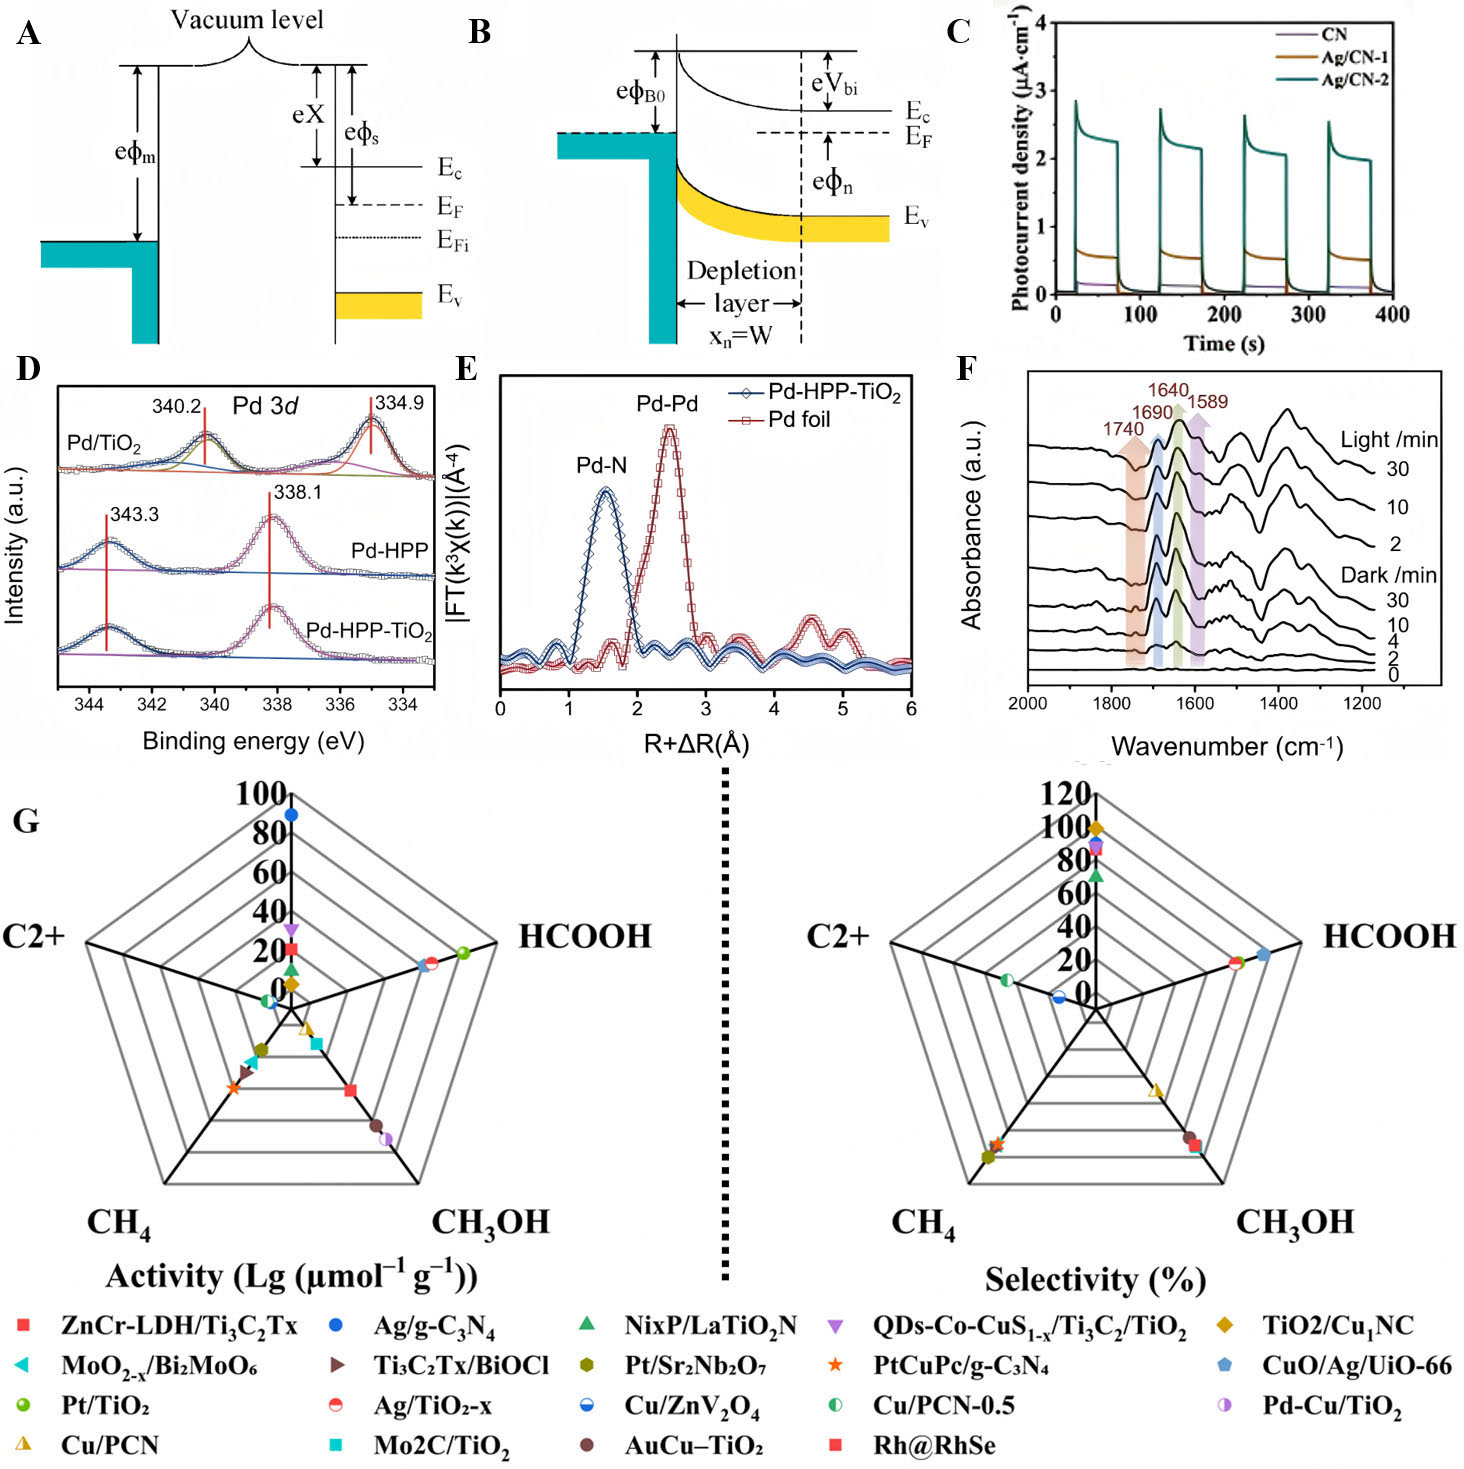
Figure 7. An ideal band diagram of the metal-N semiconductor (A) before contact and (B) after contact. Figure 7A and B is reprinted from Ref.[82] under the CC BY 4.0 license; (C) Transient photocurrent spectra (TPC). Reprinted from Ref.[83] under the CC BY 4.0 license; (D) Comparison of Pd 3d XPS spectra for three photocatalysts; (E) Fourier transformed EXAFS spectra of Pd-HPP-TiO2 and references; (F) In situ DRIFTS test of gas adsorption on Pd-HPP-TiO2 in the dark and during the photocatalytic CO2 reduction under UV-visible light irradiation. Figure 7D-F is reprinted from Ref.[84] under the CC BY 4.0 license; (G) Radar plot comparing catalytic activity (expressed as the logarithm of production rate per mass of catalyst) and selectivity among carbon-containing products. XPS: X-ray photoelectron spectroscopy; EXAFS: extended X-ray absorption fine structure; DRIFTS: diffuse reflectance infrared Fourier transform spectroscopy; Pd-HPP-TiO2: Palladium(II)-coordinated hyper-crosslinked porphyrin-based polymer coated hollow titanium dioxide; UV: ultraviolet.