


fig3
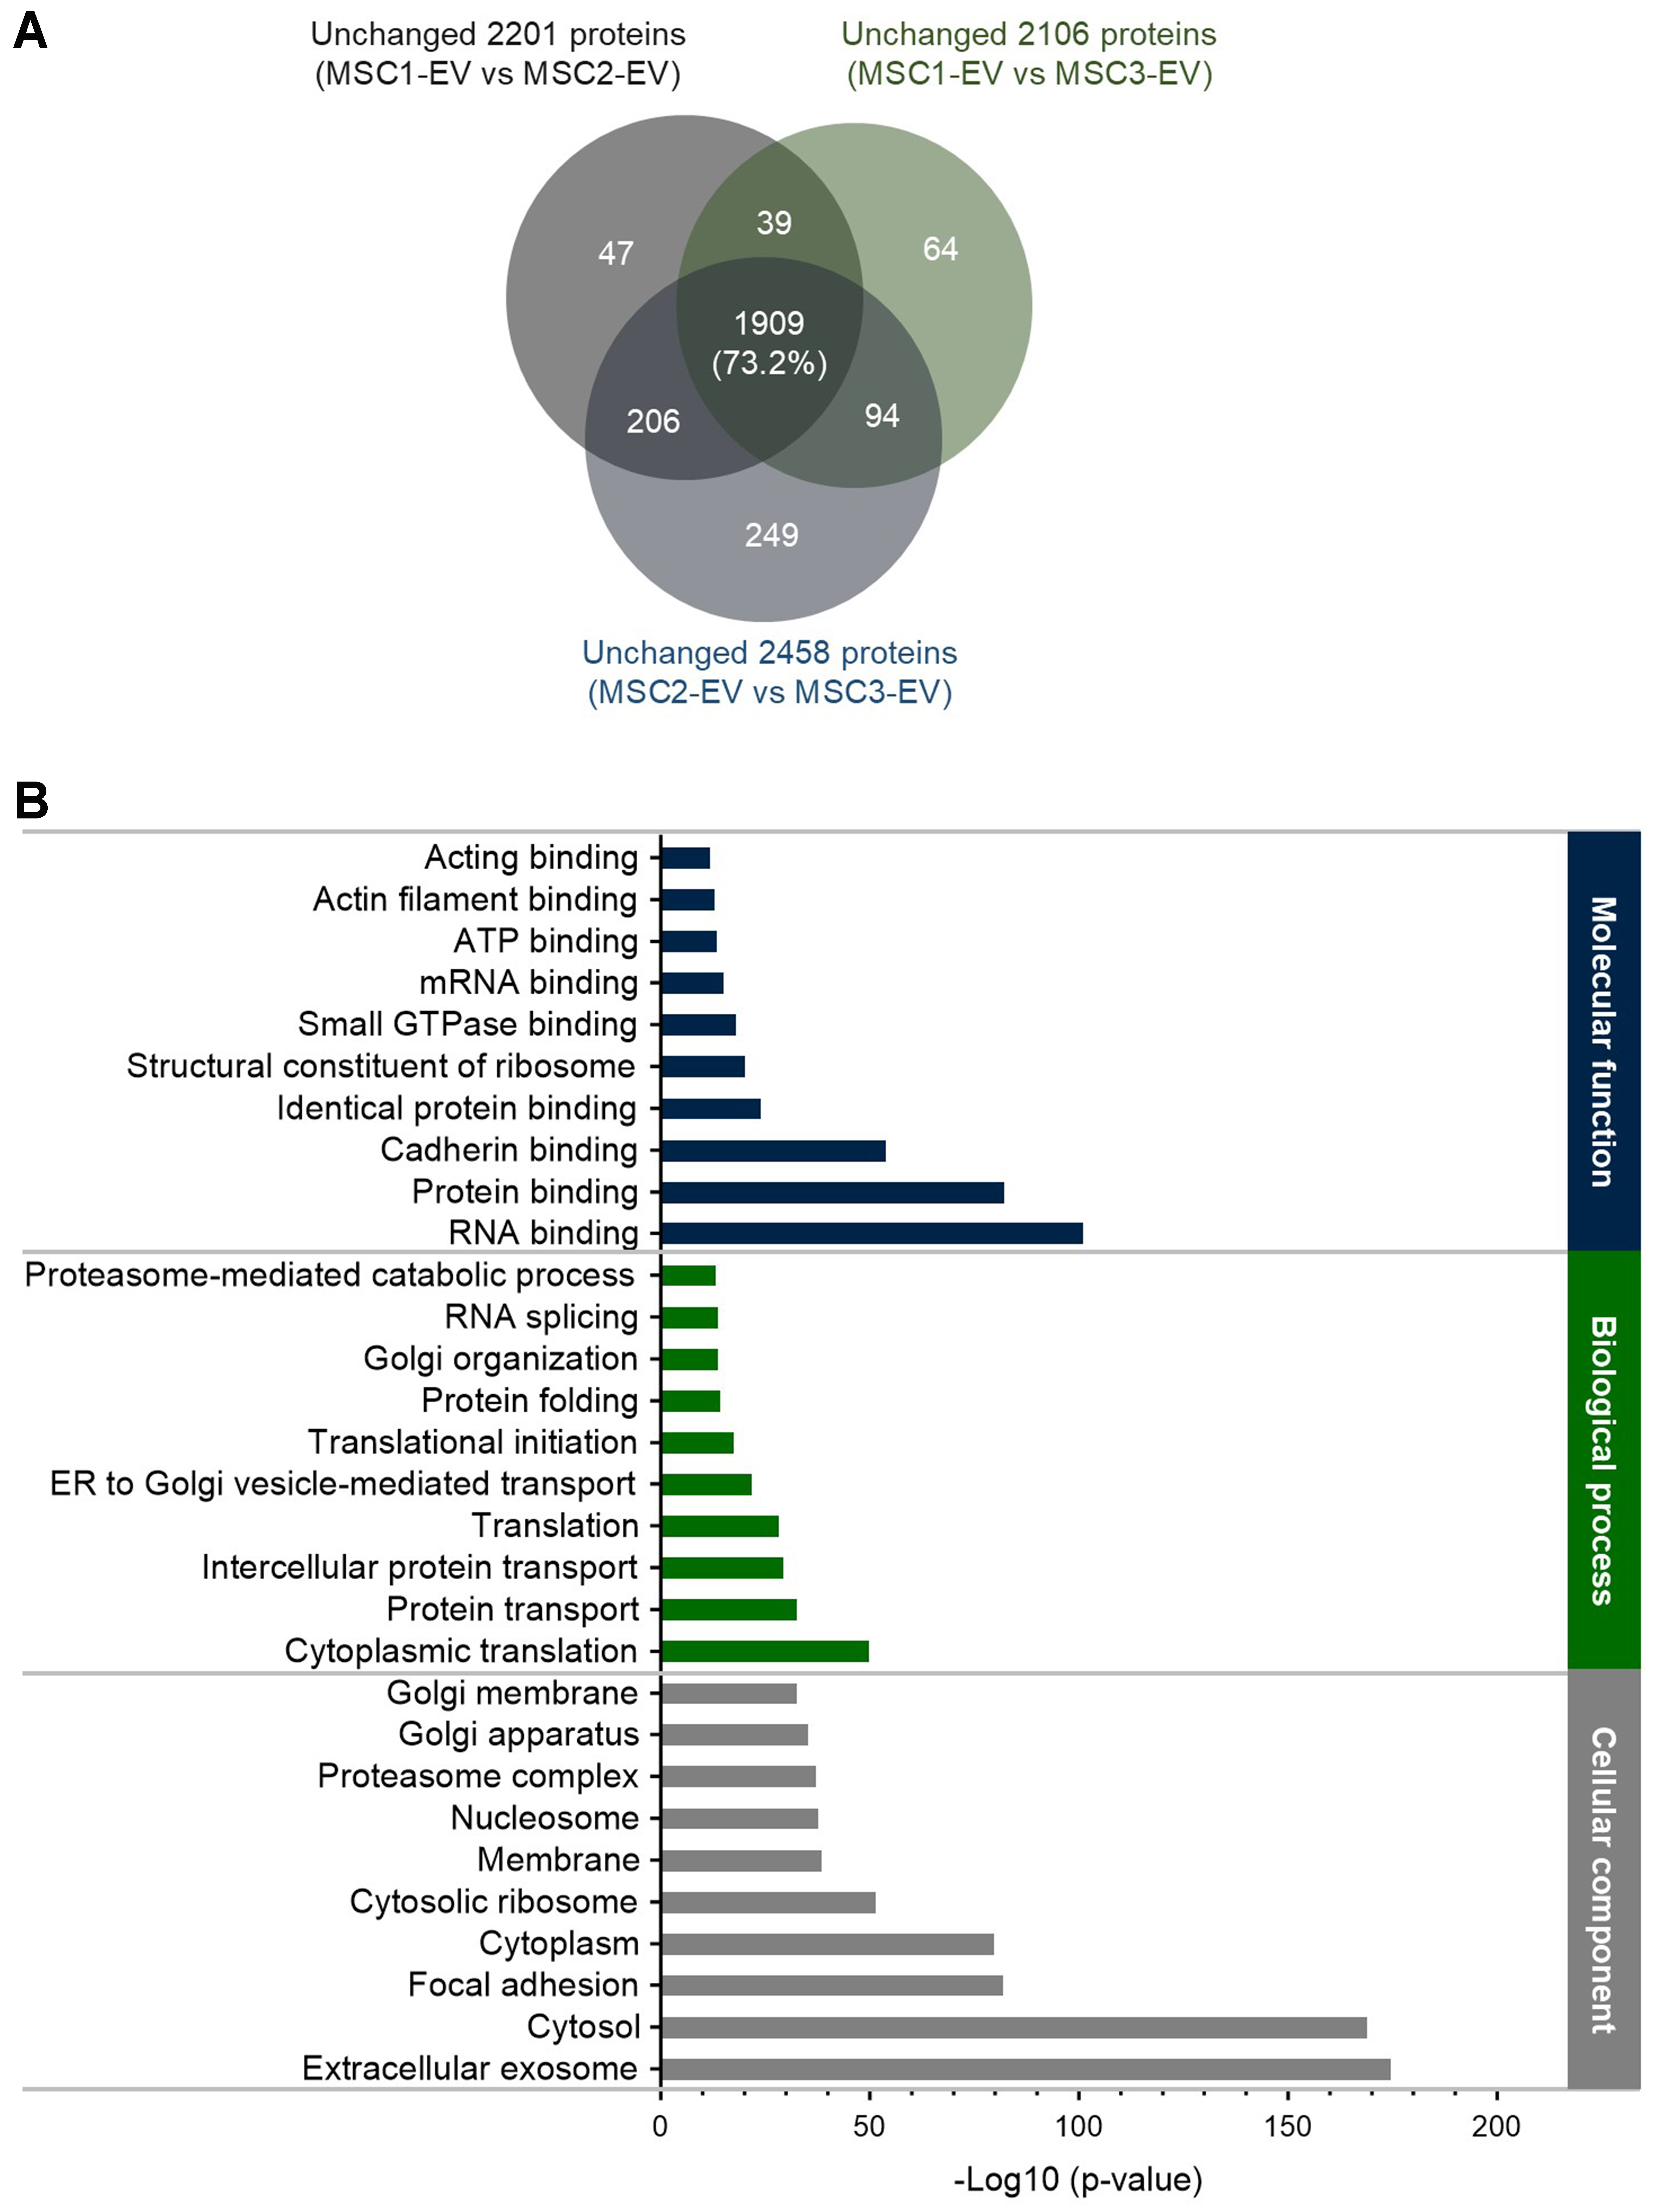
Figure 3. GO analysis of vesicular proteins unchanged across three EV batches. (A) Venn diagram showing the overlap of proteins that remained unchanged (< 2-fold, not significant) in pairwise comparisons of MSC-EVs (MSC1-EV vs. MSC2-EV, MSC1-EV vs. MSC3-EV, and MSC2-EV vs. MSC3-EV). The diagram indicates the proteins consistently stable across all three batches (1,909 proteins, 73.2% of 2,608 total proteins); (B) GO analysis of the common unchanged proteins, categorized by molecular function, biological process, and cellular component. Enrichment analysis highlights proteins associated with exosomes, indicating core EV protein composition conserved across different batches. GO: Gene Ontology; EV: extracellular vesicle; MSC: mesenchymal stem cell; ATP: adenosine triphosphate; mRNA: messenger RNA; ER: endoplasmic reticulum.


