





fig7
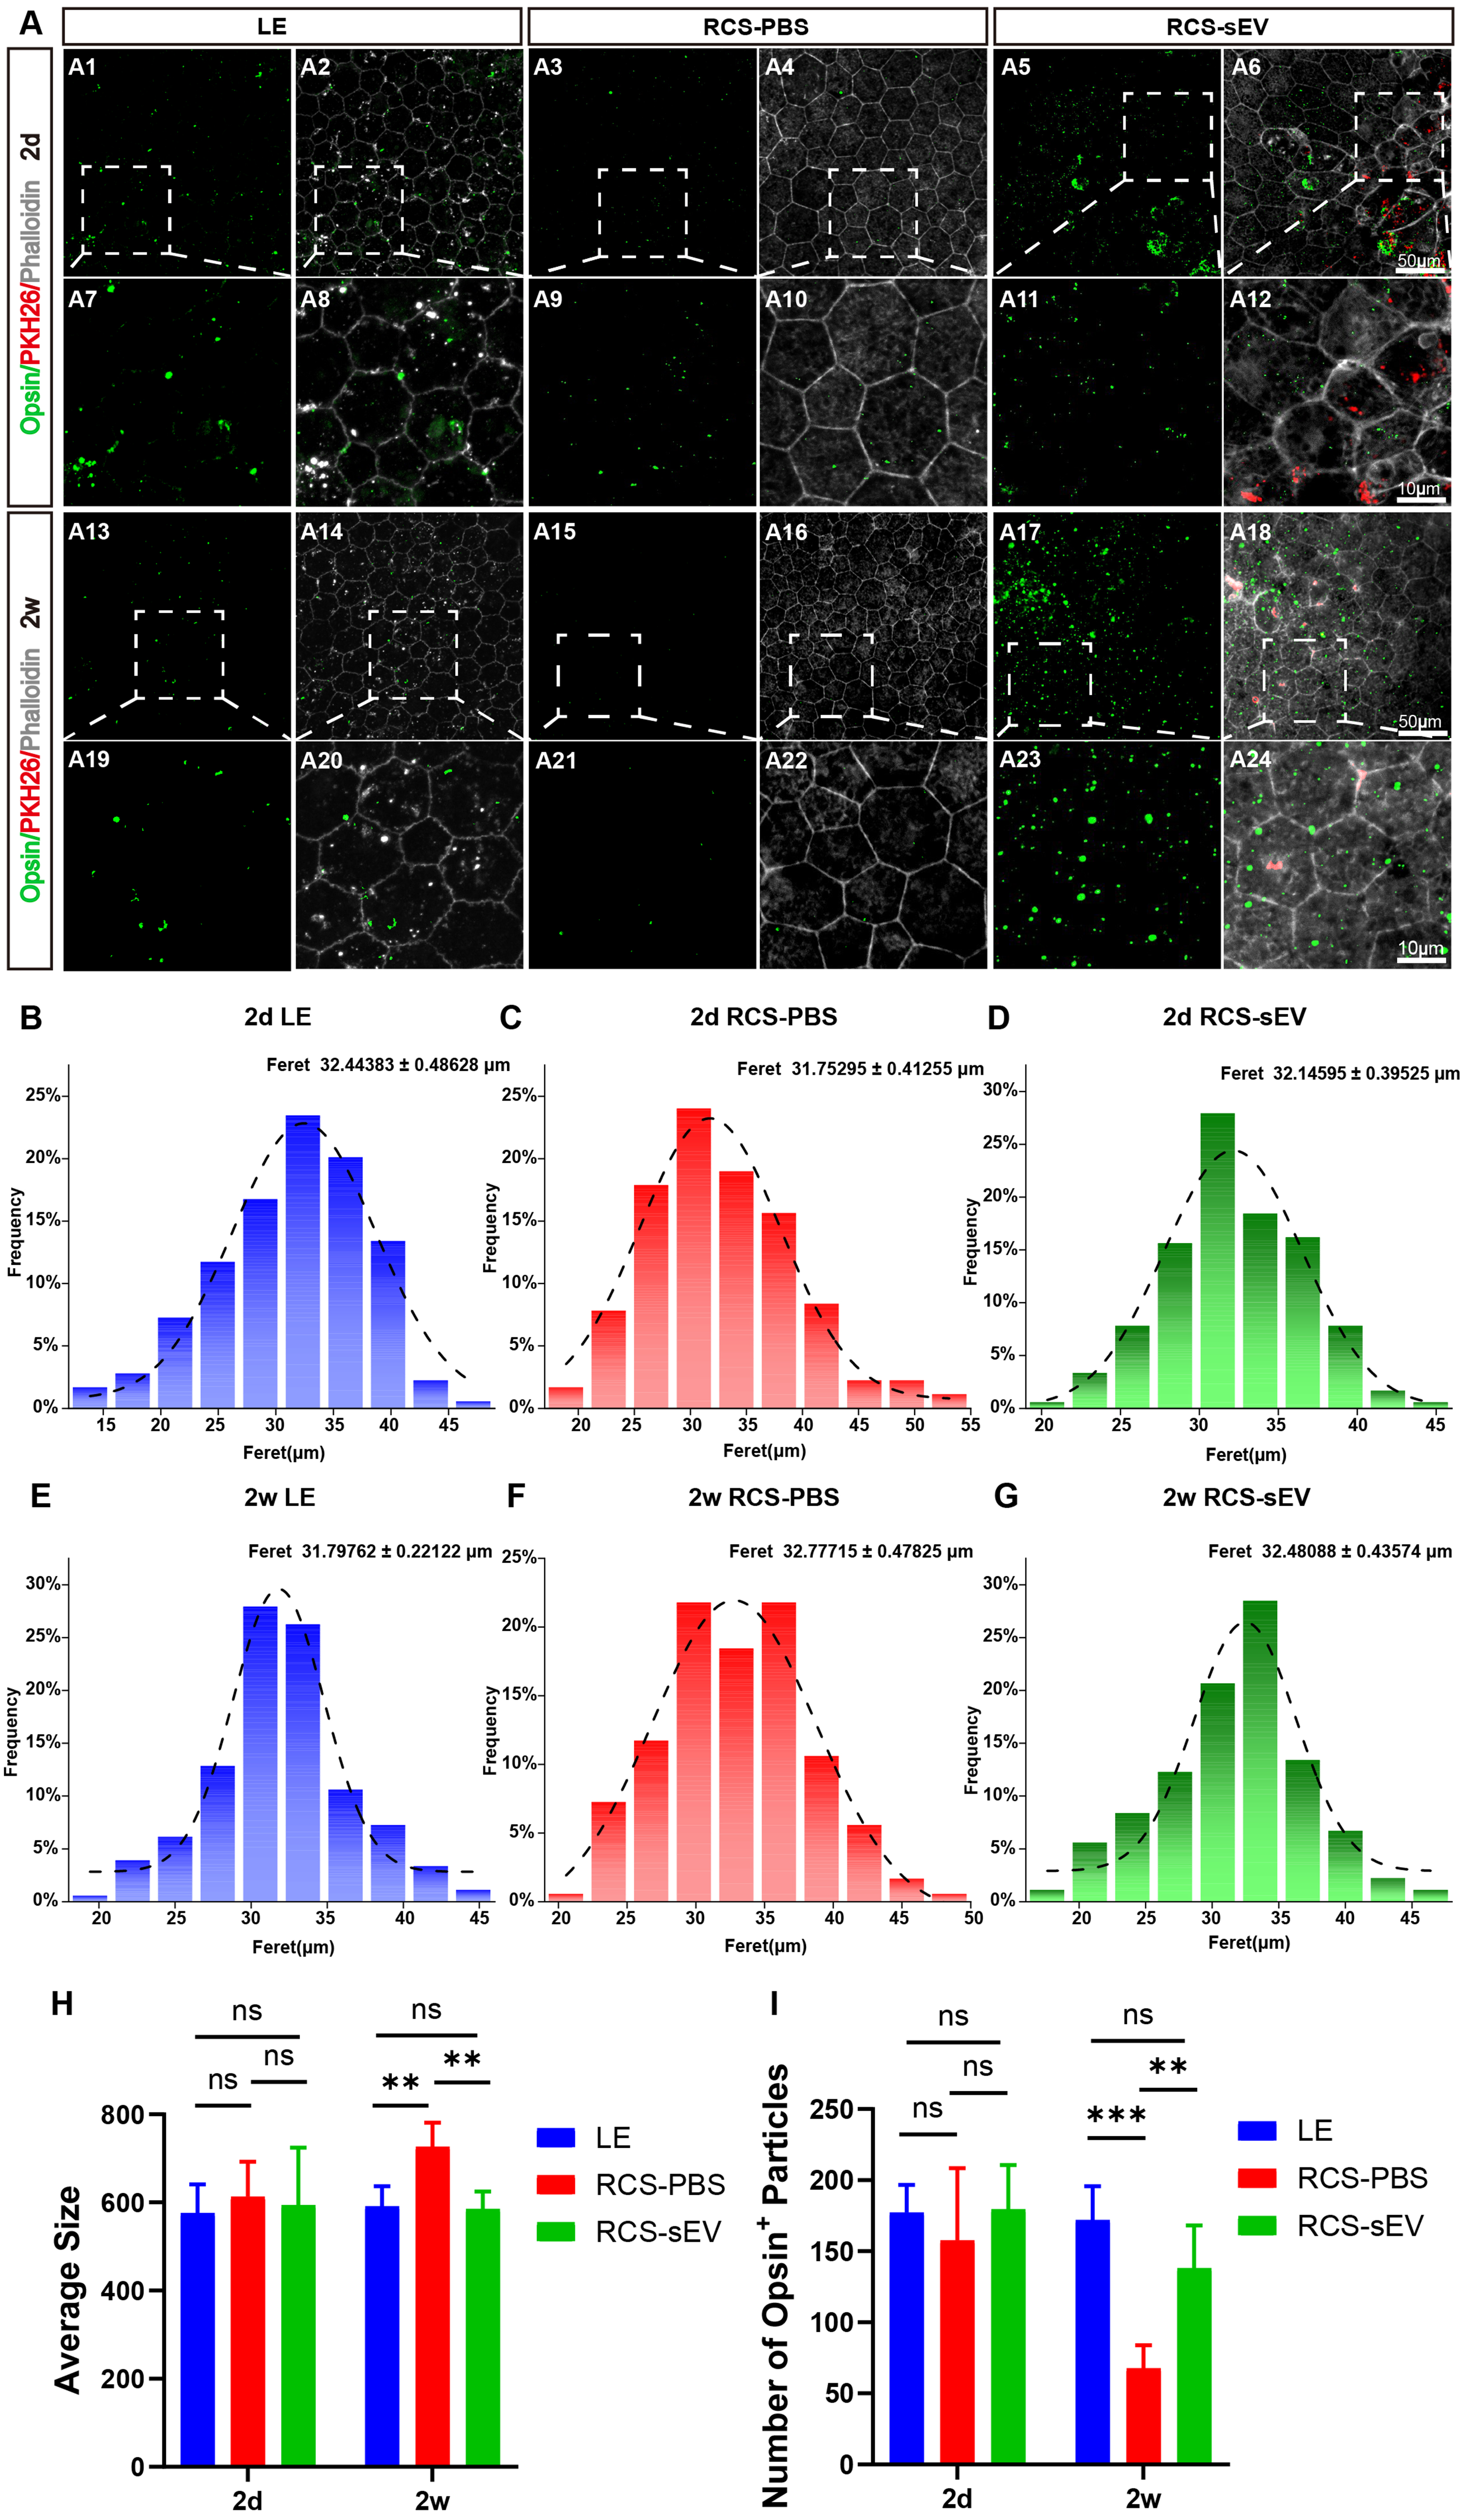
Figure 7. OEC-sEVs enhance RPE phagocytic activity in RCS rats. (A) Fluorescent staining of Phalloidin (grey) and Opsin (green) in retinal sections in LE, RCS-PBS, and RCS-sEV groups at day 2 (A1-A12) and week 2 (A13-A24). (A1-A6) Scale bar = 50 μm. (A7-A12) Scale bar = 10 μm. (A13-A18) Scale bar = 50 μm. (A19-A24) Scale bar = 10 μm. The dashed boxes denote the regions selected for magnification in the subsequent panels; (B-D) Histogram of Feret diameter distribution of RPE cells with Gaussian function fitting in LE, RCS-PBS, and RCS-sEV groups at day 2; (E-G) Histogram of Feret diameter distribution of RPE cells with Gaussian function fitting in LE, RCS-PBS, and RCS-sEV groups at week 2; (H) The average sizes of RPE cells in LE, RCS-PBS, and RCS-sEV groups at day 2 and week 2; (I) Quantitative analysis of the number of fluorescent particles per square at day 2 and week 2. n = 4 biologically independent rats per group. Data are represented as mean ± SD. **P < 0.01, ***P < 0.001, ns, no statistical difference. One-way ANOVA, followed by Tukey’s multiple comparisons test, was conducted for multiple comparisons. ANOVA: Analysis of variance; LE: Long Evans; OEC-sEVs: olfactory ensheathing cell-derived small extracellular vesicles; PBS: phosphate-buffered saline; RCS: Royal College of Surgeons; RCS-PBS: Royal College of Surgeons rats treated with phosphate-buffered saline; RCS-sEV: Royal College of Surgeons rats treated with small extracellular vesicles; RPE: retinal pigment epithelium; SD: standard deviation.




