

fig4
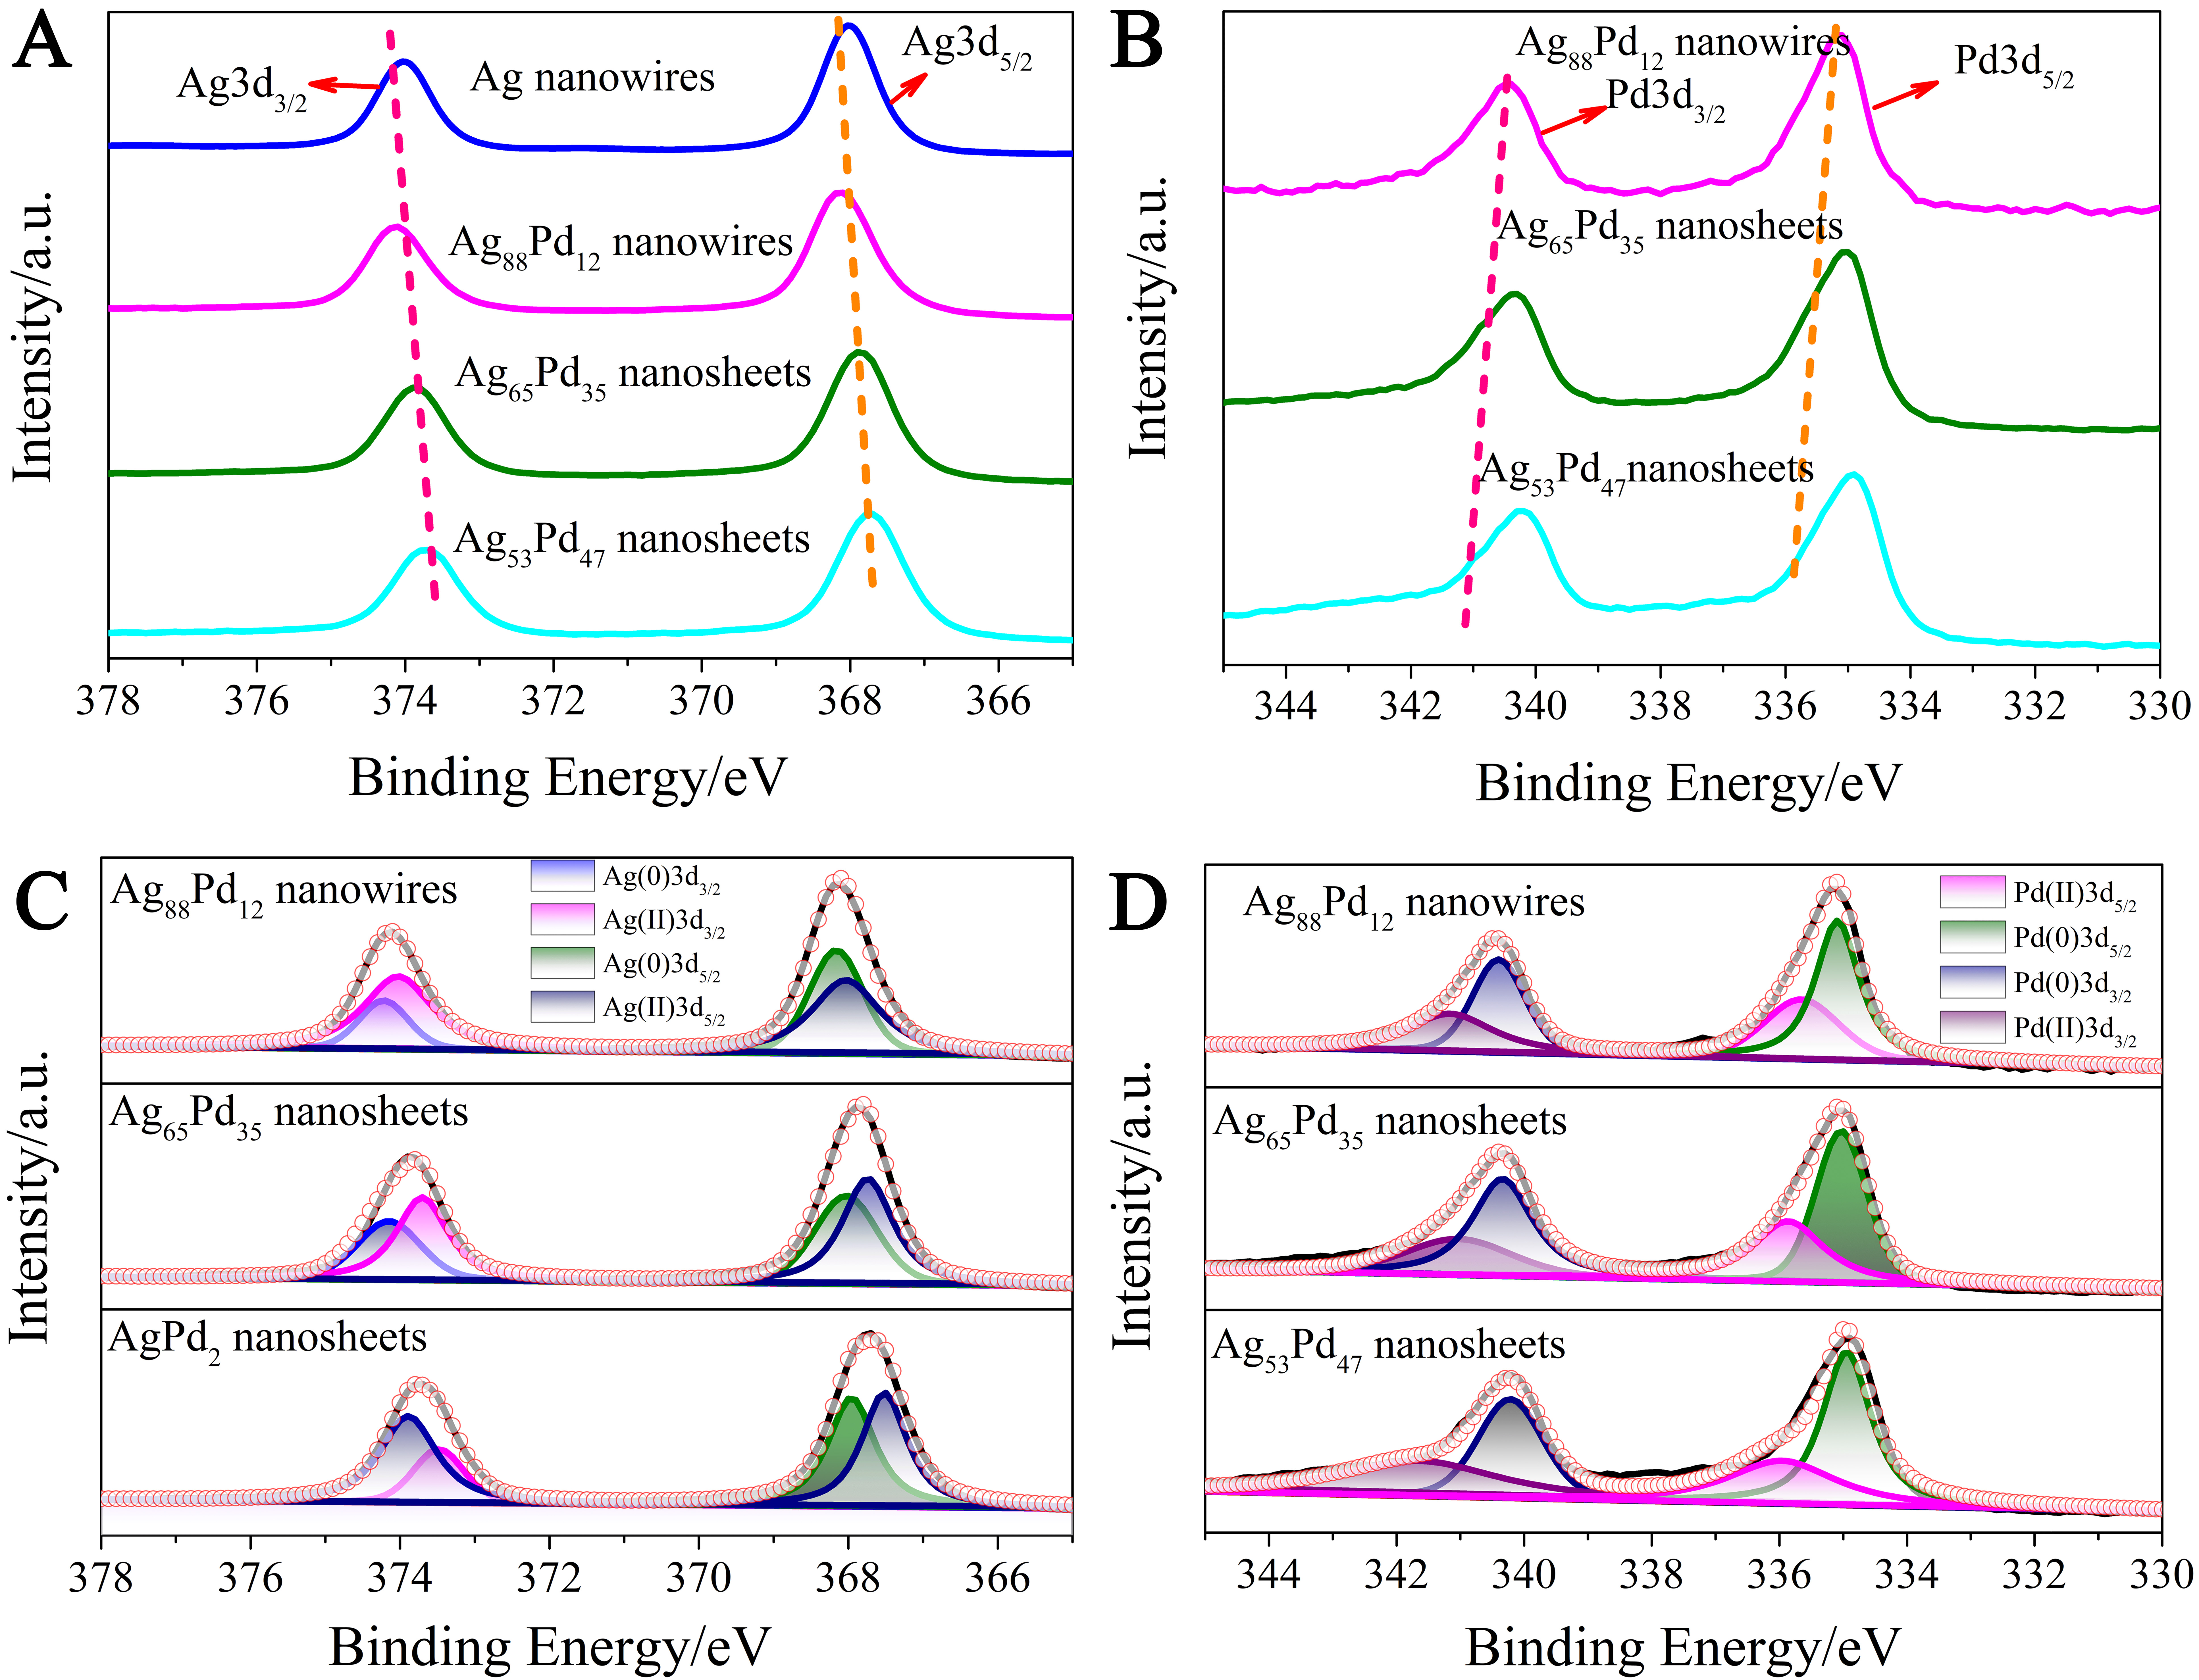
Figure 4. XPS spectra of pure AgNWs and AgPd nanomaterials with different alloying degrees for Ag3d3/2 and Ag3d5/2 (A) and Pd3d3/2 and Pd3d5/2 (B); XPS spectra after peak separation of Ag3d (C) and Pd3d (D) in AgPd nanomaterials; The red circle curve represents the fitted curve, which is in agreement with the original curve. AgNW: Silver nanowire; XPS: X-ray photoelectron spectroscopy.

