

fig8
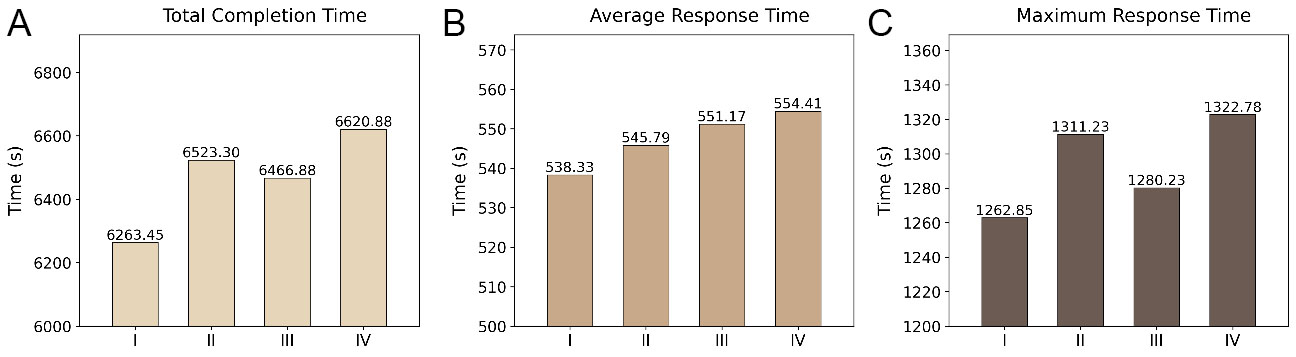
Figure 8. Time comparison of different ablation settings. (A) comparison of the total completion time under configurations I–IV, reflecting the overall efficiency of completing all emergency tasks; (B) comparison of the average response time, indicating the mean response efficiency across tasks; and (C) comparison of the maximum response time, representing the worst-case response delay.

