


Computer vision-based livestock weight measurement: principles, methods, and challenges
 0
0 Abstract
Livestock body weight is a critical indicator for optimizing feeding management, enabling precision nutrition, and supporting intelligent breeding. Traditional weighing methods, however, are often labor-intensive, inefficient, and may induce stress responses in animals, limiting their practicality in large-scale farming systems. In recent years, computer vision-based non-contact weight measurement has attracted increasing attention in smart animal husbandry due to its advantages in efficiency, non-invasiveness, and scalability. This review provides a comprehensive synthesis of recent progress in this field, with three primary contributions. First, it systematically summarizes state-of-the-art techniques for non-contact livestock weight measurement, covering data acquisition strategies, image preprocessing methods, and modeling approaches. Second, it presents a critical comparative analysis of existing methodologies, with particular emphasis on the performance characteristics and limitations of machine learning-based vs. deep learning (DL)-based models. Third, it highlights the growing significance of advanced three-dimensional (3D) reconstruction techniques, such as 3D Gaussian Splatting, in enhancing measurement accuracy and robustness. Finally, this review identifies persistent challenges, including variations in animal posture under dynamic conditions, environmental interference, and the scarcity of high-quality labeled datasets. Based on these insights, it outlines future research directions, emphasizing multi-source data fusion, the development of highly generalizable model architectures, and cross-modal DL frameworks, with the goal of building robust, adaptive, and scalable livestock weight measurement systems.
Keywords
1. INTRODUCTION
Body weight is a fundamental biometric in livestock production, with direct relevance to growth assessment, health monitoring, nutritional management, breeding selection, and marketing decisions[1]. Although body weight alone cannot fully reflect body reserves or nutritional condition, and is often complemented by body condition score (BCS), it remains one of the most practical and informative indicators in modern livestock farming[2,3].
Traditional gravimetric methods primarily rely on electronic scales or indirect estimation via manual morphometric measurements[4]. In industrial-scale operations, electronic scales are typically deployed in specialized weighing zones. While this approach yields highly accurate measurements, it remains labor-intensive and time-consuming, and is prone to inducing stress, which can disrupt normal animal behavioral patterns[5]. Computer vision (CV) has emerged as a non-contact alternative[6], enabling the automated extraction of visual features for weight estimation. In addition to CV-based and three-dimensional (3D) sensing technologies, other precision livestock management tools, such as electronic ear tags, have been increasingly applied to monitor animal identification, behavior, and physiological status, forming a foundational infrastructure for data-driven livestock systems[7]. Early studies demonstrated strong correlations between body weight and morphometric traits such as body length, chest girth, and height[8], providing a basis for image-based measurement.
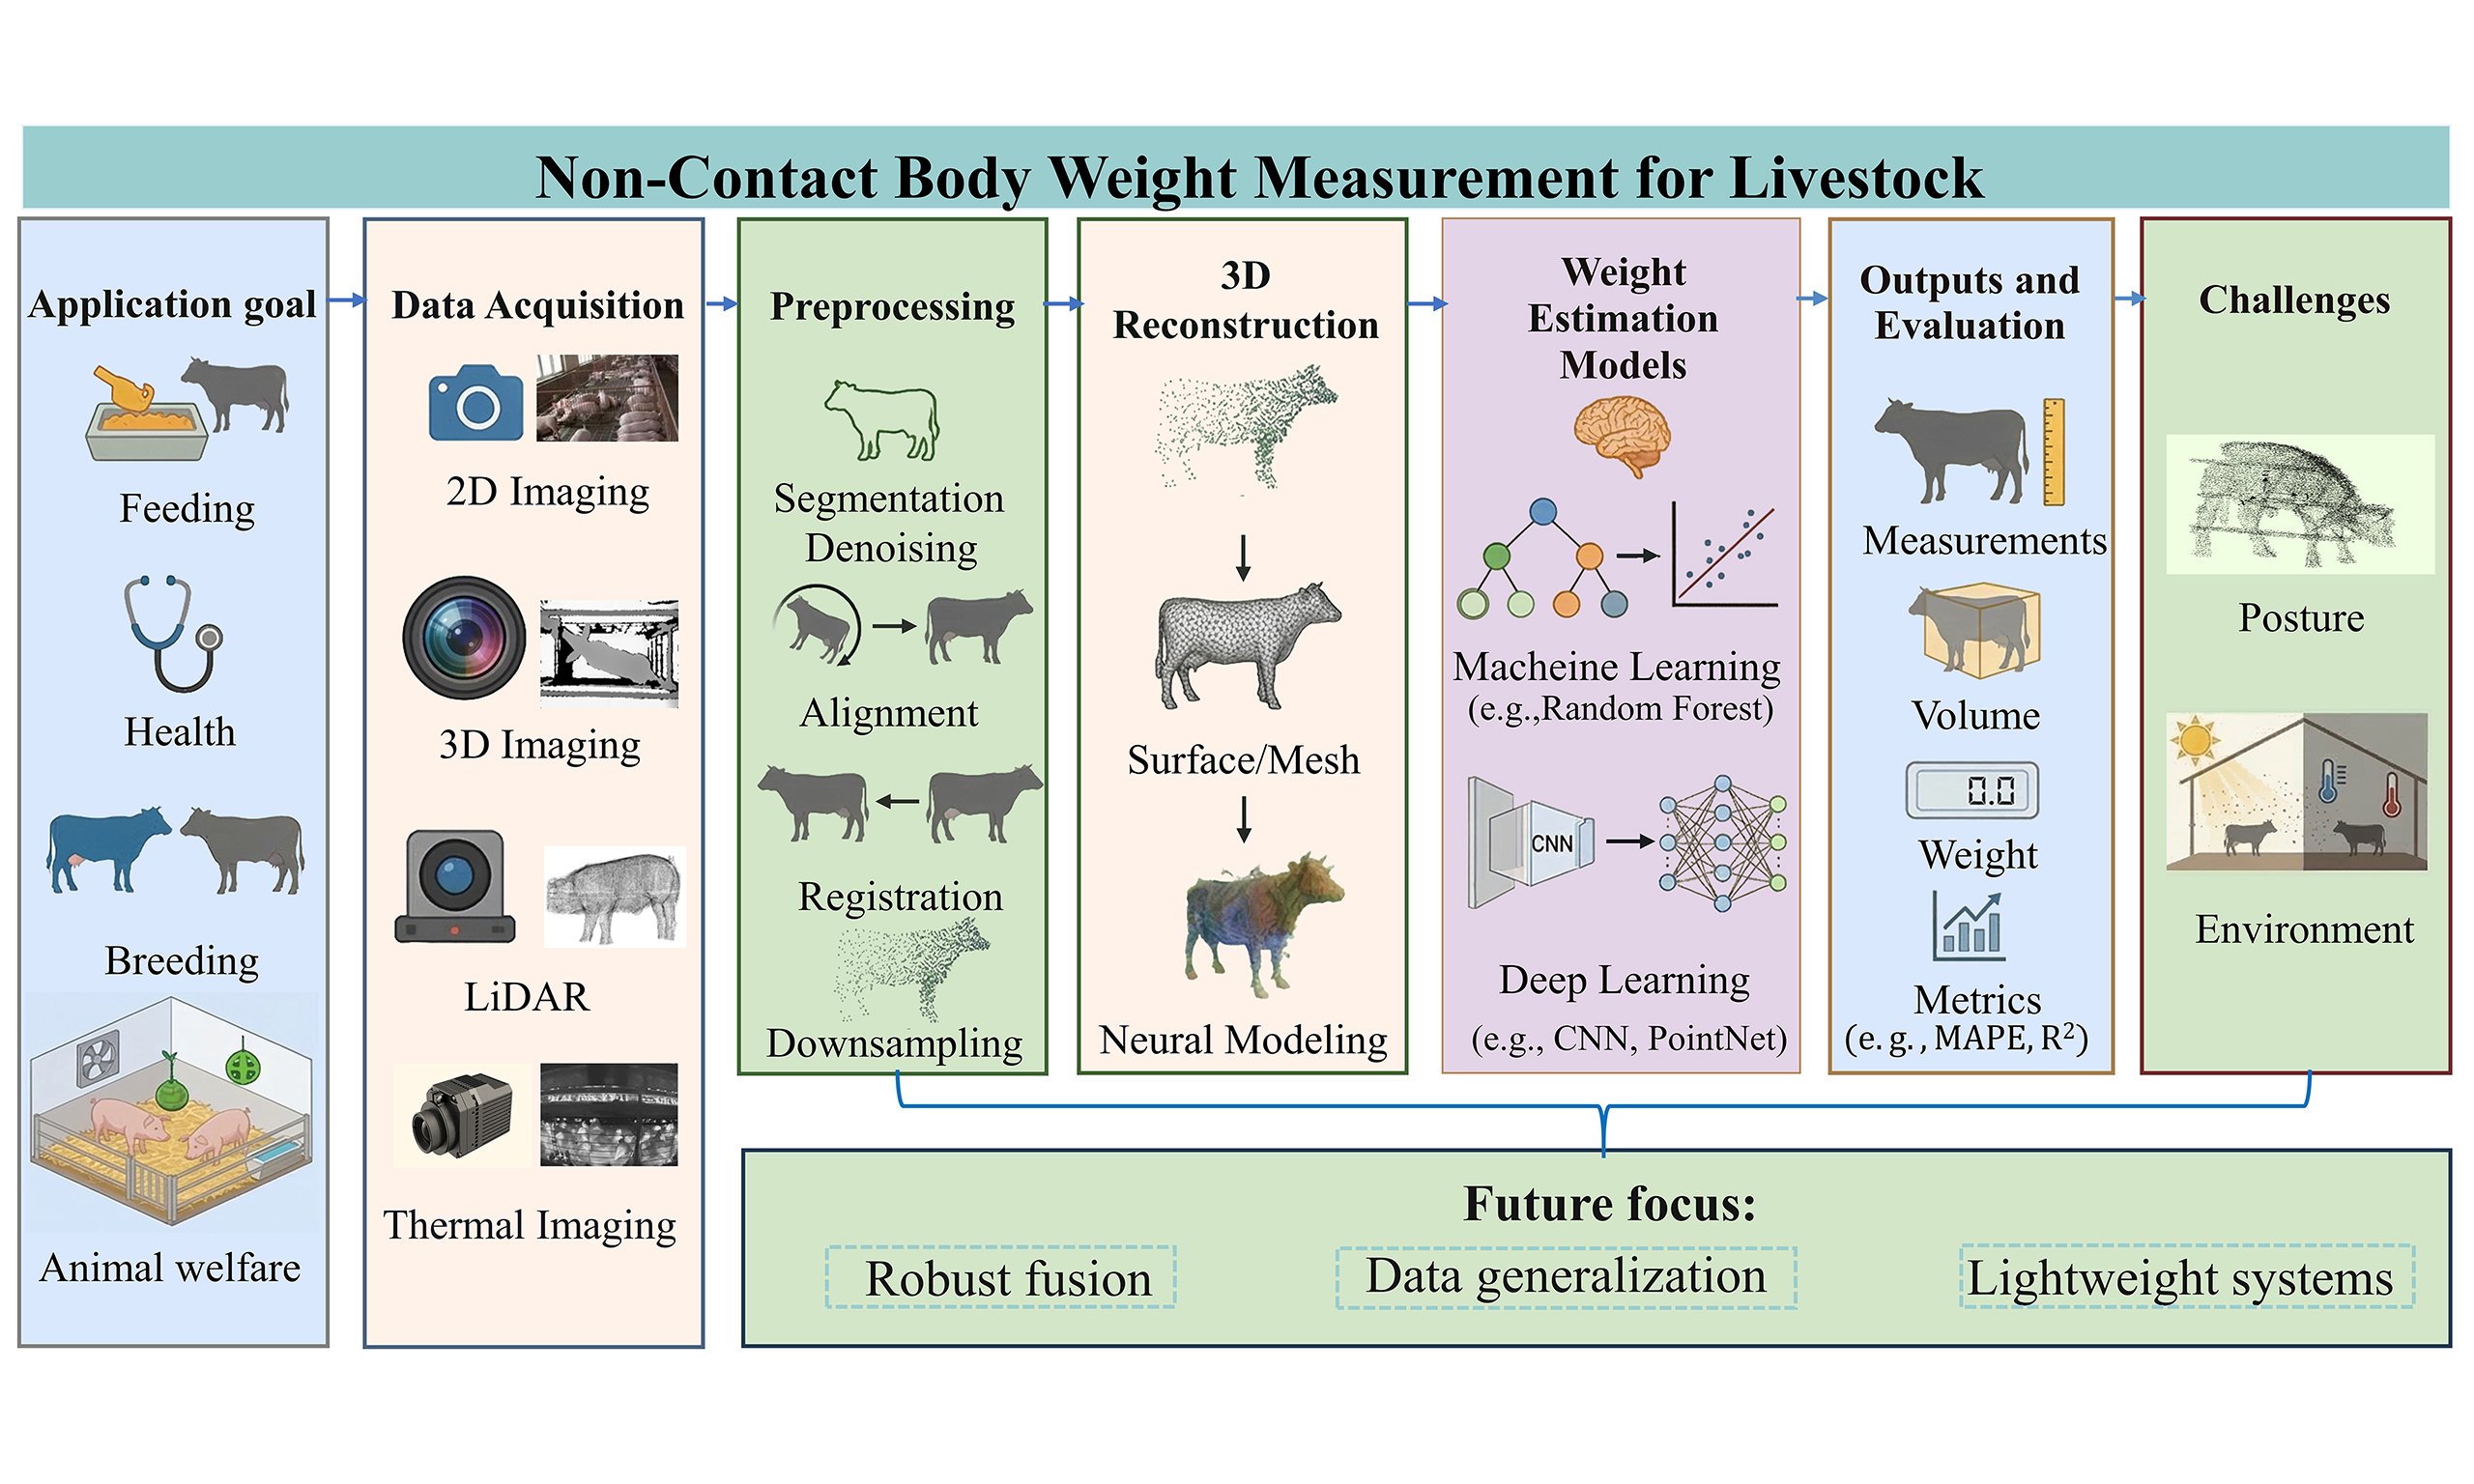
Several reviews have summarized progress in vision-based livestock weight estimation, but most focus on specific aspects such as image processing strategies[8], algorithmic comparisons[9], or pig-oriented applications. In contrast, this review provides an integrated perspective spanning data acquisition, preprocessing, 3D reconstruction, and predictive modeling, with particular attention to emerging 3D Gaussian Splatting (3DGS) techniques. Figure 1 presents the general workflow of vision-based livestock weight measurement[10]. The remainder of this paper is organized around acquisition methods, preprocessing and reconstruction, weight estimation models, evaluation metrics, and future challenges.
Figure 1. Conceptual workflow of non-contact livestock body weight measurement based on CV. The image data in the figure are adapted from Ref.[10] under a CC BY 4.0 license. CV: Computer vision; 3D: three-dimensional; RGB: red-green-blue; LiDAR: light detection and ranging; 2D: two-dimensional.
2. DATA ACQUISITION METHODS USING CV
Data acquisition directly affects the accuracy and robustness of livestock weight estimation. From the perspective of camera configuration, single-view systems are relatively simple and inexpensive, but their limited visual coverage may restrict measurement performance. Multi-view systems, by integrating information from multiple perspectives, provide a more comprehensive representation of body shape and generally achieve higher robustness and accuracy, although at increased hardware and deployment costs. To facilitate comparison, Table 1 summarizes the main characteristics, advantages, and limitations of representative sensor technologies.
Comparison of representative 2D and 3D imaging sensors
| Device | Image type | Working principle | Advantages | Limitations |
| 2D digital camera[11] | 2D planar image | Captures light through a lens to record 2D visual information of the scene | Low cost, high resolution, mature technology, and easy to operate | Cannot handle complex 3D scenes |
| ToF depth camera[12] | 3D point cloud/depth map | Measures the distance between the object and the camera using infrared light or laser, generating 3D point clouds or depth maps | Provides depth information; suitable for 3D modeling, gesture recognition, and similar applications | Susceptible to flying pixel artifacts at depth discontinuities |
| LiDAR[13] | Point cloud/distance data | Emits radio or laser pulses and detects the reflected signals to measure object distance and velocity | Suitable for long-range detection; unaffected by lighting conditions; functional under harsh weather conditions | Relatively high cost |
| Structured-light depth camera[14] | Depth image/3D point cloud | Projects a structured light pattern (e.g., stripes or grids) and analyzes pattern deformation to compute the 3D shape of the object | High accuracy and resolution; ideal for close-range 3D scanning and modeling | High cost and not suitable for long-range sensing |
| Stereo vision technology[15] | 2D images and depth maps | Uses dual-camera systems to simulate human binocular parallax, calculating depth through triangulation and stereo matching algorithms | Low implementation cost with robust ambient light adaptability | High computational complexity and limited baseline constrain measurement range |
2.1. Imaging technologies for data acquisition
In the context of livestock body weight measurement, both two-dimensional (2D) and 3D imaging technologies offer distinct advantages, each suited to specific applications.
2.1.1. 2D imaging technology
Historically, 2D imaging systems for livestock body weight estimation have predominantly relied on red-green-blue (RGB) cameras to capture livestock images from various perspectives, including overhead (top-view), lateral (side-view), and frontal views, depending on the target species and practical application requirements. This approach offers notable advantages, such as reduced computational demands and lower storage costs. However, the inherent limitation of 2D imaging lies in its inability to capture depth information, which restricts the accurate representation of 3D body morphology and limits its applicability in complex or unstructured environments[11].
2.1.2. 3D imaging technology
Compared with 2D imaging, 3D imaging provides both visual and geometric information for more accurate morphometric analysis and weight estimation[16]. In livestock systems, it can be achieved through two main approaches: active depth sensing, such as Time-of-Flight (ToF) and structured light, and image-based reconstruction, including stereo vision and structure-from-motion (SfM)[17]. Stereo vision derives depth from image disparity, whereas SfM reconstructs 3D structure and camera poses from multiple RGB images.
While these techniques perform well in many livestock settings, their performance may still be affected by environmental edge cases, including dark or wet/muddy body surfaces that may attenuate light detection and ranging (LiDAR) devices or infrared returns, as well as challenging lighting conditions such as strong outdoor sunlight and flickering indoor light-emitting diode (LED) illumination[18].
Structured light and ToF sensors possess complementary strengths, with the former excelling in static monitoring scenarios and the latter in dynamic monitoring applications[14]. In contrast, stereo vision can reliably derive 3D information in harsh environments, but its depth-matching accuracy is often hindered by fluctuating illumination conditions[15]. Given the dynamic nature of intelligent livestock measurement, ToF-based sensors - particularly the Kinect series - have become increasingly popular due to their rapid response times and adaptability. For instance, Condotta et al. utilized Kinect-derived depth maps and point clouds to compute porcine body volume as a proxy for weight measurement[19]. Moreover, the integration of hybrid RGB-depth (RGB-D) systems has further enhanced fidelity and system reliability, highlighting the combined potential of depth sensing and image-based 3D reconstruction approaches for precise volumetric measurement in modern livestock phenotyping.
To provide a thorough comparison of 2D and 3D imaging modalities, Figure 2 contrasts passive 2D imaging and representative 3D acquisition approaches, highlighting their sensing mechanisms and typical data outputs, including RGB images, depth maps, point clouds, and reconstructed point clouds.
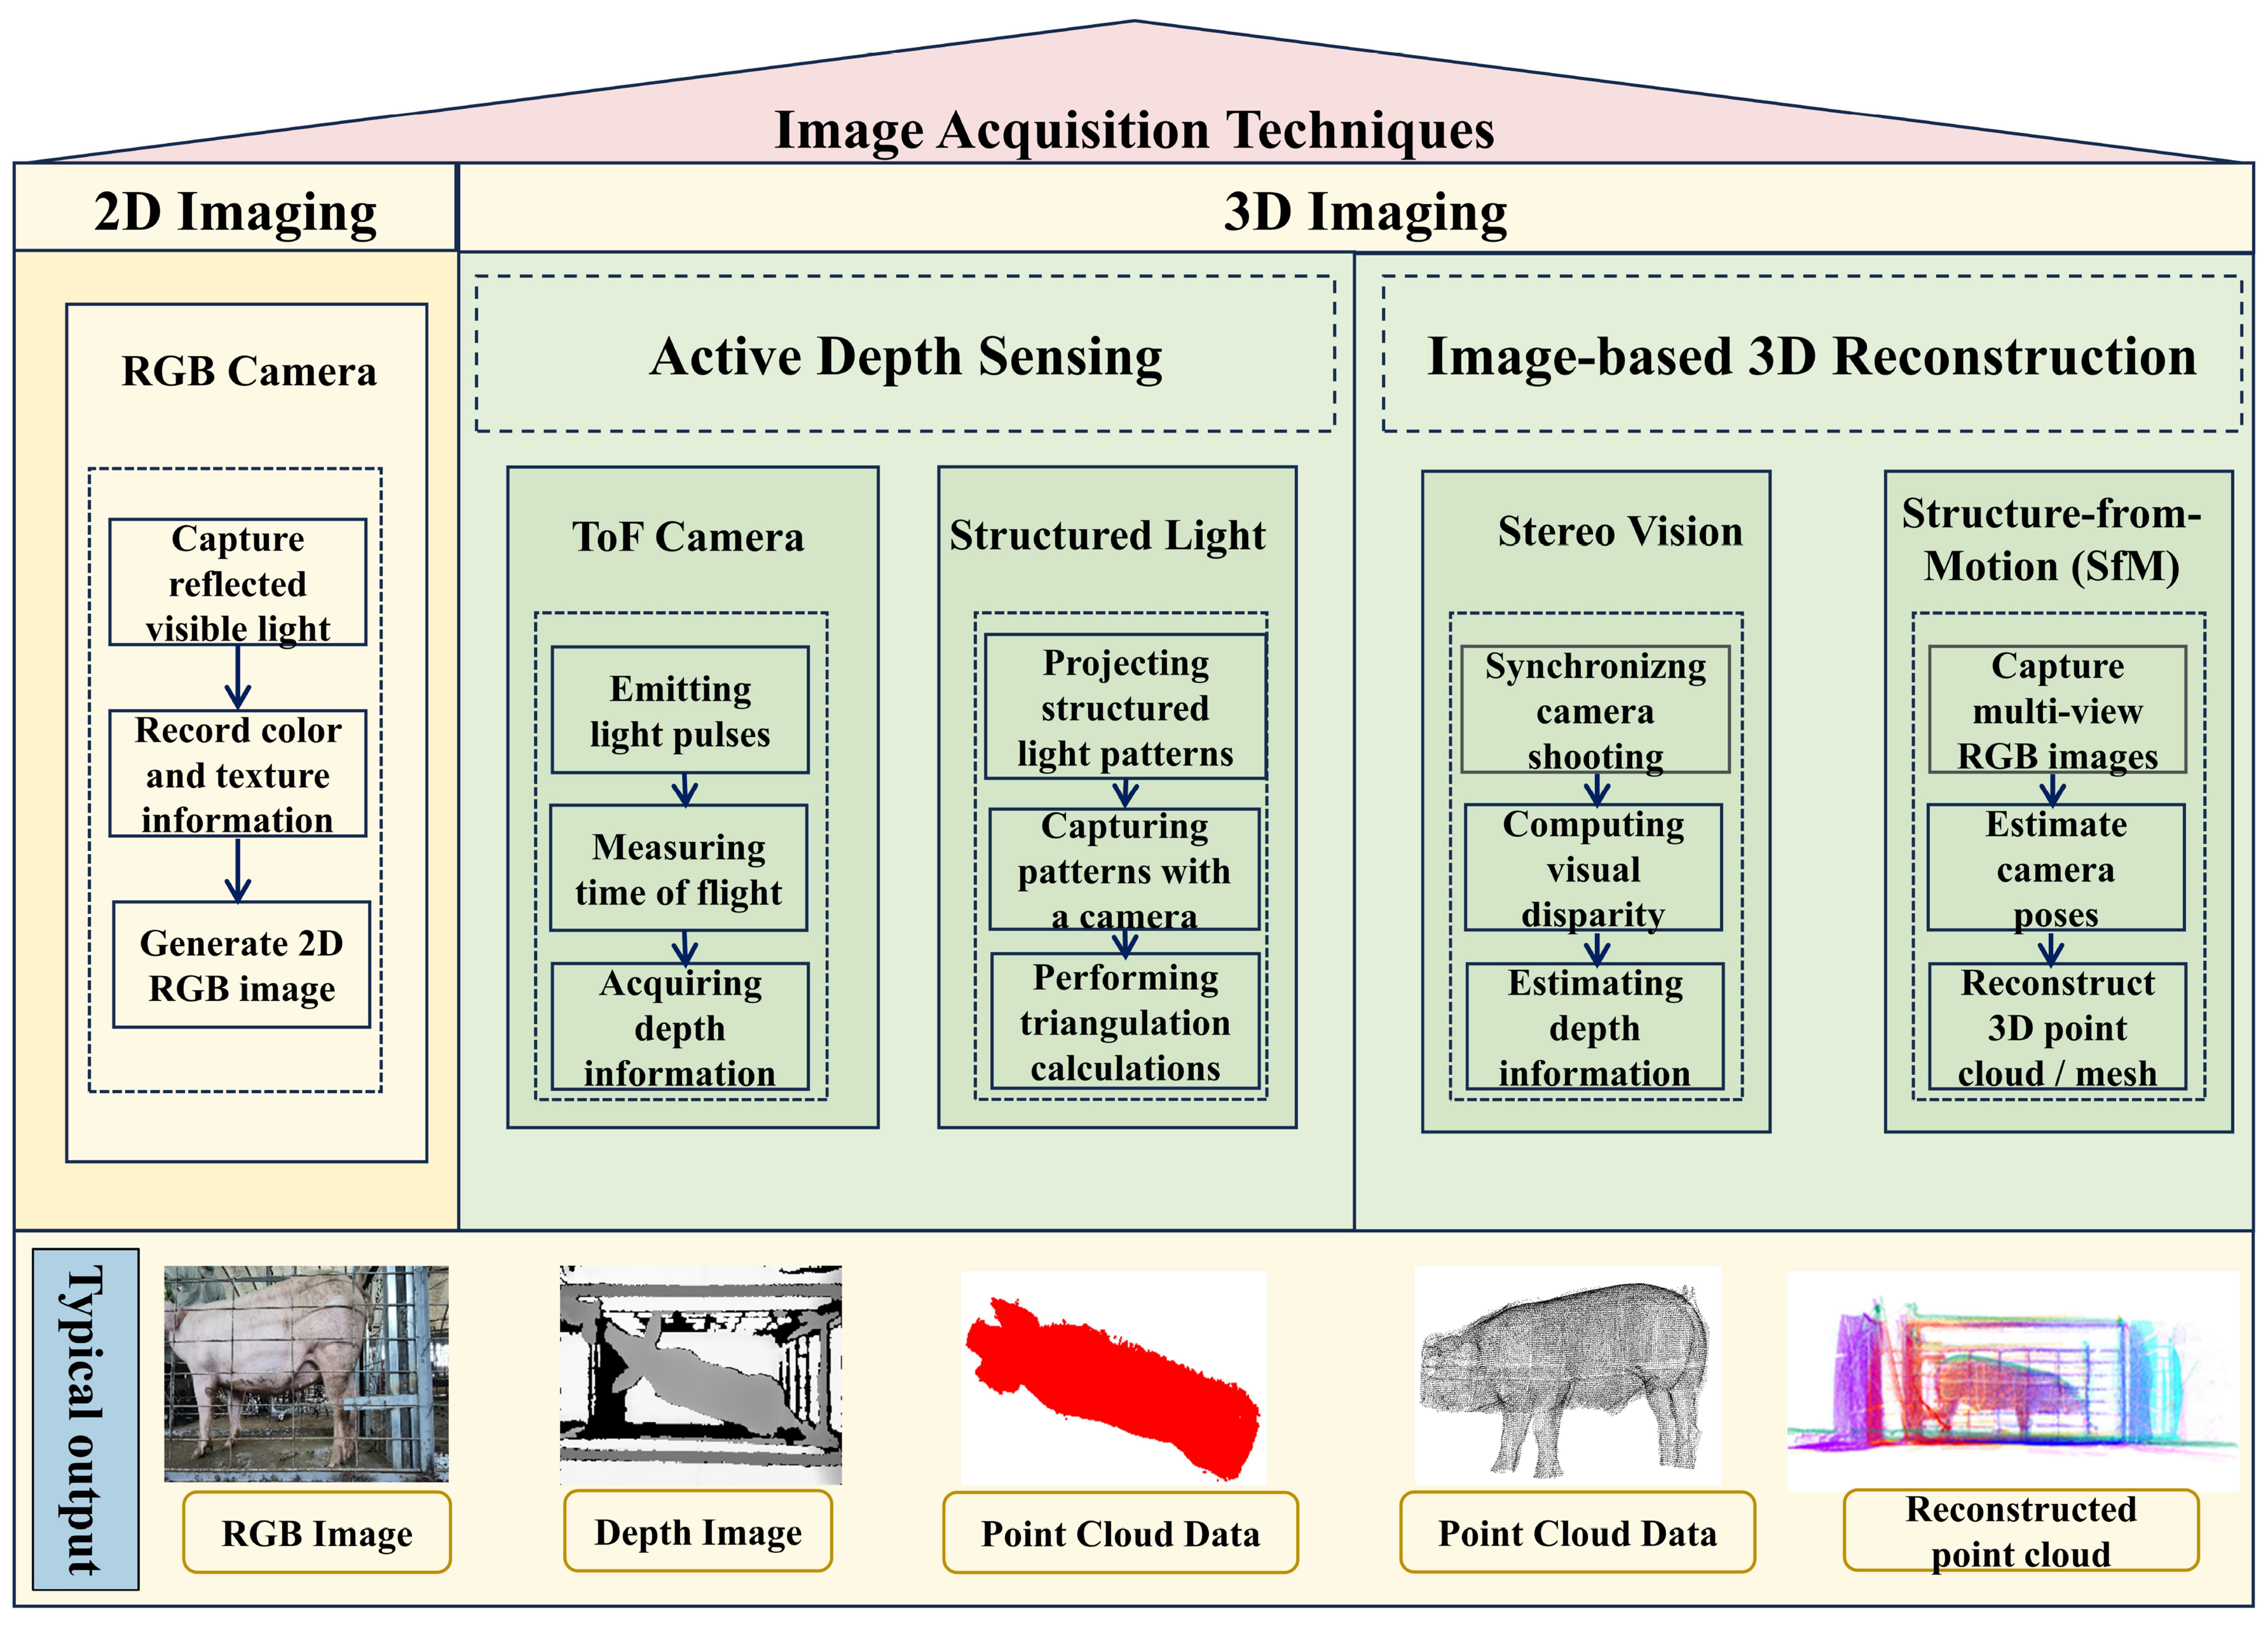
Figure 2. Technical principles and typical data outputs of representative 2D and 3D imaging technologies for livestock weight measurement. The figure was prepared by the authors. The typical output data were collected by the authors from Guojia Pig Farm, Longyao County, Xingtai City, Hebei Province, China. 2D: Two-dimensional; 3D: three-dimensional; RGB: red-green-blue; TOF: Time-of-Flight.
2.1.3. Ultrasonic acquisition technology
Ultrasound represents a novel, non-invasive data acquisition method primarily used to obtain intramuscular parameters in livestock. For instance, Ruchay et al. employed ultrasound to simultaneously measure eye muscle area and backfat thickness, while 3D optical devices were used to capture additional data, such as body height and chest girth[20]. The integrated dataset was then used in multivariate regression analysis to predict the live weight and carcass weight of Aberdeen Angus cattle. Compared to traditional body measurement methods, ultrasound provides deeper biological insights, and when combined with 3D spatial measurements, it allows for the construction of more precise weight prediction models. As such, multimodal data fusion, leveraging novel acquisition technologies, has emerged as a critical trend in livestock weight measurement research.
Finally, Table 2 summarizes representative data acquisition methods used in recent studies. This table facilitates a comparative analysis of their applicability and performance characteristics in different contexts.
Summary of livestock phenotypic data acquisition methods
| Author(s) | Acquisition device type | View mode | Data type | Target animal | Purpose (body measurements or weight) |
| Condotta et al.[19] | Depth camera | Single-view | Depth maps + 3D point clouds | Pigs | Body measurements |
| Pezzuolo et al.[21] | SfM (Structure from Motion) with RGB cameras | Multi-view | Reconstructed 3D mesh models | Pigs | Body weight |
| Kongsro[22] | Kinect sensor | Single-view | RGB-D images + point clouds | Pigs | Body weight |
| Ruchay et al.[20] | Fused ultrasound-optical system | Multi-view | Backfat thickness + 3D images | Angus cattle | Body weight |
| Marchant et al.[23] | Monocular RGB camera | Single-view | 2D images | Pigs | Body measurements |
| Kashiha et al.[24] | Overhead-mounted RGB camera | Single-view | 2D images + 3D images | Pigs | Body weight |
| Wu et al.[25] | Binocular stereo camera | Dual-view | 3D point clouds | Pigs | Body measurements |
| Shi et al.[26] | Multi-unit RGB-D cameras | Multi-view | RGB-D images + 3D point clouds | Pigs | Body measurements |
| Wu et al.[27] | RGB-D camera (visible + depth) | Multi-view | RGB images + depth maps → fused 3D point clouds/meshes | Cattle | Body measurements |
| Liu et al.[28] | Structured-light point cloud sensor | Single-view | Point clouds | Pigs | Body measurements |
2.2. Types of acquisition perspectives
In CV-based image acquisition, the selection of perspective is critical for the accuracy of weight measurement and the overall applicability of the method. Therefore, the choice of acquisition perspective must strike a balance between accuracy and cost, and should be tailored to the specific requirements of the application scenario to identify the most suitable technical solution.
2.2.1. Single-view acquisition
Single-view acquisition is simple and cost-effective, but limited visual coverage may reduce measurement robustness. It is commonly implemented with RGB or depth cameras in small- to medium-scale farming environments. Figure 3 presents a schematic diagram of a single-view acquisition system and its practical deployment in a farm setting.
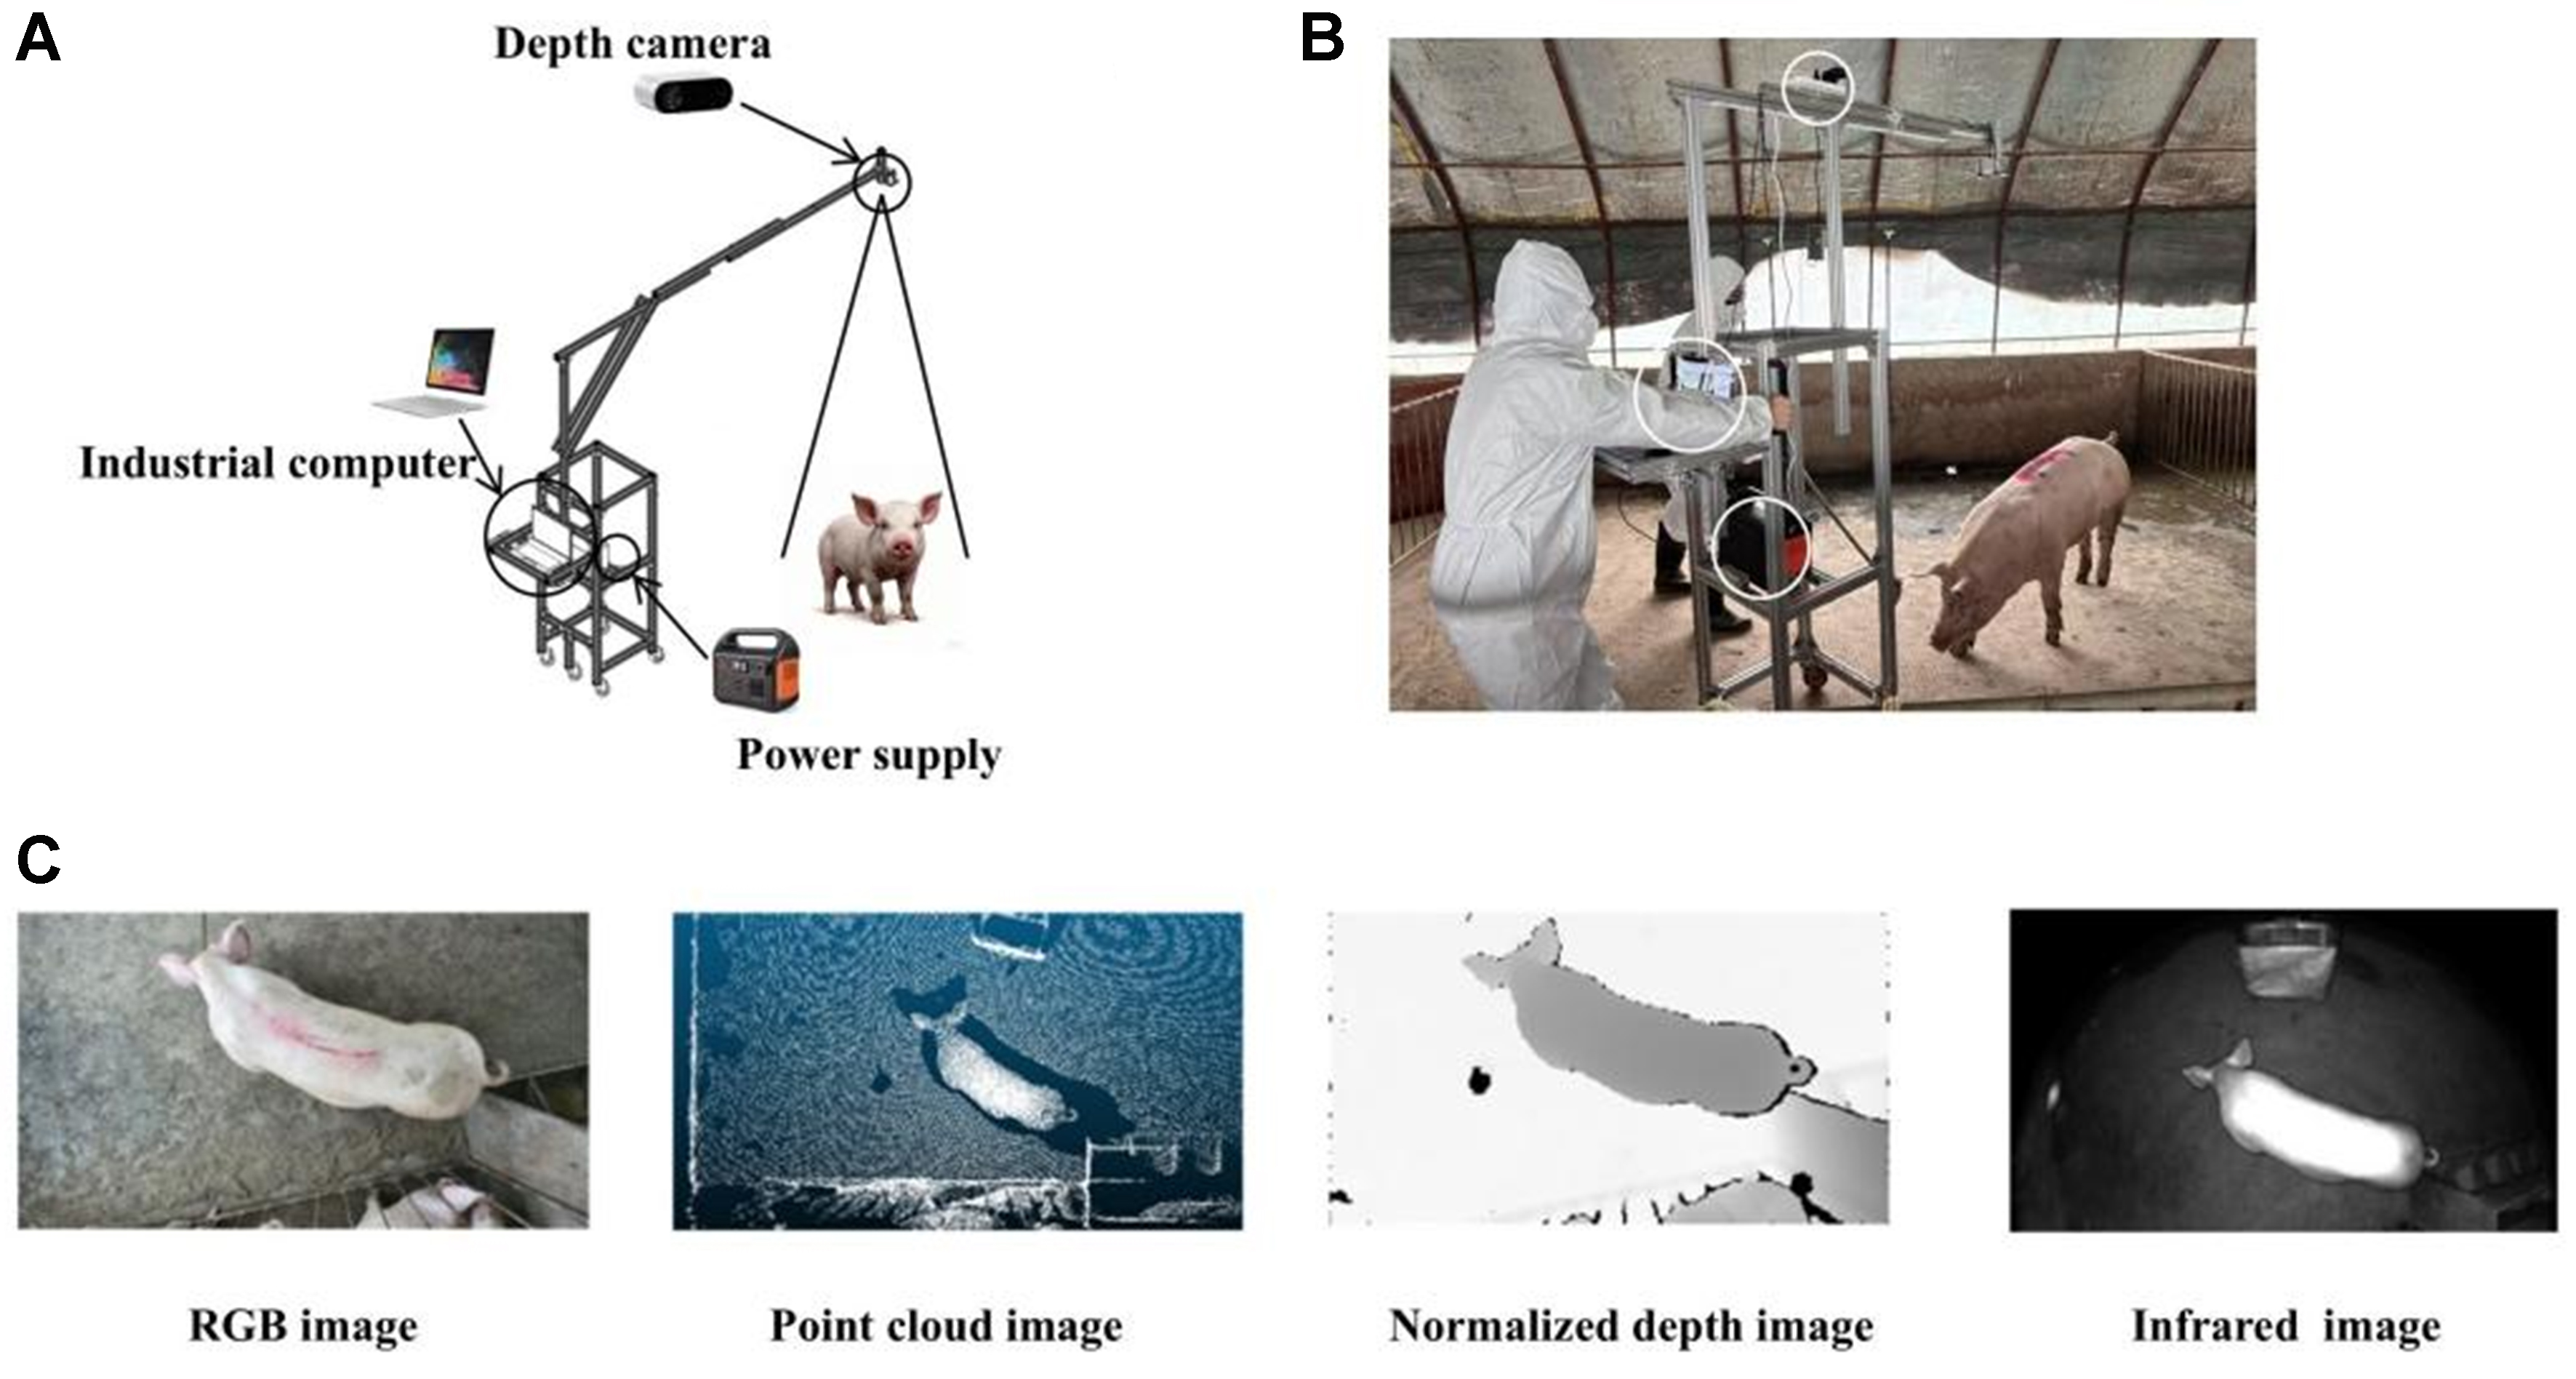
Figure 3. Schematic diagram and real-world deployment of the single-view image acquisition system. (A) System architecture diagram illustrating imaging devices, industrial control computer, mounting brackets, and power modules; (B) Deployment scenario of the equipment in a real-world farming environment; (C) Acquired multimodal image data, showcasing RGB images, point cloud images, normalized depth images, and infrared images. (A-C) is adapted from Ref.[29] under a CC BY 4.0 license. RGB: Red-green-blue.
Typically, a single-view monitoring setup consists of an overhead RGB camera - often mounted above feeding troughs - integrated with image processing software for real-time analysis[23]. For instance, Kashiha
2.2.2. Multi-view acquisition
Multi-view systems provide more complete body representations and generally improve robustness to posture variation and occlusion, although at higher hardware and computational costs. Figure 4 illustrates a gantry-style multi-view acquisition system designed for porcine monitoring, capable of capturing synchronized viewpoints. Multi-view data acquisition typically utilizes RGB-D sensors or LiDAR devices to capture dense spatial information. Early research by Wu et al. pioneered a stereo imaging system comprising six high-resolution cameras to capture lateral, dorsal, and posterior views of pigs, deriving depth through disparity mapping to reconstruct 3D silhouettes[25]. More recently, Wu et al. introduced a multi-view fusion framework for automatic full-posture measurement of cattle[27]. By integrating data from multiple viewpoints to generate a seamless 3D model, this method substantially enhances the robustness of body parameter extraction, providing high-quality inputs for downstream weight measurement.
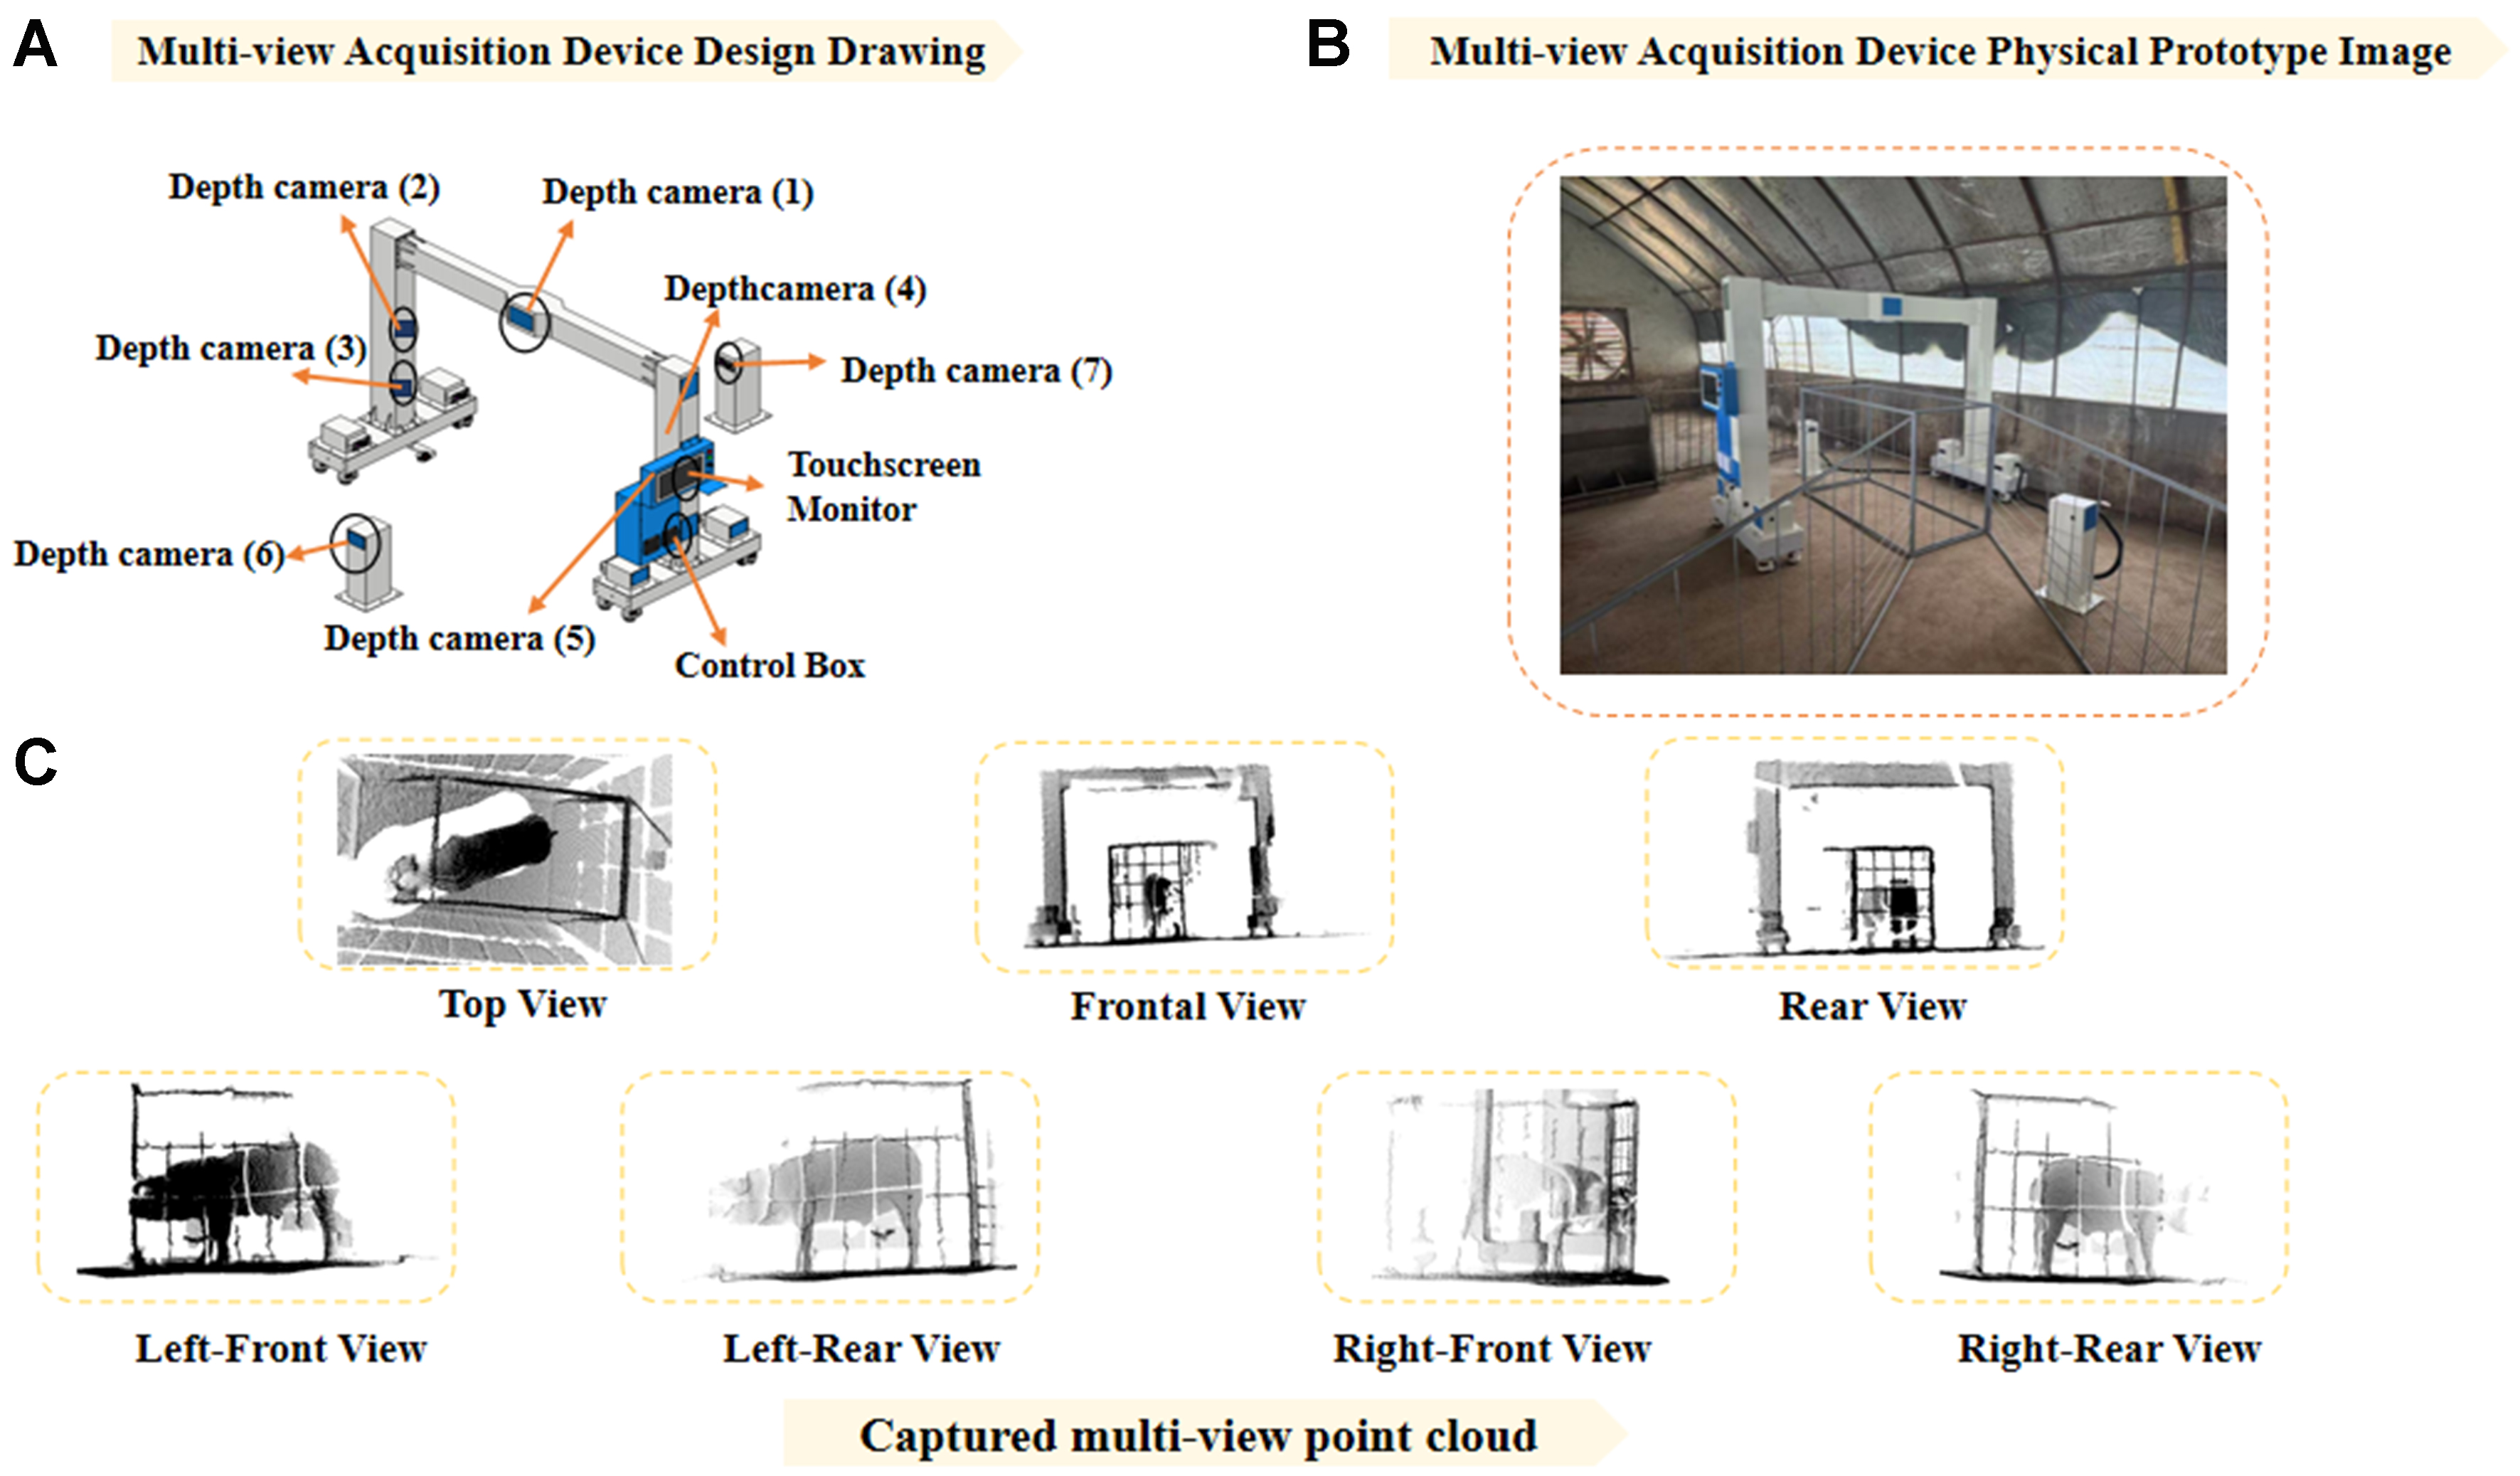
Figure 4. Multi-view 3D acquisition system: (A) Schematic diagram of the system architecture, consisting of seven depth cameras; (B) Deployment scenario of the system in a real-world livestock pen environment; (C) Point cloud images captured by the system from various perspectives: Top View, Frontal View, Rear View, Left-Front View, Left-Rear View, Right-Front View, and Right-Rear View. Figure 4 was collected by the authors. 3D: Three-dimensional.
LiDAR scanning technology, in particular, offers superior depth precision and resilience to ambient light interference, making it an ideal candidate for high-fidelity weight prediction. By deploying multiple LiDAR sensors at strategic locations, researchers can obtain high-resolution, 3D point clouds that accurately represent the animal’s full geometric profile. Xu et al. proposed a progressive hole-filling algorithm for point cloud restoration[31]. This approach effectively enhances the structural completeness of porcine models, thereby improving the accuracy of subsequent body modeling in complex environments.
2.3. Data cleaning and ground truth acquisition
Accurate ground-truth acquisition and annotation are essential for model training and validation. In practice, weighing is typically synchronized with image or point-cloud capture, and repeated measurements within controlled time windows are often used to reduce short-term fluctuations caused by feeding status or physiological variation. For image and 3D data, preprocessing mainly includes segmentation, keypoint localization, and body parameter extraction. Recent studies increasingly employ deep learning (DL)-assisted annotation and multi-view registration to improve the efficiency and consistency of 3D feature extraction[32].
2.4. Public and semi-public datasets and data availability
Several public and semi-public datasets are now available for livestock weight estimation, covering species such as pigs, cattle, sheep, and goats, and modalities including RGB, RGB-D, infrared, and 3D point clouds. Table 3 summarizes representative datasets, detailing species, sensing modalities, dataset scale, annotations, and availability. For example, pig datasets such as PIGRGB-Weight[29] and Pigs_weight[33] provide large-scale RGB or RGB-D images with weight labels, supporting both feature-engineered and DL pipelines. CowDatabase[18] provides RGB-D data and manual measurements for cattle, while multimodal sheep datasets on Kaggle[34] include RGB, depth, and infrared images across multiple views. In addition, pose/keypoint datasets[35] offer annotated landmarks for posture-aware preprocessing and two-stage pipelines, facilitating robust model development. Although these datasets improve reproducibility and benchmarking, most are limited in farm diversity and scale. Future research should focus on expanding dataset coverage, including richer metadata (e.g., weight range, posture, view), and establishing unified evaluation splits to enhance cross-study comparability.
Representative public or semi-public datasets for CV-based livestock weight estimation and related tasks
| Dataset | Species | Modalities | Dataset scale | Labels/annotations | Release date | Availability |
| PIGRGB-weight | Pig | RGB | Weight range: 33.1-192 kg (images annotated via filenames) | Live weight | April 2025 | Public (GitHub + shared download links) |
| Pigs_weight | Pig | RGB-D | 134,810 RGB-D pairs; 147 pigs | Live weight | December 2024 | Public via persistent DOI (Dataverse) |
| CowDatabase | Cattle (Hereford) | RGB-D/point cloud (derived) | 103 cattle | Live weight + manual body measurements (WH, HG, etc.) | December 2020 | Public (GitHub) |
| Sheep weight estimation dataset - multimodal | Sheep | RGB + depth + infrared | 6,608 groups; 4,650 sheep | Live weight | Last updated: 2026 | Public (Kaggle; login may be required) |
| Livestock-keypoint-detection | Cattle/horse/sheep | RGB | 2,229 images | 18 keypoints + visibility/occlusion | November 2025 | Public (GitHub) |
3. DATA PROCESSING METHODS
Data processing aims to improve input quality and reduce environmental interference before feature extraction and weight prediction. This section first reviews preprocessing methods for 2D images and 3D point clouds, and then discusses 3D reconstruction techniques for obtaining complete geometric representations of livestock.
3.1. Data preprocessing
Figure 5 illustrates the image and point cloud processing workflow for pig body weight measurement. The integrated preprocessing techniques ensure data consistency and quality, providing a solid foundation for accurate weight prediction and subsequent analytical modeling.
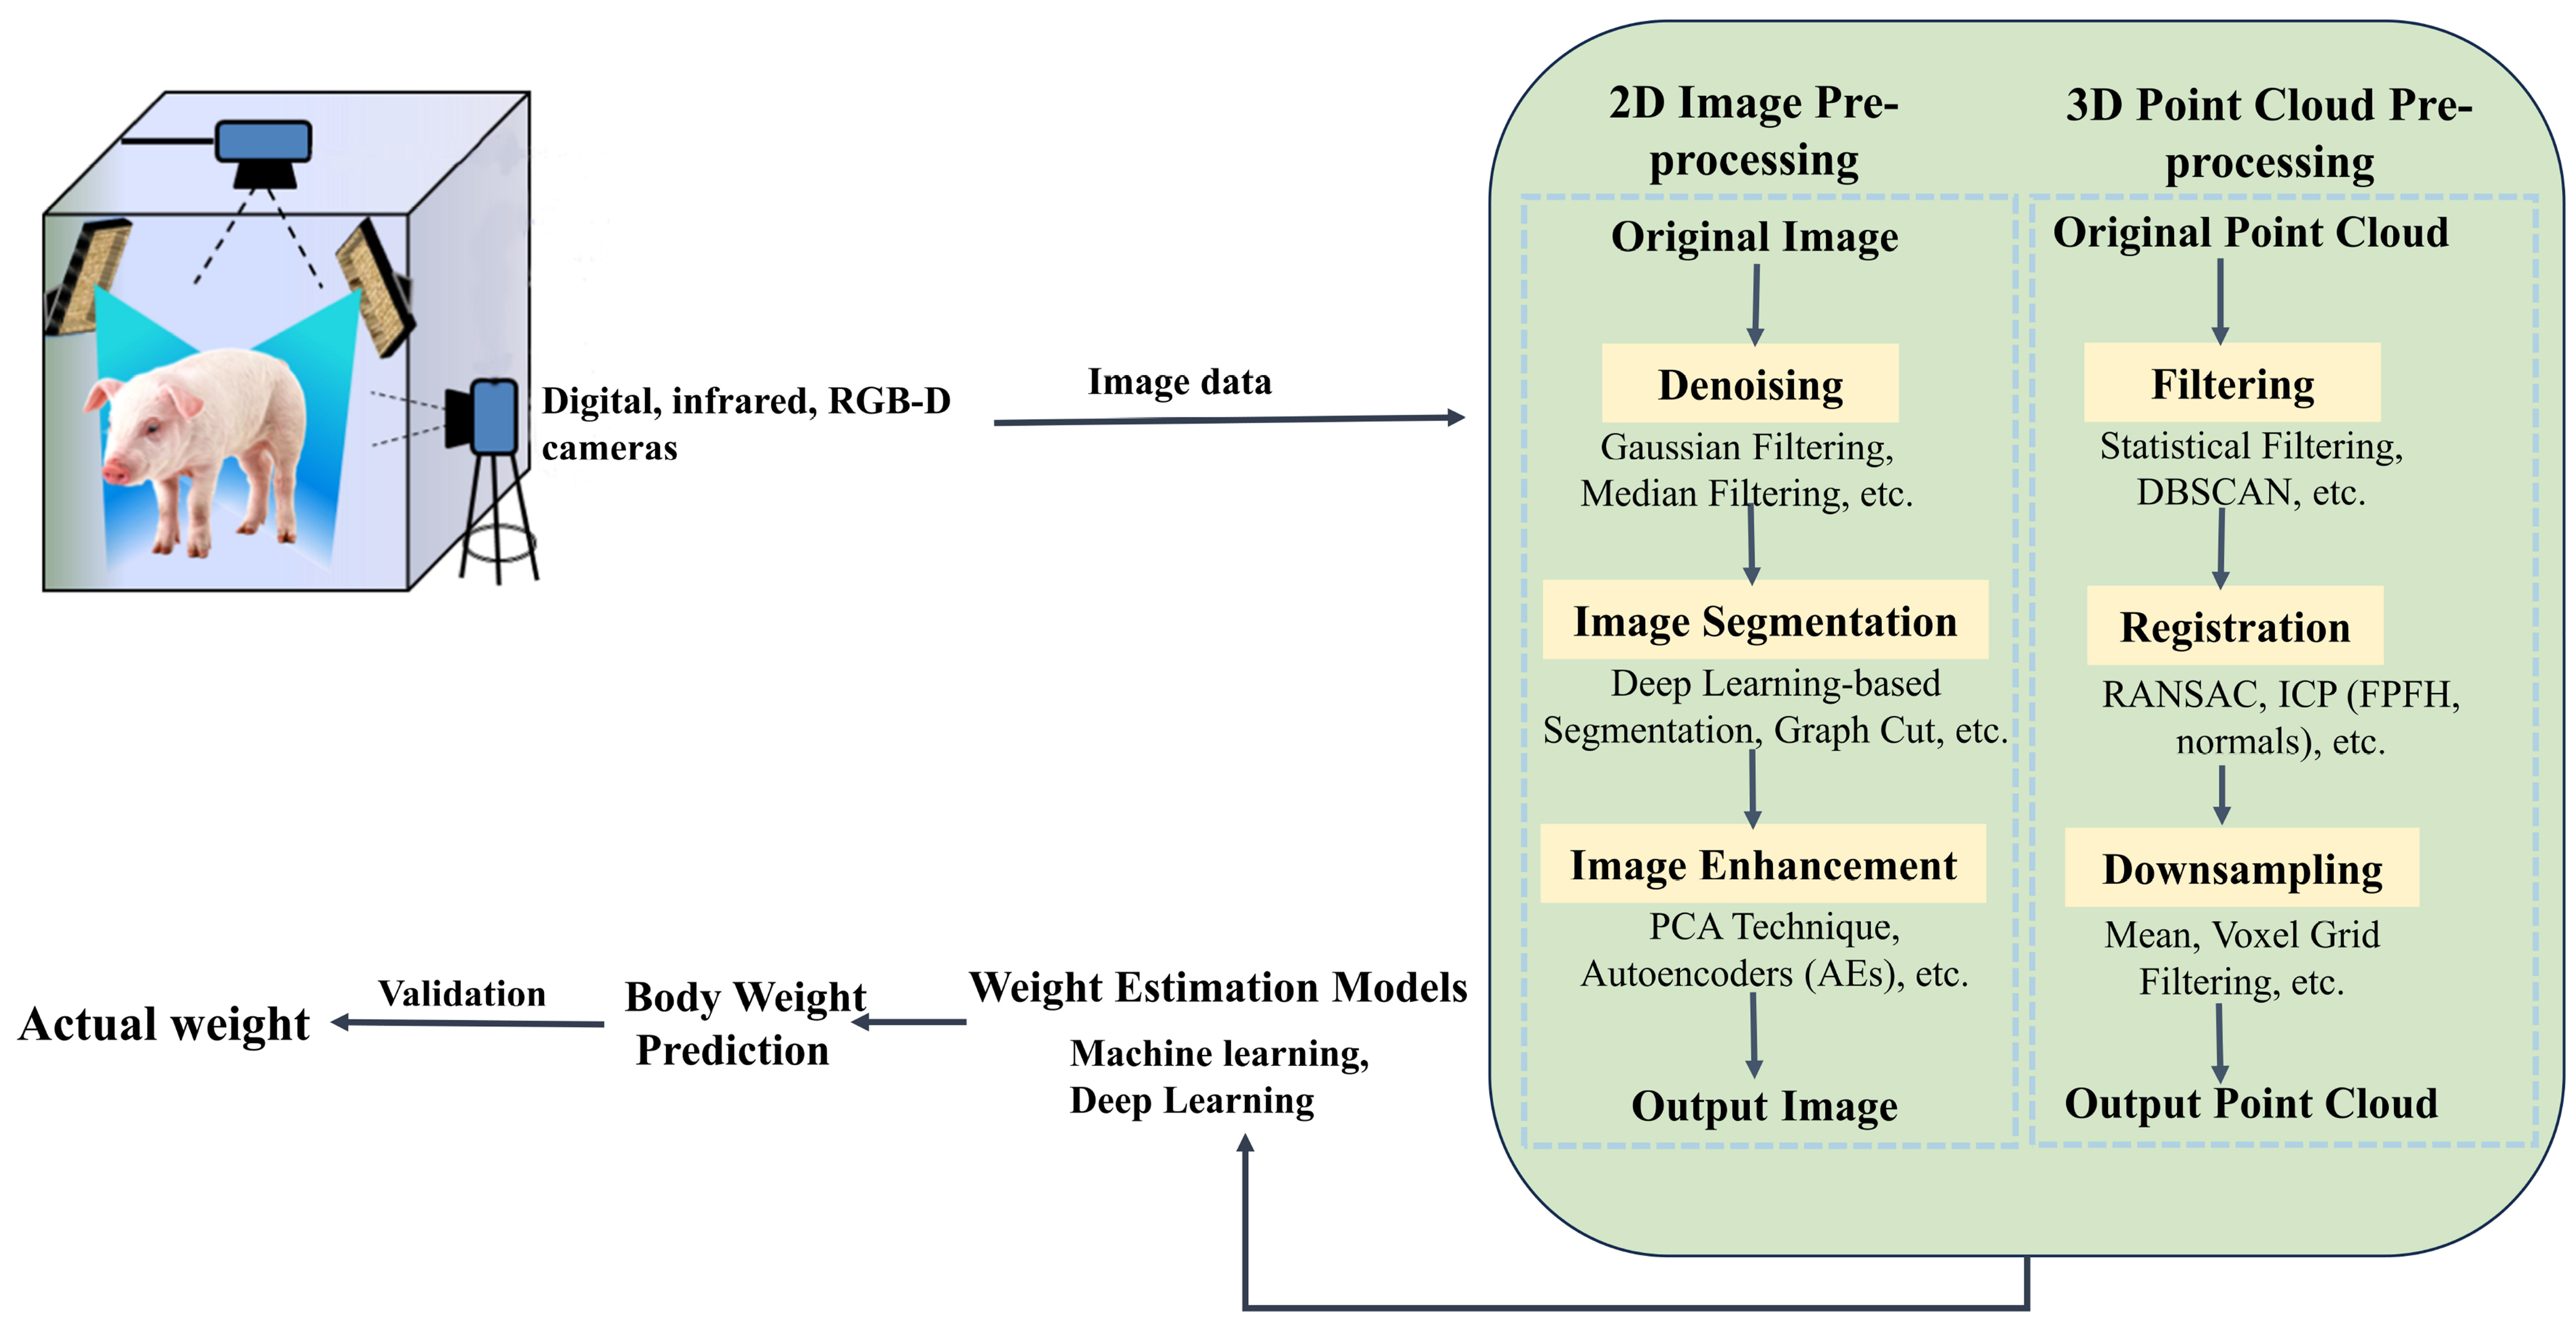
Figure 5. Schematic diagram of the image and point cloud processing workflow for pig body weight measurement. RGB-D: Red-green-blue-depth; 2D: two-dimensional; PCA: principal component analysis; 3D: three-dimensional; DBSCAN: density-based spatial clustering of applications with noise; RANSAC: random sample consensus; ICP: iterative closest point; FPFH: fast point feature histograms.
3.1.1. 2D image preprocessing
In livestock weight measurement, the quality of 2D imagery is crucial for the accuracy of downstream tasks such as individual identification and morphometric measurement. However, data acquisition is often affected by environmental fluctuations (e.g., lighting variations), sensor noise, and motion artifacts, all of which can compromise image integrity.
Furthermore, Wang et al. introduced a reference object during image preprocessing to serve as a scale benchmark[36]. Body measurements were extracted from digital images and incorporated into regression models for pig weight measurement. This approach effectively mitigates measurement errors caused by inconsistent image scales. It offers simplicity and low cost, making it particularly suitable for weight measurement in small-scale farming operations. For 2D livestock images, preprocessing mainly involves background segmentation and denoising to improve contour clarity and the reliability of subsequent morphometric feature extraction[37].
For keypoint detection in thermal infrared imagery, Han et al. enhanced YOLOv8n by integrating GSConv modules and attention mechanisms, demonstrating superior performance compared to conventional threshold-based segmentation methods[38]. This approach provides robust feature localization for livestock pose normalization. Given that variations in animal posture can significantly affect weight measurement accuracy, pose correction is often necessary. In image processing, principal component analysis (PCA)-based normalization is a commonly used method[39]. PCA is applied to extract the principal orientation of the animal contour, enabling standardized alignment and reducing errors caused by varying camera angles. However, in highly dynamic environments, the adaptability of 2D pose normalization remains limited, particularly in the presence of occlusions and substantial pose variations.
3.1.2. 3D point cloud preprocessing
3D point clouds provide richer morphological information than 2D images, but their quality is sensitive to noise, reflection, dust, and acquisition distance. Therefore, preprocessing typically includes denoising, pose normalization, registration, and downsampling to improve geometric consistency and computational efficiency. Denoising and filtering of 3D point cloud data primarily rely on DL-based segmentation techniques [e.g., mask region-based convolutional neural network (Mask R-CNN)], often complemented by traditional methods such as threshold segmentation and edge detection to improve accuracy. These techniques effectively eliminate irrelevant background information, thereby enhancing point cloud quality and providing high-quality data for subsequent 3D reconstruction and body conformation analysis. For example, in a study on point cloud-based pig weight measurement, Liu et al. proposed a hybrid 3D point cloud denoising method integrating statistical filtering and density-based spatial clustering of applications with noise (DBSCAN) clustering, which significantly reduced noise and improved measurement precision[40].
Pose correction for 3D point clouds is a crucial approach to addressing posture variations in complex environments, particularly under dynamic conditions. Normalization methods for 3D posture often maintain high accuracy and adaptability, including symmetry-based normalization and geometry-based pose adjustment techniques[41]. Lu et al. proposed a 2D/3D fused posture correction method that uses point cloud data captured by multiple RGB-D cameras, combined with a robust pose normalization strategy, significantly improving pose alignment stability and accuracy[42]. Another approach by Wang et al. introduced a rotation-based point cloud normalization technique to address posture-induced measurement errors in pigs[43]. This method standardizes point cloud orientation through rotation operations, overcoming the limitations of traditional approaches and enhancing the precision and stability of body measurement point extraction. More recently, this line of research has moved toward pose-normalized digital animal representations, in which reconstructed livestock bodies are not only geometrically aligned but also standardized to a neutral standing posture before downstream morphometric analysis. Compared with direct measurement on as-scanned postures, this strategy reduces inconsistencies caused by limb flexion, trunk curvature, and head-neck orientation, thereby improving cross-individual comparability[44].
Registration and downsampling techniques are also crucial for improving data quality and computational efficiency. Li et al. proposed an automatic method for acquiring 3D point clouds of beef cattle in complex environments[45]. By utilizing point cloud downsampling and multi-view registration techniques [such as iterative closest point (ICP), 4-point congruent sets (4PCS), and normal distributions transform (NDT)], high-precision 3D reconstruction was achieved, even under dynamic conditions. These technologies are advancing point cloud processing from static to dynamic scenes, providing a solid foundation for accurate and efficient weight measurement.
3.2. 3D reconstruction
3D reconstruction provides the geometric basis for volume estimation and weight modeling. Current approaches can be broadly divided into point cloud-based reconstruction and neural field/Gaussian-based modeling. The former relies on multi-view acquisition, registration, and surface reconstruction, whereas the latter aims to improve geometric completeness and rendering efficiency under challenging imaging conditions.
3.2.1. 3D point cloud reconstruction
3D point cloud reconstruction is a critical step in livestock weight measurement, aiming to recover the complete 3D geometric shape of animals from 2D images or raw depth data. This process enables the extraction of structural features necessary for subsequent weight prediction and volume measurement. The reconstruction process typically involves two main stages: multi-view point cloud acquisition and registration, followed by surface modeling based on the fused point cloud. Figure 6 illustrates the reconstruction and fusion pipeline, which includes preprocessing, multi-view point cloud acquisition, registration and fusion, and the final generation of a complete 3D point cloud model. In existing studies, Yin et al. utilized multiple depth cameras to capture pig bodies from different views and reconstructed 3D models through image registration and point cloud stitching[46]. Subsequently, Jin et al. proposed an automatic 3D body measurement method based on PointStack, using three depth cameras positioned on the left, right, and top sides of a goat[47]. Their multi-view acquisition strategy, combined with point cloud optimization, significantly improved modeling accuracy and completeness. Wang et al. introduced a method that fuses 2D semantic segmentation with depth information for 3D point cloud acquisition[48]. Using an RGB-D camera to capture pig images, the system employed a DL-based segmentation model to accurately isolate the pig region in 2D images, and then extracted the corresponding depth information to generate the 3D point cloud. This approach not only improved the accuracy and completeness of point cloud construction but also offered adaptability and cost-effectiveness for practical livestock farming scenarios.
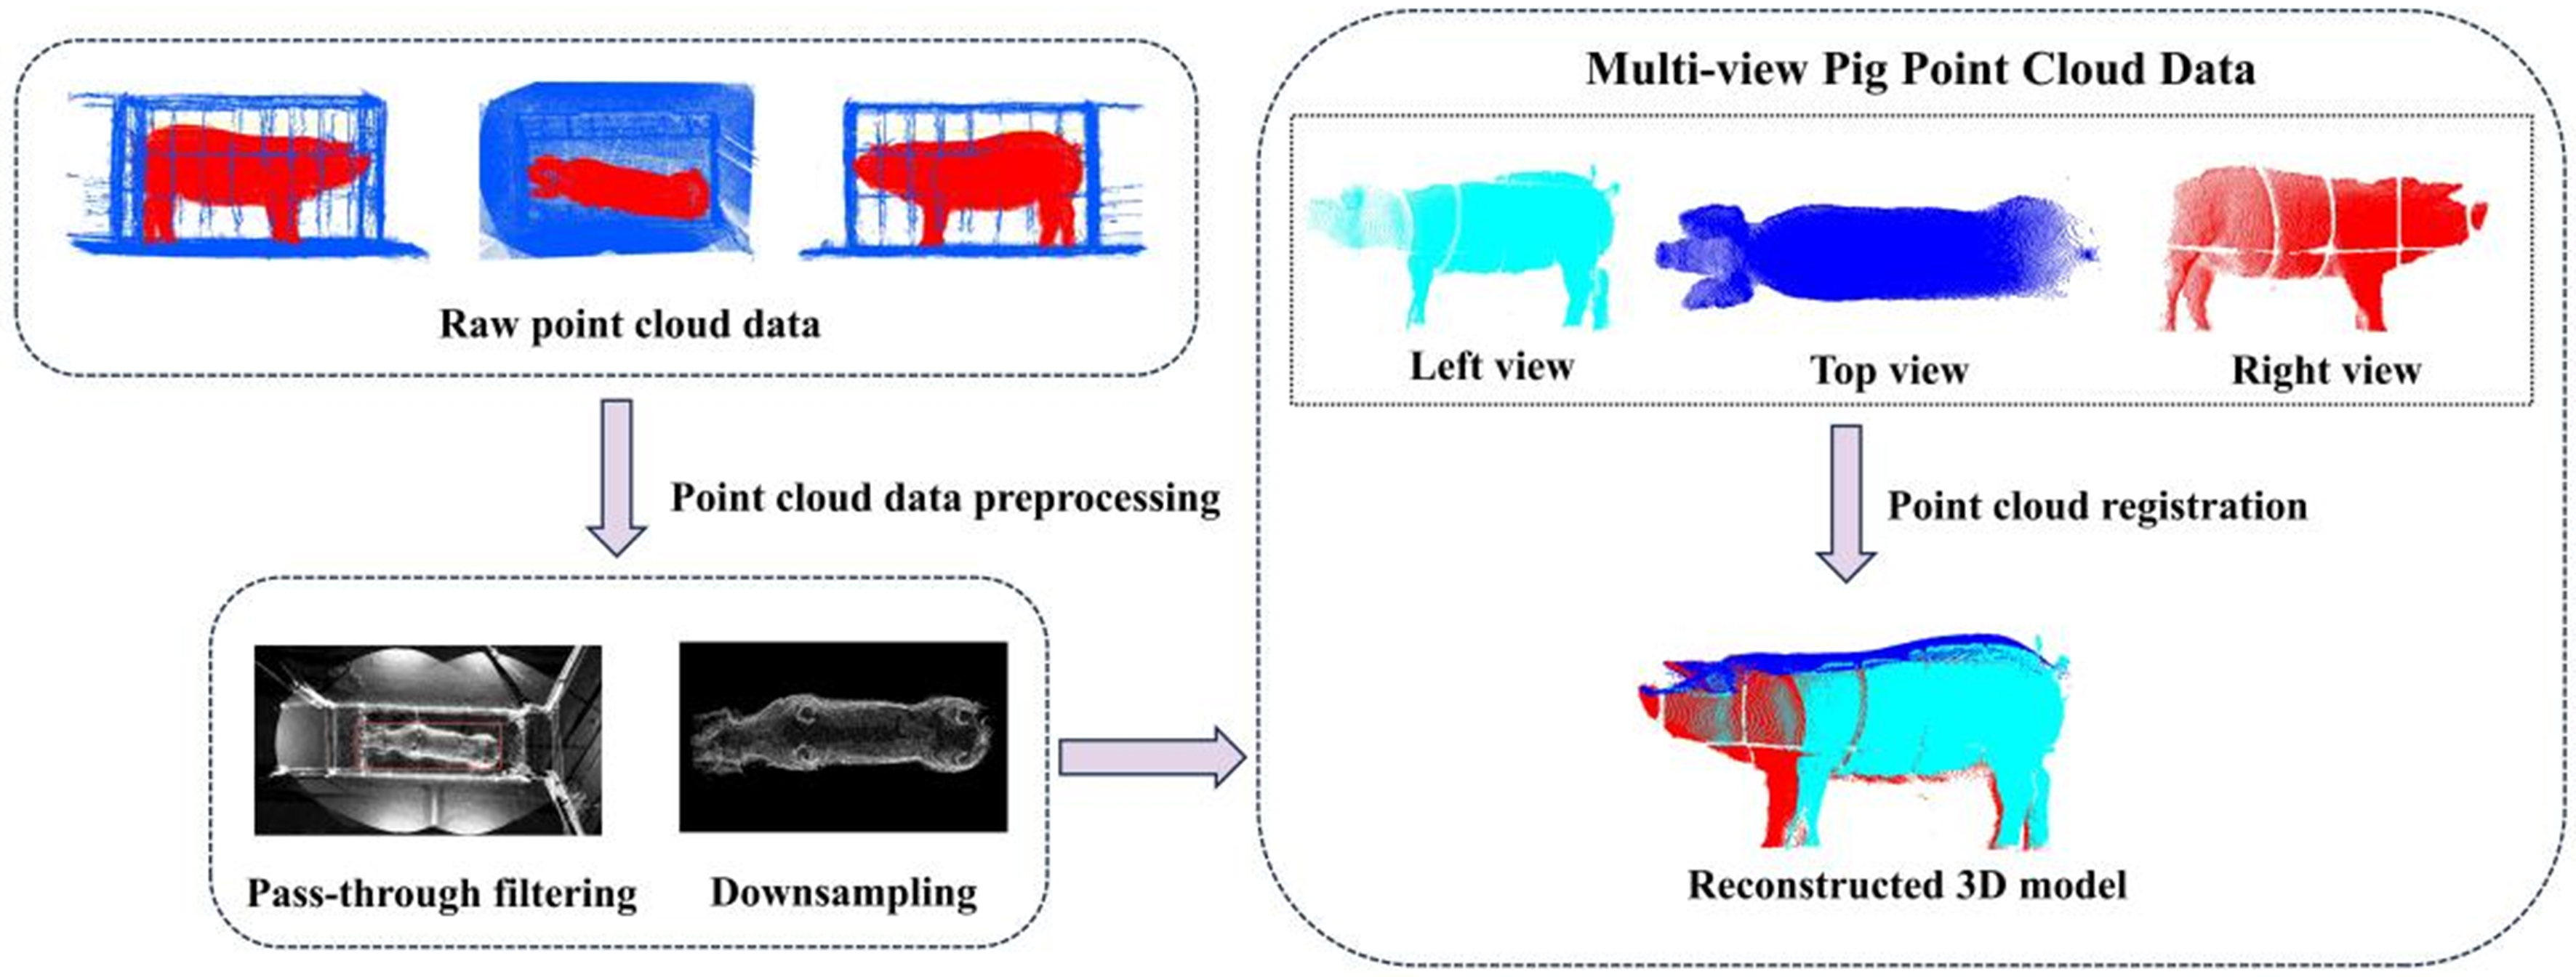
Figure 6. The 3D point cloud reconstruction process for pig morphology. Raw point cloud data from multiple views are first preprocessed using pass-through filtering and downsampling to remove noise and reduce data volume. Next, point clouds from the left, top, and right views are generated and color-coded. These multi-view point clouds are then aligned through registration to produce a reconstructed 3D model. The point cloud data shown in Figure 6 were collected by the authors at Guojia Pig Farm, Longyao County, Xingtai City, Hebei Province, China. 3D: Three-dimensional.
After multi-view point cloud fusion, further steps are necessary to construct a continuous 3D model suitable for volume measurement. This process involves converting sparse or irregular point cloud data into continuous surface or voxel-based representations. Common surface reconstruction methods include Poisson reconstruction[49], ball-pivoting algorithm (BPA)[50], and truncated signed distance function (TSDF)-based modeling[51], which differ in their assumptions on point density, topology, and noise robustness.
3.2.2. Neural field-based 3D modeling: NeRF and 3DGS
In livestock morphology modeling, traditional point cloud reconstruction and voxel-based methods have been widely used for estimating body features, but they are often limited by the sparsity of point cloud data and inaccuracies in alignment. Recently, neural rendering techniques have emerged as a promising alternative for image-based 3D reconstruction, among which neural radiance fields (NeRF) and 3DGS are two representative approaches.
NeRF, proposed by Mildenhall et al., learns an implicit scene representation from multi-view RGB images and enables photorealistic rendering and geometric reconstruction from arbitrary viewpoints[52]. Unlike conventional methods that rely on depth sensors or structured-light systems, NeRF can reconstruct 3D geometry directly from standard images, making it a non-contact and potentially low-cost solution for livestock modeling. Under dense-view conditions, NeRF has shown strong performance in recovering object geometry and volume[52], which may improve the reliability of body weight prediction.
Compared with NeRF, 3DGS provides a more efficient scene representation by modeling a scene with a set of Gaussian primitives, thereby improving rendering speed while maintaining good geometric fidelity[53]. The complete reconstruction pipeline of 3DGS involves multi-view image input, Gaussian initialization, visibility-aware rendering, and pose and camera parameter optimization[53]. Recent studies have shown that Gaussian-based methods can support visual alignment, 3D reconstruction, and pose estimation in challenging scenes[54]. These properties suggest that 3DGS has considerable potential for livestock morphology modeling, particularly when point cloud observations are incomplete or view overlap is limited.
However, despite their promising modeling capability, both NeRF and 3DGS still face challenges related to computational cost, dependence on training data, and limited cross-scene generalization. Therefore, future work should focus on adapting these methods to livestock-specific scenarios and integrating them with lightweight models to better balance reconstruction accuracy and real-time performance in body weight estimation.
4. WEIGHT MEASUREMENT METHODS
Non-contact body weight measurement in livestock production has progressed from manual, experience-based estimation and sparse morphometric sampling toward data-driven, automated sensing-inference pipelines. Broadly, existing approaches can be organized into two lines: feature-engineered methods that map handcrafted descriptors to body weight through regression, and DL methods that learn representations directly from raw data for end-to-end or two-stage prediction.
4.1. Feature-engineered methods with machine learning
Machine learning (ML) approaches generally follow a modular pipeline in which engineered morphometric or volumetric features are extracted from 2D images or 3D point clouds and then mapped to body weight using regression models. These methods are generally interpretable and computationally efficient, but their performance depends heavily on the reliability of feature extraction. Accordingly, this subsection reviews two key components of feature-engineered pipelines: handcrafted feature construction and regression-based weight prediction.
4.1.1. Handcrafted feature construction
Engineered features extracted from 2D images commonly include body length, width proxies, projected area, and girth-related measurements. These descriptors are efficient and interpretable but remain sensitive to scale ambiguity, posture variation, and occlusion. In 3D settings, volume- and surface-based descriptors provide a more direct representation of body morphology and are frequently combined with additional morphometric indicators in multivariate regression models.
Although volume is an informative predictor, its mapping to body weight may be biased by inter-individual differences in body composition and physiological state. Therefore, recent studies often combine volume with additional morphometric indicators in multivariate models[20,55]. Common volume measurement methods typically rely on acquiring 3D point cloud data of livestock using depth cameras (such as RGB-D cameras or LiDAR) or multi-view image reconstruction techniques. These methods are followed by building 3D models from point clouds for volume computation. Nguyen et al. proposed a rapid pig weight assessment method using a handheld mobile RGB-D camera[55]. This approach extracts morphometric features (such as projected area, body width, and estimated volume) from point cloud data and constructs a weight prediction model. The system offers portability, high data acquisition efficiency, and satisfactory measurement accuracy, making it suitable for routine weight monitoring in farming operations.
4.1.2. Regression models for weight prediction
Once engineered features have been extracted, regression models are used to map these features to body weight[56]. In livestock weight estimation, these models can be broadly grouped into linear and nonlinear regression methods.
4.1.2.1. Linear regression-based methods
Linear regression is widely used in livestock weight estimation because of its simplicity, interpretability, and low computational cost. It clearly demonstrates the influence of each independent variable on body weight through regression coefficients. It also offers fast training and prediction on large datasets and is well-suited to scenarios where the relationship between features and body weight is approximately linear. Figure 7 summarizes a typical pipeline of image acquisition, feature extraction, and linear regression-based weight prediction.
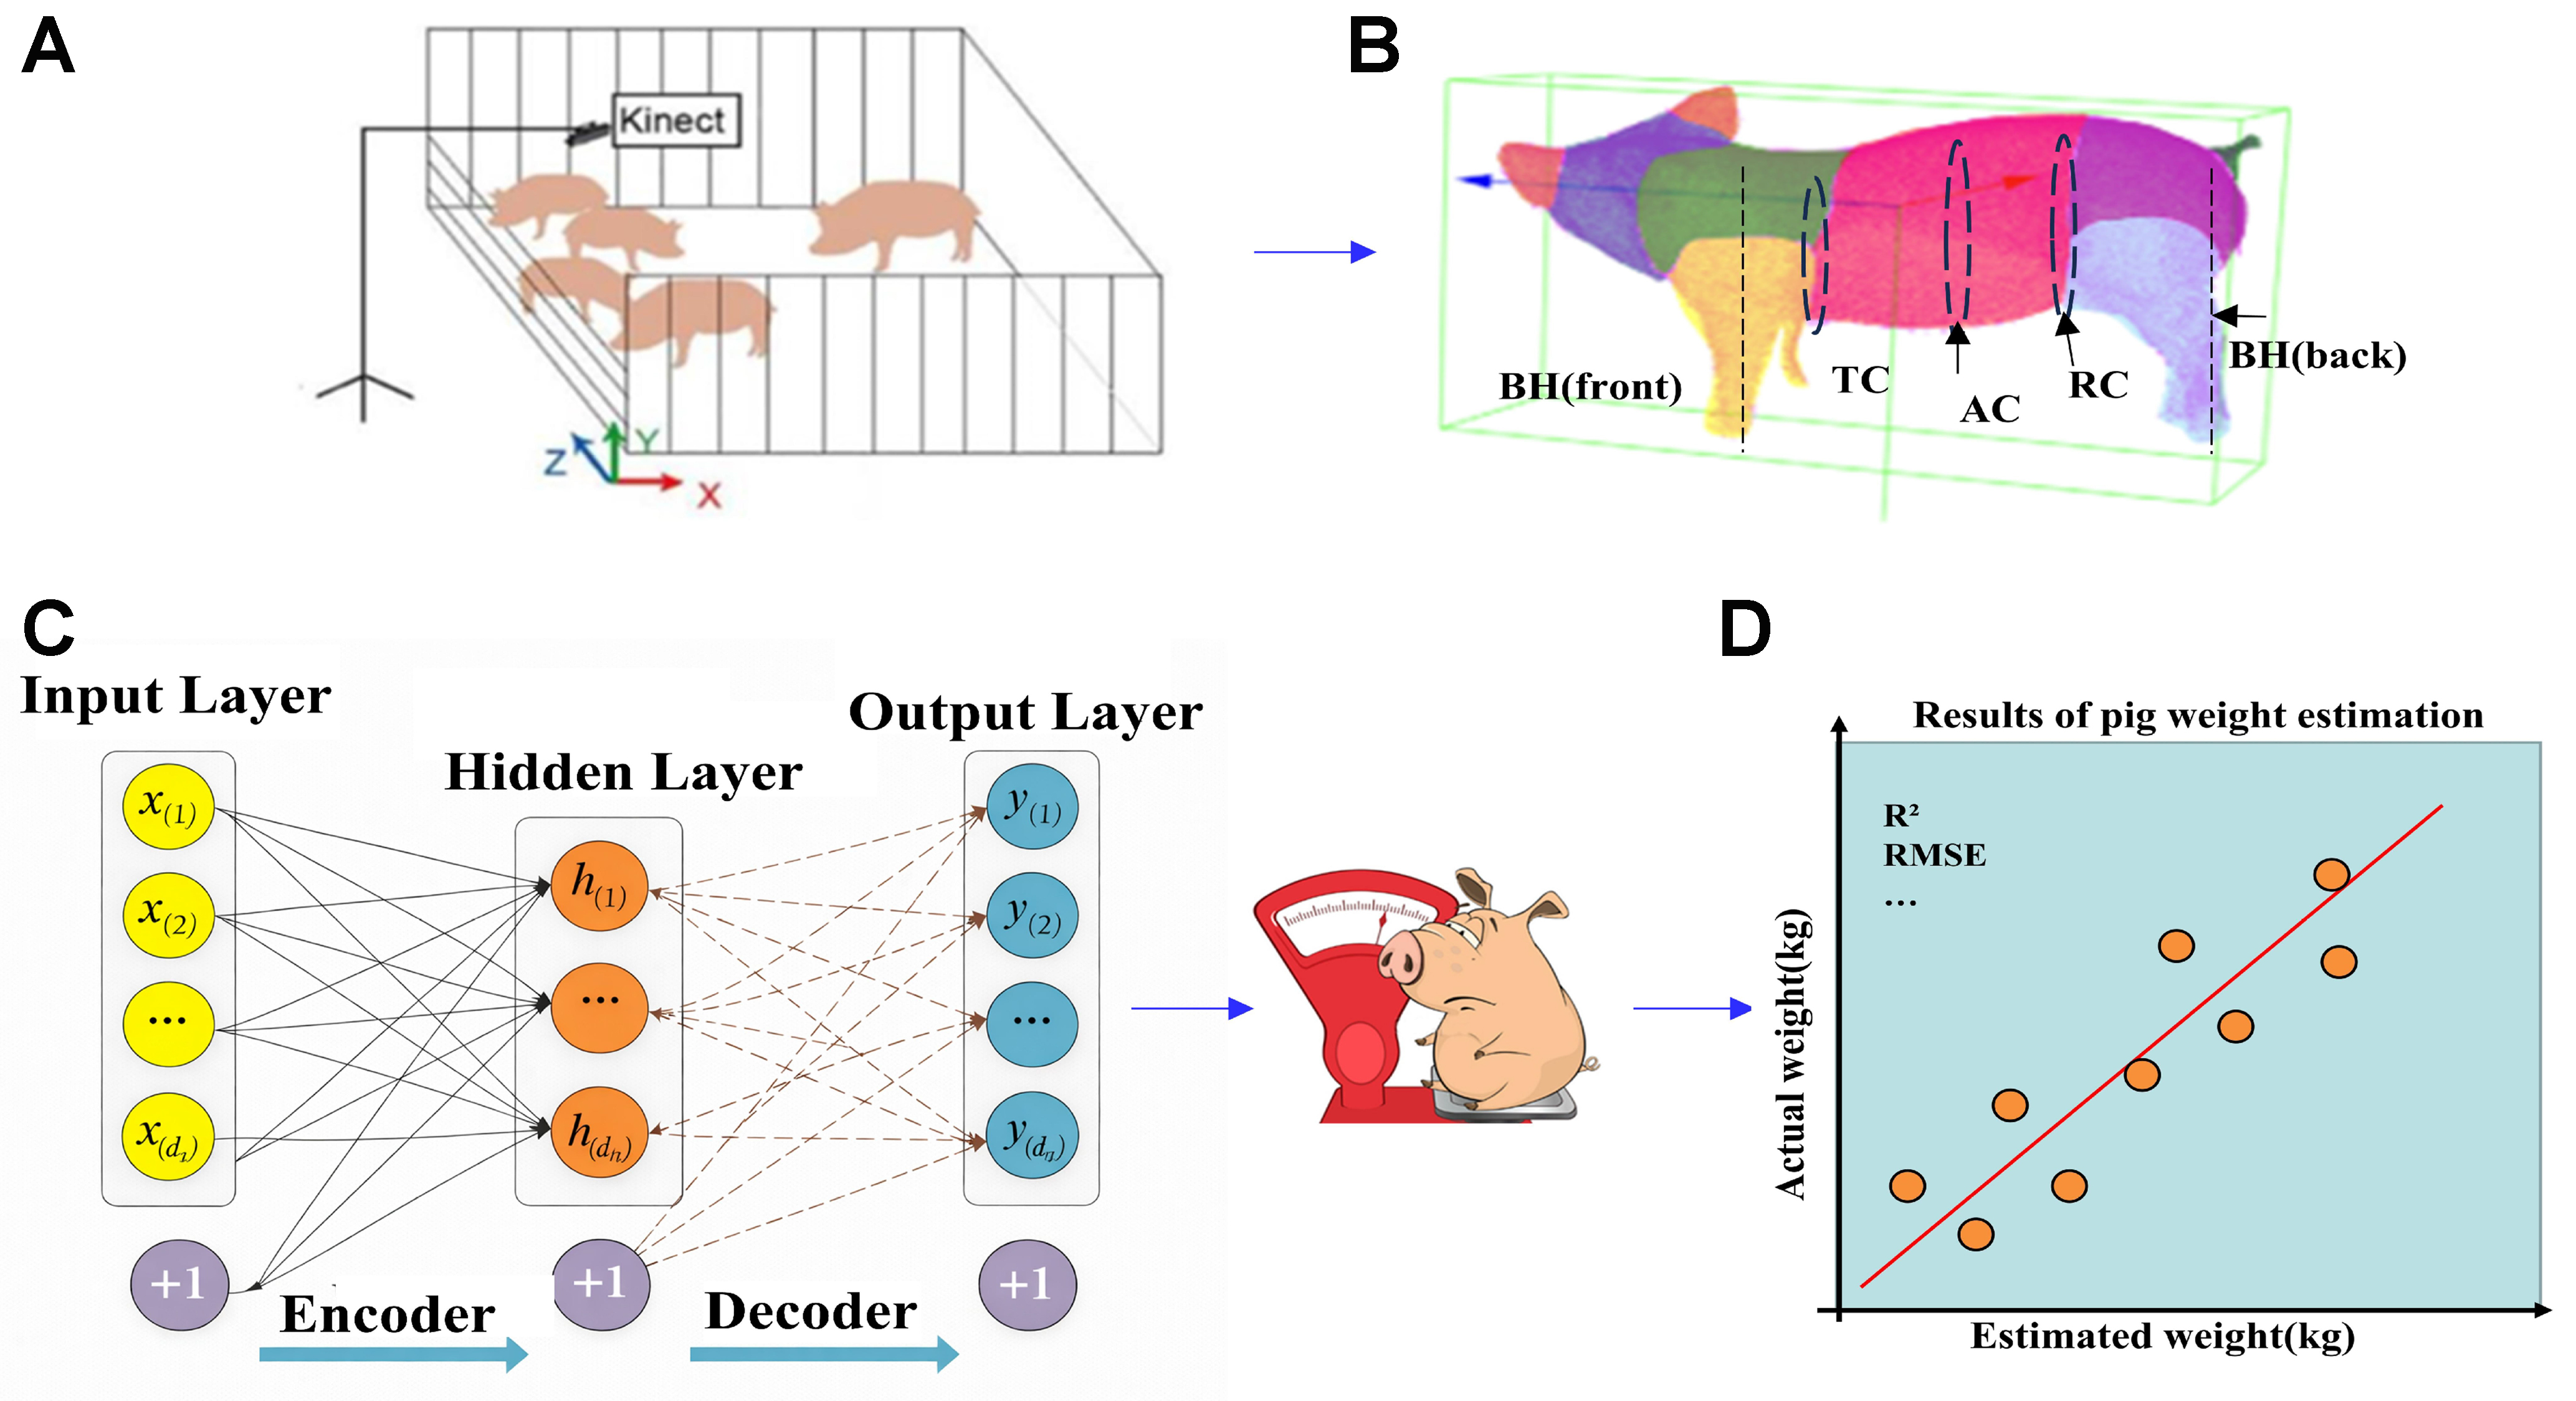
Figure 7. Schematic diagram of weight measurement based on linear regression. (A) Acquisition of pig images; (B) Extraction of key morphometric features from images, such as body length, chest girth, and shoulder width; (C) Input of extracted morphometric parameters into a regression model for weight prediction; (D) Output of the final predicted weight. TC: Trunk circumference; AC: abdominal circumference; RC: rump circumference; BH: body height; R2: coefficient of determination; RMSE: root mean squared error.
The objective of linear regression is to determine the optimal coefficients by minimizing the sum of squared errors between predicted and actual values, enabling weight prediction. For example, Tasdemir et al. analyzed morphometric data from Holstein cows and used regression equations to predict body weight[57]. Furthermore, Al Ard Khanji et al. applied linear regression by utilizing multiple body measurements of pigs (e.g., flank-to-flank distance, body length, heart girth) combined with physiological status, achieving high prediction accuracy[58]. However, although digital image analysis methods have been used for livestock weight measurement, their prediction accuracy is limited when dealing with complex nonlinear relationships and different livestock breeds.
4.1.2.2. Nonlinear regression-based methods
In the field of contactless livestock weight measurement, nonlinear regression models have become essential due to their ability to handle complex nonlinear relationships and improve measurement accuracy. These models exhibit robustness to noise and outliers, maintaining overall stability even when some individual decision trees are affected. This advantage effectively addresses the shortcomings of linear regression models, which often fail to capture the intricate nonlinear associations between livestock body features and weight, resulting in larger prediction errors. Thus, nonlinear regression models play a critical role in this domain. Among nonlinear regression approaches, random forest regression and light gradient boosting machine (LightGBM) regression have received significant attention due to their strong performance. Al Ard Khanji
In summary, model selection should be a strategic decision dictated by specific operational constraints - including the volume of the training corpus, limitations of deployment hardware, and necessary system throughput. By aligning algorithmic strengths with practical requirements, researchers can achieve an optimal balance between measurement accuracy and computational performance.
4.2. DL paradigm: representation learning and end-to-end prediction
ML pipelines can be constrained by the brittleness of handcrafted features in complex farming conditions and by difficulties in modeling highly nonlinear biological variability. DL addresses these issues by learning multi-level abstract feature representations directly from raw data, reducing reliance on manual feature engineering and improving generalization for large-scale and diverse datasets.
4.2.1. Single-modality end-to-end regression networks
End-to-end regression networks directly map a single modality (RGB, depth, or point clouds) to body weight, learning nonlinear relationships through hierarchical feature extraction.
4.2.1.1. CNN-based regression from RGB and RGB-D images
While ML has yielded notable results in livestock weight measurement, the increasing complexity of modern agricultural demands has highlighted its inherent limitations. ML methods often struggle to model highly nonlinear relationships and remain heavily dependent on handcrafted feature selection, which can constrain both measurement precision and model generalization. In contrast, CNN-based regression models learn hierarchical visual features directly from RGB or RGB-D inputs, enabling end-to-end prediction of livestock body weight. Figure 8 shows a CNN-based end-to-end architecture for predicting livestock body weight from images. This architecture enhances both the precision and robustness of the measurement process, while effectively addressing the challenges posed by large-scale datasets and intricate nonlinear mappings. Training CNNs on image data achieves relatively high accuracy and enables low-cost, unobtrusive, high-capacity, and even real-time collection of large amounts of livestock data[61].
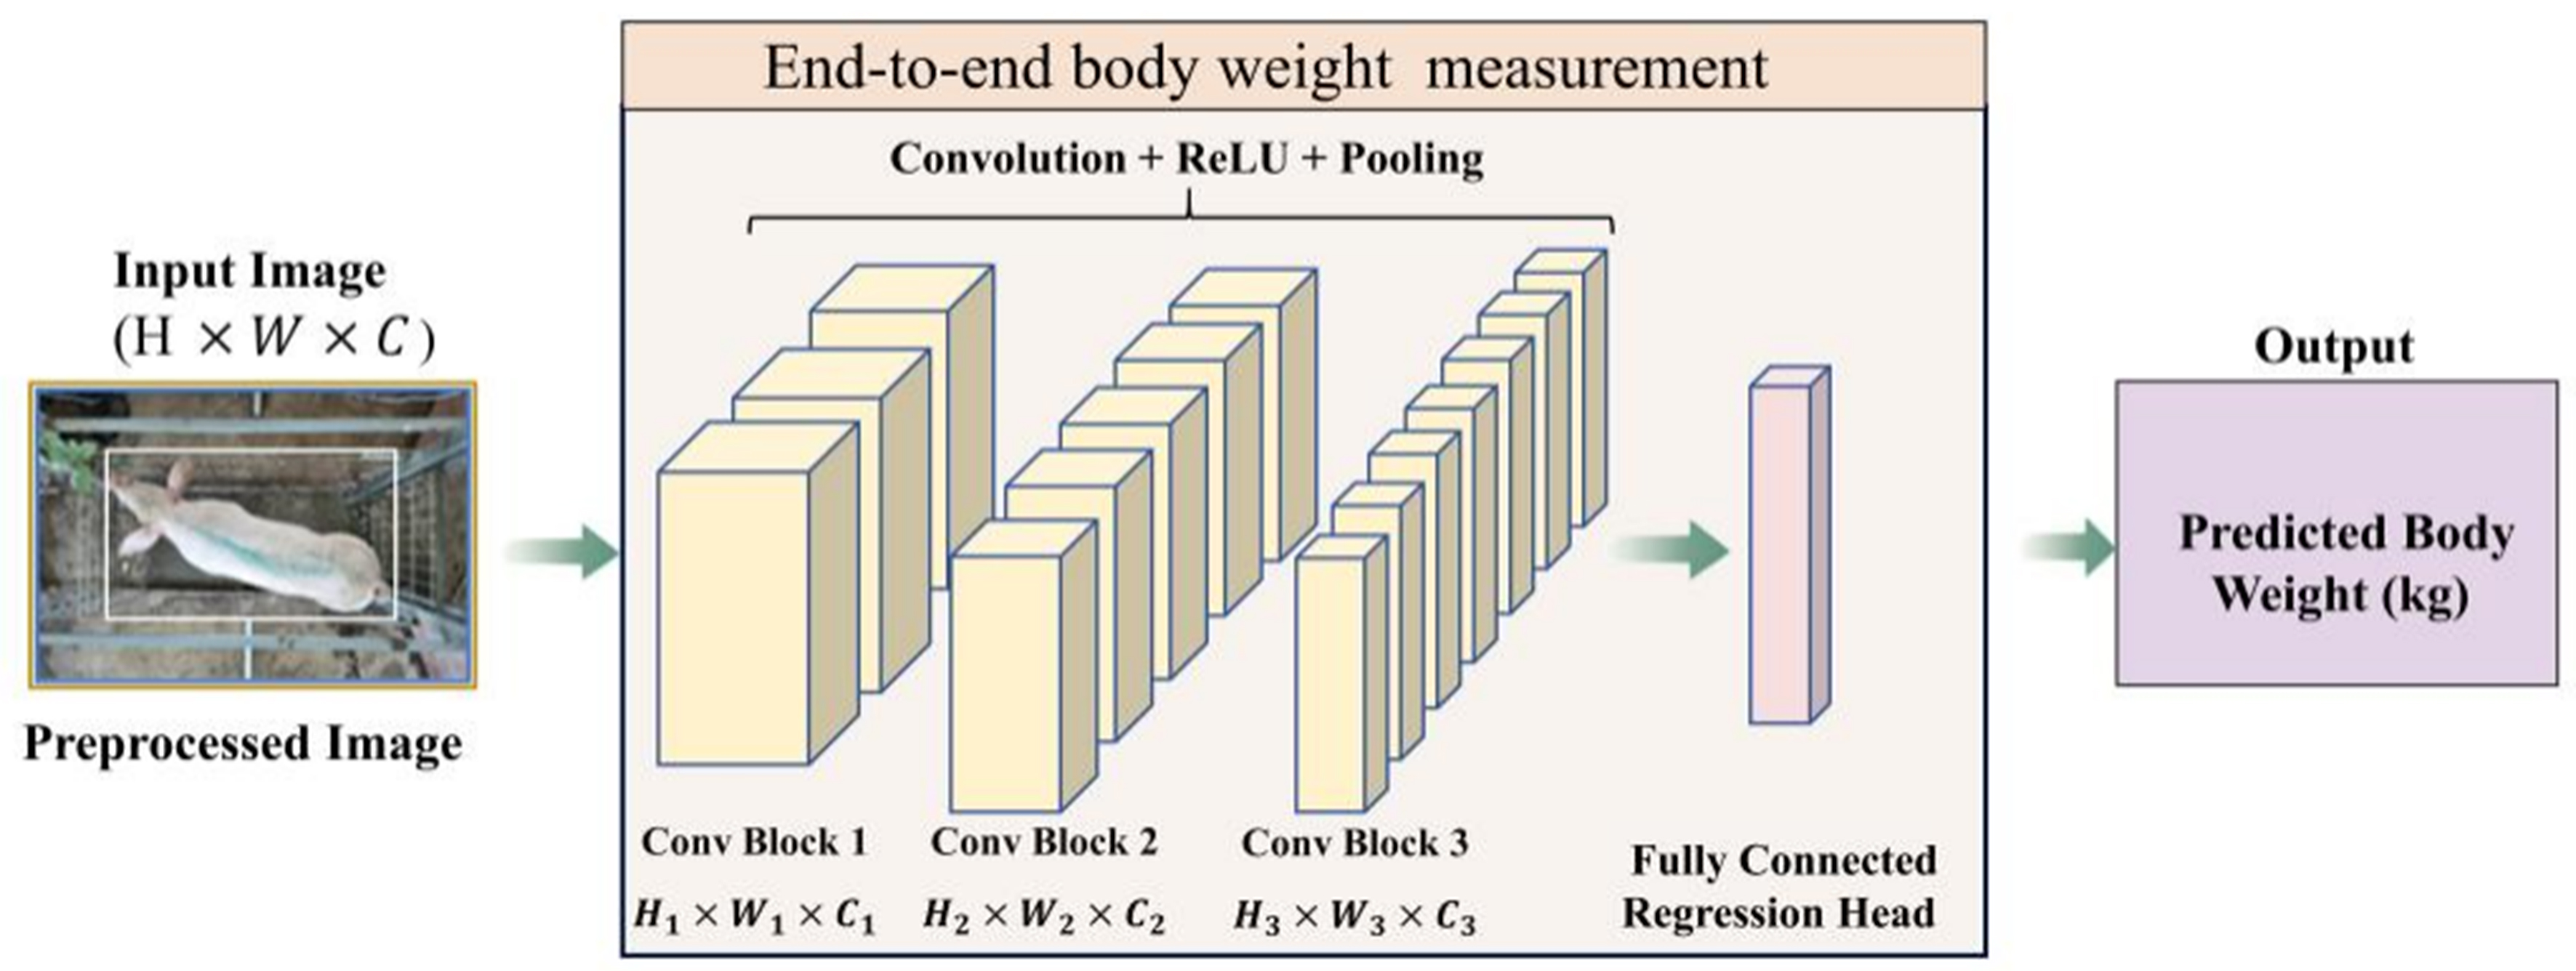
Figure 8. CNN-based end-to-end regression for livestock body weight prediction from RGB or RGB-D images, extracting hierarchical features through convolutional blocks and predicting weight via a fully connected regression head. The input image shown in Figure 8 was collected by the authors at Guojia Pig Farm, Longyao County, Xingtai City, Hebei Province, China. CNN: Convolutional neural network; RGB: red-green-blue; RGB-D: red-green-blue-depth; ReLU: rectified linear unit.
DL models require substantial computational resources and large annotated datasets, often exhibit high model complexity, and their decision-making processes are difficult to interpret. CNNs process image data by mimicking the mechanisms of the human visual system and have been widely applied in livestock morphology measurement and weight prediction. For instance, Meckbach et al. trained CNNs on RGB images of pigs for regression analysis, achieving direct weight measurement without explicit body measurement parameters[62]. Their study compared architectures such as ResNet18 and MobileNetV2, demonstrating that lightweight models can maintain prediction accuracy while offering higher inference efficiency - facilitating practical deployment in farming environments. In terms of depth images, Ruchay
4.2.1.2. Deep networks for 3D point clouds and mesh-based representations
DL has also shown strong capability in modeling 3D point clouds and mesh/surface representations. More recently, Kiyoun et al. proposed a high-precision weight measurement algorithm based on point cloud data[64]. This method employs a stable mesh reconstruction model and an optimized deep neural network to address noise and missing data issues in point clouds, thereby enabling precise weight predictions. Li et al. validated the use of single-frame surface point clouds to measure morphology and developed a model to estimate pig weight[65]. By fixing a Kinect camera above the watering area, multiple pig images could be captured simultaneously in group housing environments. The system first collects point cloud data via imaging technology and then applies the model to predict weight.
4.2.2. Two-stage DL pipelines: segmentation/keypoints/posture normalization + regression
In practice, many systems adopt a two-stage pipeline: (i) a perception module (segmentation, keypoint detection, tracking, posture normalization) to extract clean regions or landmarks; and (ii) a measurement/regression module to compute morphometric parameters and/or predict weight.
After segmentation, keypoint detection and part-based point cloud processing can further improve measurement precision. Bai et al. proposed the LaWE model, which employs a lightweight multi-scale convolutional network for keypoint extraction and a deep regression network for weight prediction, reducing deployment cost[66]. Building upon this approach, Zhu et al. proposed a pig point cloud posture normalization method based on skeleton extraction and spatial transformation, effectively reducing point cloud volume errors caused by posture differences and improving the robustness of subsequent weight measurement models[67].
Figure 9 illustrates the DL-based keypoint detection workflow for point clouds, including data acquisition and preprocessing. Using deep network models (e.g., the improved PointNet++), effective differentiation and feature extraction of body parts such as the head, torso, and limbs are achieved, providing precise data for subsequent morphometric parameter calculation and weight measurement.
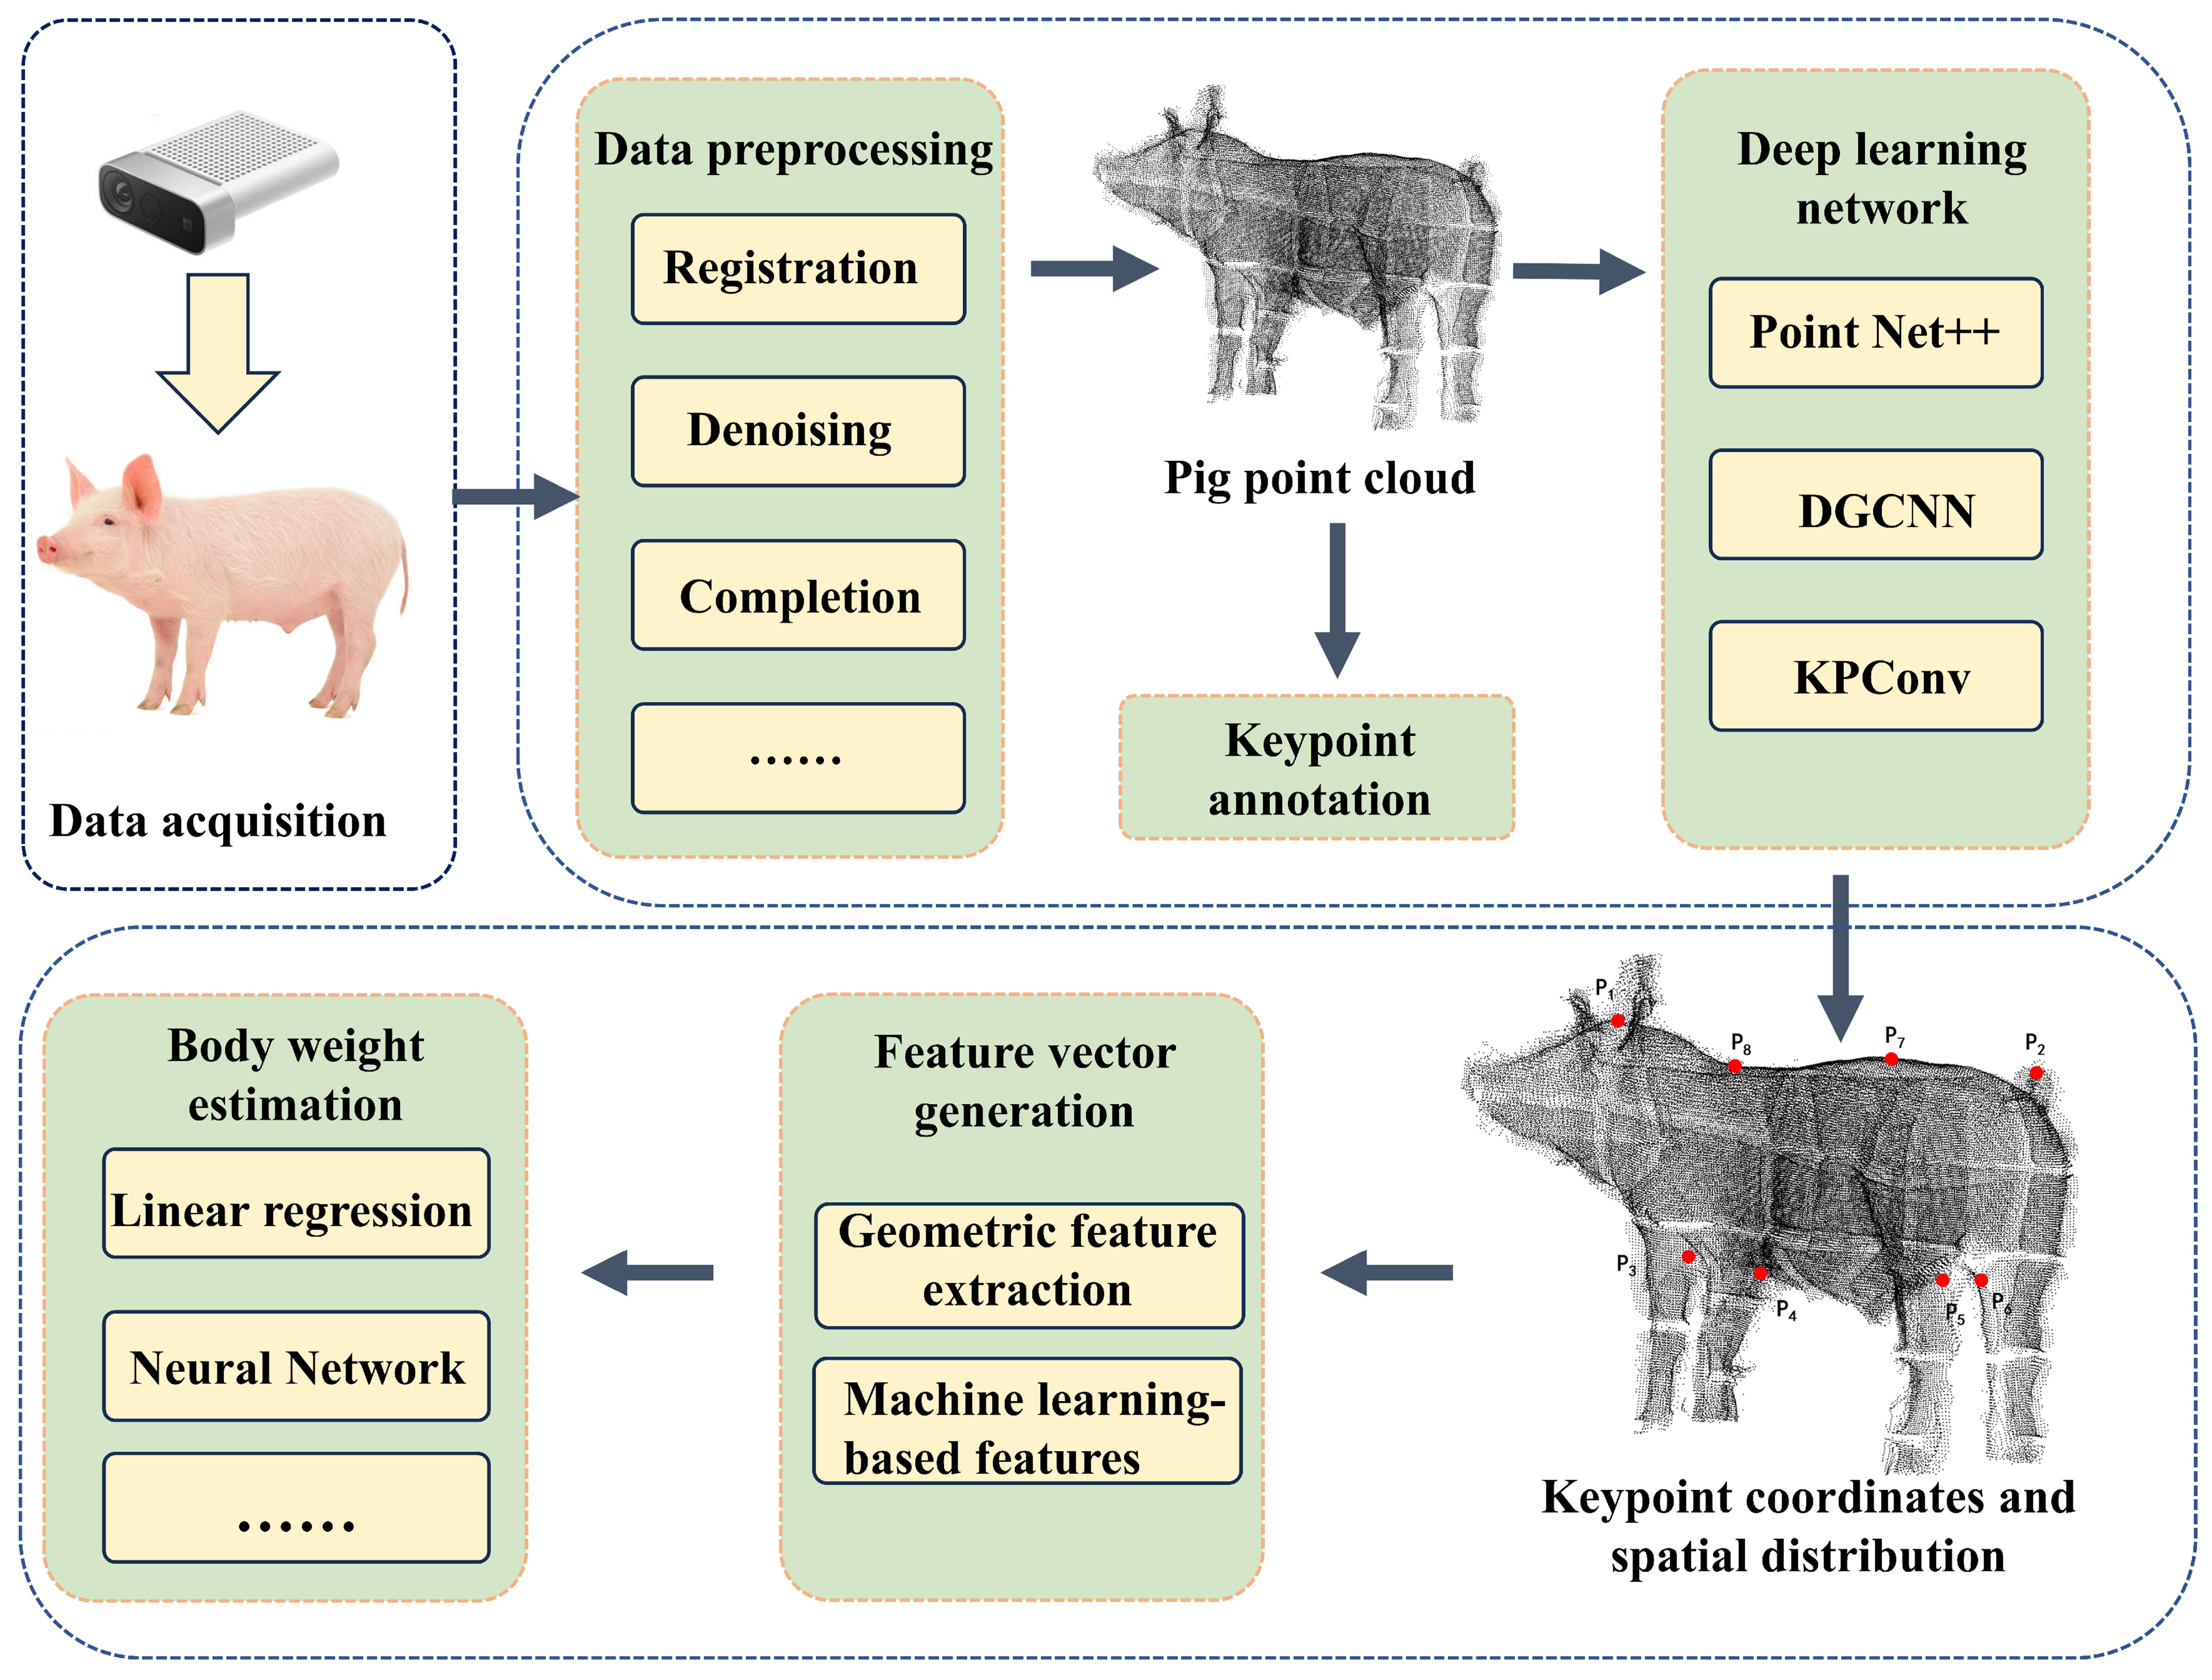
Figure 9. DL-based keypoint detection workflow for point clouds. The point cloud data shown in Figure 9 were collected by the authors at Guojia Pig Farm, Longyao County, Xingtai City, Hebei Province, China. DL: Deep learning; DGCNN: dynamic graph convolutional neural network; KPConv: kernel point convolution.
4.2.3. Multimodal and multi-model fusion frameworks for weight measurement
To improve robustness under complex farm conditions, recent studies have increasingly adopted multimodal fusion and multi-model frameworks. Multimodal data fusion integrates multiple types of data such as RGB images, depth images, and point cloud data, as illustrated in Figure 10.
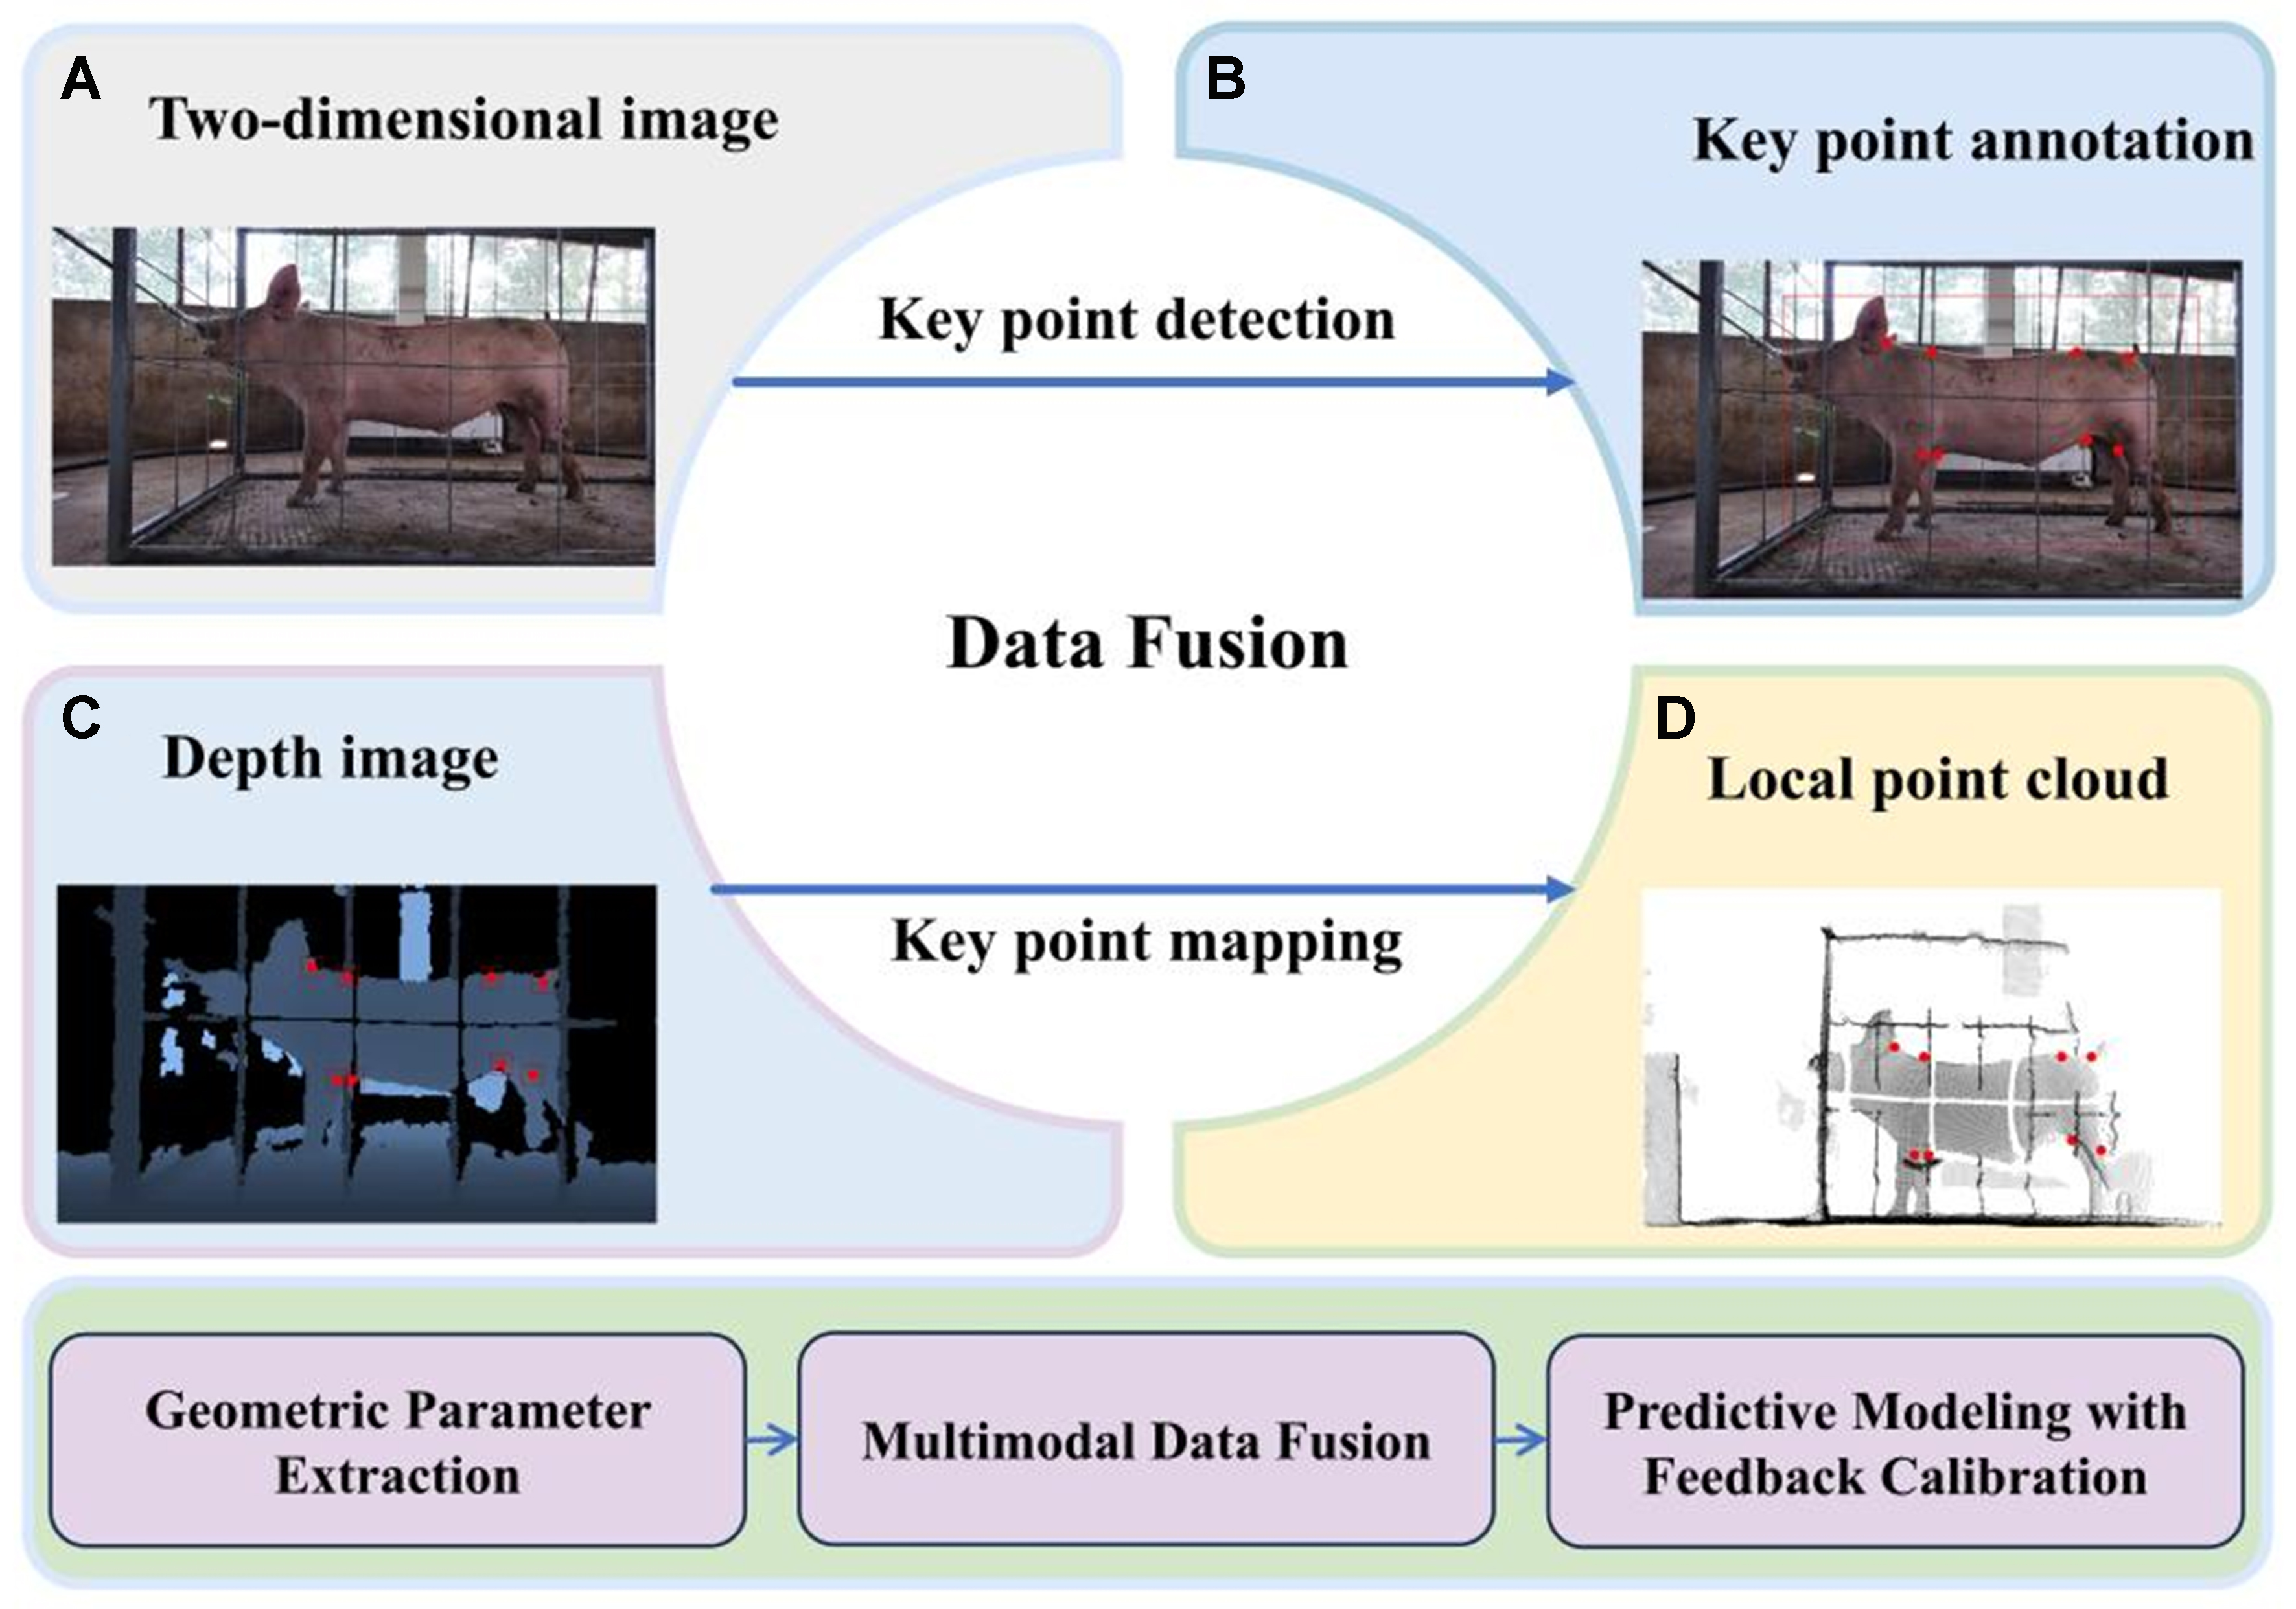
Figure 10. Illustration of an example of multimodal livestock keypoint detection and mapping: (A) Input 2D image; (B) Keypoint detection results; (C) Keypoint mapping in the point cloud data; (D) Keypoint locations in the depth image. The output data shown in Figure 10 were collected by the authors at Guojia Pig Farm, Longyao County, Xingtai City, Hebei Province, China. 2D: Two-dimensional.
To address heterogeneity across modalities, translation-based multimodal learning has emerged as a critical paradigm. As synthesized by Lu et al., this approach focuses on learning generative or discriminative mappings that translate information from one modality to another, thereby ensuring consistent feature alignment[68]. Multi-model fusion methods combine different learning algorithms to fully leverage each algorithm’s strengths, effectively handle complex multimodal data, and enhance prediction stability and accuracy. For example, Dong et al. recently proposed a dual-network architecture that separately extracts ground reaction force and image contour features, constructing a fused regression model for real-time weight measurement[69]. This work demonstrates the great potential of multi-source data collaborative modeling and the critical role of structural innovation in performance improvement.
Fusion can also be implemented through multi-model cascades across vision, clustering, and 3D reconstruction. Yang et al. utilized an improved You Only Look Once version 8 with Simplified Bi-directional Feature Pyramid Network (YOLOv8-SimBiFPN) model for RGB image processing, combined with DBSCAN clustering to integrate depth images and camera parameters to generate point clouds[70]. They determined 3D keypoint positions and calculated multiple cattle body metrics, achieving precise morphometric data via multimodal data and multi-model fusion. Recent breakthroughs in Transformer architectures have also influenced this field. He et al. proposed a two-stream cross-attention vision Transformer based on RGB-D images[71]. Features extracted separately from RGB and depth images were interactively fused via cross-modal attention, enhancing weight measurement accuracy. Thermal and infrared modalities may also provide physiologically relevant context for weight estimation, for example, by helping identify abnormal thermal patterns associated with stress or fever, thereby supporting a more interpretable understanding of weight changes.
5. EVALUATION METRICS FOR MODEL PERFORMANCE
Model performance is commonly evaluated using mean squared error (MSE), mean absolute error (MAE), root mean squared error (RMSE), coefficient of determination (R2), and mean absolute percentage error (MAPE). In livestock weight estimation, relative metrics such as MAPE are often more informative than absolute errors expressed in kilograms, because the practical significance of an error depends strongly on animal body size.
5.1. Common evaluation metrics
The performance evaluation of livestock weight measurement systems typically employs multiple statistical metrics to comprehensively assess model accuracy and robustness. Common evaluation criteria include MSE, MAE, RMSE, R2, and MAPE[72,73]. The MSE reflects the average of the squared differences between predicted values and actual values. It is defined as:
where
The RMSE is the square root of the MSE and indicates the magnitude of the prediction error in terms of standard deviation. It is calculated as:
The MAE measures the average absolute difference between predicted and actual values, and is defined as:
where yi is the ground-truth weight and
The MAPE expresses the prediction error as a percentage, with smaller values indicating better fit and higher predictive accuracy. It is calculated as:
Additionally, the R2 evaluates the model’s ability to explain the variance in the data. A value closer to 1 indicates better model performance. The formula is given by:
where
5.2. Cross-species performance comparison
Cross-species performance is difficult to compare directly because studies differ in weight ranges, sensing setups, postures, and evaluation protocols. Absolute errors (e.g., RMSE in kilograms) tend to increase with the species’ weight scale; therefore, percentage-based metrics such as MAPE/relative error, and normalized RMSE (nRMSE) are more suitable for cross-species discussion.
5.3. Experimental comparison of different models
For comparability, we emphasize three categories of metrics:
Goodness-of-fit (e.g., R2): the R2 evaluates the model’s ability to explain the variance in the data, but is sensitive to the variance of the tested population (e.g., wider weight ranges can inflate R2;
Error magnitude (e.g., MAPE): MAPE is generally more informative for cross-study and cross-species comparisons than absolute errors such as RMSE or MAE expressed in kilograms, because it accounts for the relative scale of the animal’s body weight. However, it is still not strictly comparable across heterogeneous datasets with different weight ranges, postures, sensing setups, and evaluation protocols.
nRMSE: Since absolute errors (e.g., RMSE in kilograms) depend strongly on the weight scale and are therefore not directly comparable across studies with different weight ranges, we additionally report normalized RMSE when sufficient information is available[74]:
where ymax and ymin are the maximum and minimum ground-truth weights in the evaluated test set.
To improve methodological rigor, many studies evaluate weight estimation frameworks on internal datasets with study-specific protocols. However, direct horizontal comparison across papers is not valid when datasets differ in species, weight range, imaging geometry, and evaluation setups. Table 4 summarizes the reported performance of representative models. Pig studies often report relatively low percentage errors under constrained imaging conditions[8], whereas measurements in cattle and sheep are more strongly affected by larger body size and posture variability[60,77], which can increase both absolute and relative prediction errors. Therefore, Table 4 should be interpreted as a catalog of reported results rather than a unified benchmark.
Summary of performance of different algorithmic models in livestock weight measurement
| Author(s) | Species | Weight range | Modality | Algorithm model | Performance | nRMSE |
| Tasdemir et al.[57] | Cattle | 400-780 kg | Digital image analysis | Linear regression model | R 2 = 0.958 | ≈ 4.69% |
| Al Ard Khanji et al.[58] | Pigs | 120-260 kg | Manual morphometrics | Multiple linear regression model | Not reported | ≈ 8.7% |
| Dang et al.[60] | Cattle | 200-800 kg | 3D point cloud | ML-based regression | RMSE = 24.754 kg, MAPE = 4.721% | ≈ 6.05% |
| Ruchay et al.[63] | Cattle | 243-605 kg | RGB-D images | CNN | Accuracy = 91.6%, MAPE = 8.4% | N/A |
| Tu and Jorgensen[75] | Pigs | 20-105 kg | Top-view camera images | Linear regression | Accuracy = 97.76% | N/A |
| Dohmen et al.[76] | Cows | 37-370 kg | RGB | Mask R-CNN + CNN-based regression model | R 2 = 0.96, RMSE = 20 kg | ≈ 6.0% |
We note that nRMSE still depends on the reported weight range and does not fully eliminate heterogeneity arising from differences in acquisition settings and evaluation protocols; it is provided as an auxiliary indicator rather than a strict benchmark.
6. CHALLENGES AND FUTURE TRENDS
Despite significant advancements in CV techniques for livestock weight measurement, formidable challenges persist that hinder their widespread practical application. This section delineates current technological bottlenecks and prospects for future research directions.
6.1. Current technical challenges
Current CV-based livestock weight measurement methods still face several challenges affecting accuracy, robustness, and practical applicability. These challenges mainly include postural variation and environmental complexity, limited generalization across biological and operational settings, and the dependence of current models on large labeled datasets and substantial computational resources. Livestock exhibit diverse postures, such as standing, lying down, and walking, which cause significant differences in body dimensions and thus affect measurement results. In addition, environmental factors such as illumination variation, cluttered backgrounds, and occlusion can degrade image quality and reduce the precision of body-part localization and morphometric extraction in pigs[78]. Current methods also often rely on large labeled datasets and computationally intensive models, which increase annotation costs and limit interpretability and practical deployment under constrained hardware and network conditions. These challenges are difficult to control in practice, since outdoor environments are inherently variable, whereas indoor systems are often limited by equipment costs and the slow adoption of commercial technologies[79].
6.2. Future trends
Future research should focus on three priorities: improving robustness under posture variation and complex farm conditions, strengthening generalization across species and deployment environments, and developing models that are more scalable, data-efficient, and interpretable.
• Fusion-driven Robustness Against Postural Variation and Environmental Complexity
Postural variation, environmental complexity, and the limitations of current 3D sensing systems remain major constraints on vision-based livestock weight measurement. Data fusion provides a promising strategy to improve robustness under such conditions. Sensor-level fusion can improve coverage and fault tolerance, modality-level fusion can reduce ambiguity by integrating complementary information, and feature- or decision-level fusion can enhance model consistency under noisy and variable conditions. Future studies should also move toward standardized 3D livestock representations by reposing bodies to a neutral standing posture before measurement. In addition, uncertainty-aware fusion and integration with mobile platforms may further improve reliability in dynamic farm environments.
• Improving Generalization Across Species, Breeds, and Environments
A further challenge is the limited generalization of current models across breeds, developmental stages, and farm environments. To improve cross-domain robustness, future studies should expand dataset diversity, adopt more realistic augmentation strategies, and incorporate regularization and domain adaptation methods to improve transferability.
• Advancing Scalable, Data-efficient, and Interpretable Systems through Foundation Models
The reliance of current models on large-scale labeled datasets remains a major barrier to practical deployment. In this context, foundation models offer a promising direction because of their stronger representation learning capabilities and improved zero-shot and few-shot transfer performance. Multimodal foundation models may also enhance interpretability and user interaction. Future work should therefore explore hybrid frameworks that combine foundation models with lightweight models for edge deployment, balancing accuracy with real-time efficiency.
7. CONCLUSION
This review summarizes recent advances in CV-based livestock weight measurement, highlighting both feature-engineered and DL approaches. Non-contact 3D reconstruction techniques, including point cloud and Gaussian splatting, enhance measurement accuracy and robustness. Key challenges remain, including environmental variability, posture-induced errors, limited labeled datasets, and the practical integration of 3D sensing. Future research should prioritize large-scale heterogeneous datasets, robust multimodal fusion frameworks, and lightweight, edge-deployable models to support accurate and scalable livestock weight estimation.
DECLARATIONS
Authors’ contributions
Conceptualization, supervision, writing - review and editing: Ma, W.
Literature review, data curation, writing - original draft: Guo, M.
Visualization, writing - review and editing, funding acquisition: Li, Q.
Literature review, data collection, project administration: Li, Z.
Writing - review and editing, visualization: Liang, X.
Resources, supervision: Yang, S. X.
Resources, validation: Zhong, Z.
Availability of data and materials
Not applicable.
AI and AI-assisted tools statement
During the preparation of this manuscript, the AI tool DeepSeek-V3-0324 (version 3.0, released 2025-03-24) was used solely for language editing. The tool did not influence the study design, data collection, analysis, interpretation, or the scientific content of the work. All authors take full responsibility for the accuracy, integrity, and final content of the manuscript.
Financial support and sponsorship
This work was supported by the Sichuan Science and Technology Program (No. 2021ZDZX0011), the Ability Innovation Program of Beijing Academy of Agriculture and Forestry Sciences (Grant No. KJCX20230204), the Key R&D Project of the Ningxia Hui Autonomous Region (Grant No. 2024BBF01014), and the National Beef Cattle and Yak Industrial Technology System (Grant No. CARS-37).
Conflicts of interest
Yang, S. X. is the Editor-in-Chief of the journal Intelligence & Robotics, but was not involved in any stage of the editorial process, notably including reviewer selection, manuscript handling, or decision making. The other authors declared that there are no conflicts of interest.
Ethical approval and consent to participate
The animal subjects involved in this study were sourced from Guojia Pig Farm, Longyao County, Xingtai City, Hebei Province, China. Formal informed consent was obtained from the legal owners of the livestock. The data collection process was non-invasive and did not interfere with the natural behavior or welfare of the animals.
Consent for publication
Not applicable.
Copyright
© The Author(s) 2026.
REFERENCES
1. Frost, A.; Schofield, C.; Beaulah, S.; Mottram, T.; Lines, J.; Wathes, C. A review of livestock monitoring and the need for integrated systems. Comput. Electron. Agric. 1997, 17, 139-59.
2. Zin, T. T.; Seint, P. T.; Tin, P.; Horii, Y.; Kobayashi, I. Body condition score estimation based on regression analysis using a 3D camera. Sensors 2020, 20, 3705.
3. Imamura, S.; Zin, T. T.; Kobayashi, I.; Horii, Y. Automatic evaluation of Cow’s body-condition-score using 3D camera. In Proceedings of the 2017 IEEE 6th Global Conference on Consumer Electronics (GCCE), Nagoya, Japan. Oct 24-27, 2017. IEEE; 2017. pp. 1-2.
4. Franchi, G. A.; Bus, J. D.; Boumans, I. J.; Bokkers, E. A.; Jensen, M. B.; Pedersen, L. J. Estimating body weight in conventional growing pigs using a depth camera. Smart. Agric. Technol. 2023, 3, 100117.
5. Lee, J.; Jin, L.; Park, D.; Chung, Y. Automatic recognition of aggressive behavior in pigs using a kinect depth sensor. Sensors 2016, 16, 631.
6. Hu, Z.; Yang, H.; Lou, T. Dual attention-guided feature pyramid network for instance segmentation of group pigs. Comput. Electron. Agric. 2021, 186, 106140.
7. Peng, W.; Liu, Z.; Cai, J.; Zhao, Y. Research and application progress of electronic ear tags as infrastructure for precision livestock industry: a review. Intell. Robot. 2025, 5, 433-49.
8. Bhoj, S.; Tarafdar, A.; Chauhan, A.; Singh, M.; Gaur, G. K. Image processing strategies for pig liveweight measurement: updates and challenges. Comput. Electron. Agric. 2022, 193, 106693.
9. Dohmen, R.; Catal, C.; Liu, Q. Computer vision‐based weight estimation of livestock: a systematic literature review. N. Z. J. Agric. Res. 2022, 65, 227-47.
10. Sun, Y.; Li, Q.; Ma, W.; et al. A multi-view real-time approach for rapid point cloud acquisition and reconstruction in goats. Agriculture 2024, 14, 1785.
11. Xie, Q.; Zhou, H.; Bao, J.; Da, Q. Advances in machine vision-driven body weight assessment for livestock and poultry. J. Agric. Mach. 2022, 53, 1-15.
12. Alenyà, G.; Foix, S.; Torras, C. ToF cameras for active vision in robotics. Sens. Actuators. A. Phys. 2014, 218, 10-22.
13. Huang, L.; Li, S.; Zhu, A.; Fan, X.; Zhang, C.; Wang, H. Non-contact body measurement for Qinchuan cattle with LiDAR sensor. Sensors 2018, 18, 3014.
14. Quintana Benito, J.; Fernández-Balbuena, A. A.; Martínez-Antón, J. C.; Váquez Molini, D. Improvement of driver night vision in foggy environments by structured light projection. Heliyon 2022, 8, e11877.
15. Zhu, J.; Zeng, Q.; Han, F.; Jia, C.; Bian, Y.; Wei, C. Design of laser scanning binocular stereo vision imaging system and target measurement. Optik 2022, 270, 169994.
16. Ma, W.; Qi, X.; Sun, Y.; et al. Computer vision-based measurement techniques for livestock body dimension and weight: a review. Agriculture 2024, 14, 306.
17. Wang, Z. Review of real-time three-dimensional shape measurement techniques. Measurement 2020, 156, 107624.
18. Ruchay, A.; Kober, V.; Dorofeev, K.; Kolpakov, V.; Miroshnikov, S. Accurate body measurement of live cattle using three depth cameras and non-rigid 3-D shape recovery. Comput. Electron. Agric. 2020, 179, 105821.
19. Condotta, I. C.; Brown-Brandl, T. M.; Silva-Miranda, K. O.; Stinn, J. P. Evaluation of a depth sensor for mass estimation of growing and finishing pigs. Biosyst. Eng. 2018, 173, 11-8.
20. Ruchay, A.; Kolpakov, V.; Gerasimov, N.; et al. Ultrasound and optical measurement data fusion for assessing the morphological traits and weight of Aberdeen Angus cattle. Comput. Electron. Agric. 2025, 233, 110203.
21. Pezzuolo, A.; Milani, V.; Zhu, D.; Guo, H.; Guercini, S.; Marinello, F. On-barn pig weight estimation based on body measurements by structure-from-motion (SfM). Sensors 2018, 18, 3603.
22. Kongsro, J. Estimation of pig weight using a Microsoft Kinect prototype imaging system. Comput. Electron. Agric. 2014, 109, 32-5.
23. Marchant, J. A.; Schofield, C. P.; White, R. P. Pig growth and conformation monitoring using image analysis. Anim. Sci. 1999, 68, 141-50.
24. Kashiha, M.; Bahr, C.; Ott, S.; et al. Automatic weight estimation of individual pigs using image analysis. Comput. Electron. Agric. 2014, 107, 38-44.
25. Wu, J.; Tillett, R.; Mcfarlane, N.; Ju, X.; Siebert, J.; Schofield, P. Extracting the three-dimensional shape of live pigs using stereo photogrammetry. Comput. Electron. Agric. 2004, 44, 203-22.
26. Shuai, S.; Ling, Y.; Shihao, L.; et al. Research on 3D surface reconstruction and body size measurement of pigs based on multi-view RGB-D cameras. Comput. Electron. Agric. 2020, 175, 105543.
27. Wu, Z.; Zhang, J.; Li, J.; Zhao, W. Multi-view fusion-based automated full-posture cattle body size measurement. Animals 2024, 14, 3190.
28. Liu, T.; Teng, G.; Zhang, S.; Li, Z.; Guo, P. Surface reconstruction and applications of pig body from point cloud data. J. Agric. Mach. 2014, 45, 291-5.
29. Ji, X.; Li, Q.; Guo, K.; et al. A machine learning-based method for pig weight estimation and the PIGRGB-weight dataset. Agriculture 2025, 15, 814.
30. Jun, K.; Kim, S. J.; Ji, H. W. Estimating pig weights from images without constraint on posture and illumination. Comput. Electron. Agric. 2018, 153, 169-76.
31. Xu, Z.; Li, Q.; Ma, W.; Li, M.; Xue, X.; Zhao, C. A reconstruction method for incomplete pig point clouds based on stepwise hole filling and its applications. Biosyst. Eng. 2025, 255, 104171.
32. Du, A.; Guo, H.; Lu, J.; et al. Automatic livestock body measurement based on keypoint detection with multiple depth cameras. Comput. Electron. Agric. 2022, 198, 107059.
33. Harvard Dataverse. Pigs_weight. 2024. https://doi.org/10.7910/DVN/AZ5IBM. (accessed 2026-04-27).
34. Kaggle. Sheep weight estimation dataset. https://www.kaggle.com/datasets/tianfanghzau/sheep-weight-estimation-dataset-multimodal-images. (accessed 2026-04-27).
35. Wang, Y.; Yuan, X.; Wei, B.; Ruchay, A.; Pezzuolo, A.; Guo, H. Performance evaluation of a state-of-the-art keypoint detection method for precision livestock farming. Comput. Electron. Agric. 2026, 240, 111230.
36. Wang, Z.; Tulpan, D.; Bergeron, R. PSI-16 Estimation of pigs live body weight from digital images using reference objects. J. Anim. Sci. 2021, 99, 276-7.
37. Gao, Y.; Guo, J.; Xuan, L.; Lei, M.; Lu, J.; Tong, Y. Deep learning-driven instance segmentation for group-housed pigs in agricultural images. J. Agric. Mach. 2019, 50, 179-87.
38. Han, H.; Xue, X.; Li, Q.; et al. Pig-ear detection from the thermal infrared image based on improved YOLOv8n. Intell. Robot. 2024, 4, 1-19.
39. Papadakis, P.; Pratikakis, I.; Perantonis, S.; Theoharis, T. Efficient 3D shape matching and retrieval using a concrete radialized spherical projection representation. Pattern. Recogn. 2007, 40, 2437-52.
40. Liu, Z.; Hua, J.; Xue, H.; Tian, H.; Chen, Y.; Liu, H. Body weight estimation for pigs based on 3D hybrid filter and convolutional neural network. Sensors 2023, 23, 7730.
41. Zhang, M.; Zhang, L.; Takis Mathiopoulos, P.; Ding, Y.; Wang, H. Perception-based shape retrieval for 3D building models. ISPRS. J. Photogramm. Remote. Sens. 2013, 75, 76-91.
42. Lu, J.; Guo, H.; Du, A.; et al. 2-D/3-D fusion-based robust pose normalisation of 3-D livestock from multiple RGB-D cameras. Biosyst. Eng. 2022, 223, 129-41.
43. Wang, K.; Guo, H.; Liu, W.; Ma, Q.; Su, W.; Zhu, D. Extraction method of pig body size measurement points based on rotation normalization of point cloud. Trans. Chin. Soc. Agric. Eng. 2017, 33, 253-9.
44. Guo, H.; Li, Z.; Ma, Q.; et al. A bilateral symmetry based pose normalization framework applied to livestock body measurement in point clouds. Comput. Electron. Agric. 2019, 160, 59-70.
45. Li, J.; Ma, W.; Li, Q.; Xue, X.; Wang, Z. Automatic acquisition and target extraction of beef cattle 3D point cloud from complex environment. Smart. Agric. 2022, 4, 64-76.
46. Yin, L.; Cai, G.; Tian, X.; et al. 3D point cloud reconstruction and morphometric measurement of pig bodies using multi-view depth cameras. Trans. Chin. Soc. Agric. Eng. 2019, 35, 201-8.
47. Jin, B.; Wang, G.; Feng, J.; et al. PointStack based 3D automatic body measurement for goat phenotypic information acquisition. Biosyst. Eng. 2024, 248, 32-46.
48. Wang, S.; Jiang, H.; Qiao, Y.; Jiang, S. A method for obtaining 3D point cloud data by combining 2D image segmentation and depth information of pigs. Animals 2023, 13, 2472.
49. Kazhdan, M.; Bolitho, M.; Hoppe, H. Poisson surface reconstruction. In Proceedings of the fourth Eurographics symposium on Geometry processing, Cagliari, Italy; 2006; pp. 61-70. https://hhoppe.com/poissonrecon.pdf. (accessed 2026-04-27).
50. Bernardini, F.; Mittleman, J.; Rushmeier, H.; Silva, C.; Taubin, G. The ball-pivoting algorithm for surface reconstruction. IEEE. Trans. Vis. Comput. Graph. 1999, 5, 349-59.
51. Curless, B.; Levoy, M. A volumetric method for building complex models from range images. In Proceedings of the 23rd annual conference on Computer graphics and interactive techniques, New Orleans, USA; 1996; pp. 303-12. https://graphics.stanford.edu/papers/volrange/volrange.pdf. (accessed 2026-04-27).
52. Mildenhall, B.; Srinivasan, P. P.; Tancik, M.; Barron, J. T.; Ramamoorthi, R.; Ng, R. NeRF: representing scenes as neural radiance fields for view synthesis. Commun. ACM. 2022, 65, 99-106.
53. Kerbl, B.; Kopanas, G.; Leimkuehler, T.; Drettakis, G. 3D Gaussian Splatting for real-time radiance field rendering. ACM. Trans. Graph. 2023, 42, 1-14.
54. Wang, Y.; Huang, T.; Chen, H.; Lee, G. H. FreeSplat: generalizable 3D Gaussian Splatting towards free view synthesis of indoor scenes. arXiv 2024; arXiv:2405.17958. Available online: https://doi.org/10.48550/arXiv.2405.17958. (accessed 27 Apr 2026).
55. Nguyen, A. H.; Holt, J. P.; Knauer, M. T.; Abner, V. A.; Lobaton, E. J.; Young, S. N. Towards rapid weight assessment of finishing pigs using a handheld, mobile RGB-D camera. Biosyst. Eng. 2023, 226, 155-68.
56. Hakem, M.; Boulouard, Z.; Kissi, M. Classification of body weight in beef cattle via machine learning methods: a review. Procedia. Comput. Sci. 2022, 198, 263-8.
57. Tasdemir, S.; Urkmez, A.; Inal, S. Determination of body measurements on the Holstein cows using digital image analysis and estimation of live weight with regression analysis. Comput. Electron. Agric. 2011, 76, 189-97.
58. Al Ard Khanji, M. S.; Llorente, C.; Falceto, M. V.; et al. Using body measurements to estimate body weight in gilts. Can. J. Anim. Sci. 2018, 98, 362-7.
59. Wang, Y.; Yang, W.; Winter, P.; Walker, L. Walk-through weighing of pigs using machine vision and an artificial neural network. Biosyst. Eng. 2008, 100, 117-25.
60. Dang, C.; Choi, T.; Lee, S.; et al. Machine learning-based live weight estimation for Hanwoo cow. Sustainability 2022, 14, 12661.
61. Norouzzadeh, M. S.; Nguyen, A.; Kosmala, M.; et al. Automatically identifying, counting, and describing wild animals in camera-trap images with deep learning. Proc. Natl. Acad. Sci. U. S. A. 2018, 115, E5716-25.
62. Meckbach, C.; Tiesmeyer, V.; Traulsen, I. A promising approach towards precise animal weight monitoring using convolutional neural networks. Comput. Electron. Agric. 2021, 183, 106056.
63. Ruchay, A.; Kober, V.; Dorofeev, K.; Kolpakov, V.; Gladkov, A.; Guo, H. Live weight prediction of cattle based on deep regression of RGB-D images. Agriculture 2022, 12, 1794.
64. Kwon, K.; Park, A.; Lee, H.; Mun, D. Deep learning-based weight estimation using a fast-reconstructed mesh model from the point cloud of a pig. Comput. Electron. Agric. 2023, 210, 107903.
65. Li, G.; Liu, X.; Ma, Y.; Wang, B.; Zheng, L.; Wang, M. Body size measurement and live body weight estimation for pigs based on back surface point clouds. Biosyst. Eng. 2022, 218, 10-22.
66. Bai, L.; Guo, C.; Song, J. Cattle weight estimation model through readily photos. Eng. Appl. Artif. Intell. 2025, 143, 109976.
67. Zhu, J.; Chen, Z.; Yin, L.; et al. Posture standardization of pig point cloud based on skeleton extraction and transformation. Int. J. Agric. Biol. Eng. 2025, 18, 83-91.
68. Lu, Z.; Liao, Y.; Li, J. Translation-based multimodal learning: a survey. Intell. Robot. 2025, 5, 783-804.
69. Dong, X.; Zhang, C.; Wang, P.; et al. A novel dual-network approach for real-time liveweight estimation in precision livestock management. Adv. Sci. 2025, 12, e2417682.
70. Yang, L.; Jiang, T.; Gui, X.; Duan, Q. Automated body measurement of beef cattle based on keypoint detection and local point cloud clustering. Meas. Sci. Technol. 2024, 35, 126013.
71. He, W.; Mi, Y.; Ding, X.; Liu, G.; Li, T. Two-stream cross-attention vision transformer based on RGB-D images for pig weight estimation. Comput. Electron. Agric. 2023, 212, 107986.
72. Hyndman, R. J.; Koehler, A. B. Another look at measures of forecast accuracy. Int. J. Forecast. 2006, 22, 679-88.
73. Chicco, D.; Warrens, M. J.; Jurman, G. The coefficient of determination R-squared is more informative than SMAPE, MAE, MAPE, MSE and RMSE in regression analysis evaluation. PeerJ. Comput. Sci. 2021, 7, e623.
74. Chaaban, C. R.; Berry, N. T.; Armitano-Lago, C.; Kiefer, A. W.; Mazzoleni, M. J.; Padua, D. A. Combining inertial sensors and machine learning to predict vGRF and knee biomechanics during a double limb jump landing task. Sensors 2021, 21, 4383.
75. Tu, G. J.; Jørgensen, E. Vision analysis and prediction for estimation of pig weight in slaughter pens. Expert. Syst. Appl. 2023, 220, 119684.
76. Dohmen, R.; Catal, C.; Liu, Q. Image-based body mass prediction of heifers using deep neural networks. Biosyst. Eng. 2021, 204, 283-93.
77. Wei, Y.; Zhang, L.; Yang, F.; et al. Automatic measurement method of sheep body size based on 3D reconstruction and point cloud segmentation. Comput. Electron. Agric. 2025, 239, 110978.
78. Chu, M.; Liu, G.; Si, Y.; Feng, F. Predicting method of dairy cow weight based on three-dimensional reconstruction. Trans. Chin. Soc. Agric. Mach. 2020, 51, 378-84.
Cite This Article
How to Cite
Download Citation
Export Citation File:
Type of Import
Tips on Downloading Citation
Citation Manager File Format
Type of Import
Direct Import: When the Direct Import option is selected (the default state), a dialogue box will give you the option to Save or Open the downloaded citation data. Choosing Open will either launch your citation manager or give you a choice of applications with which to use the metadata. The Save option saves the file locally for later use.
Indirect Import: When the Indirect Import option is selected, the metadata is displayed and may be copied and pasted as needed.
About This Article
Copyright

Data & Comments
Data
0


Comments
Comments must be written in English. Spam, offensive content, impersonation, and private information will not be permitted. If any comment is reported and identified as inappropriate content by OAE staff, the comment will be removed without notice. If you have any queries or need any help, please contact us at support@oaepublish.com.