

fig3
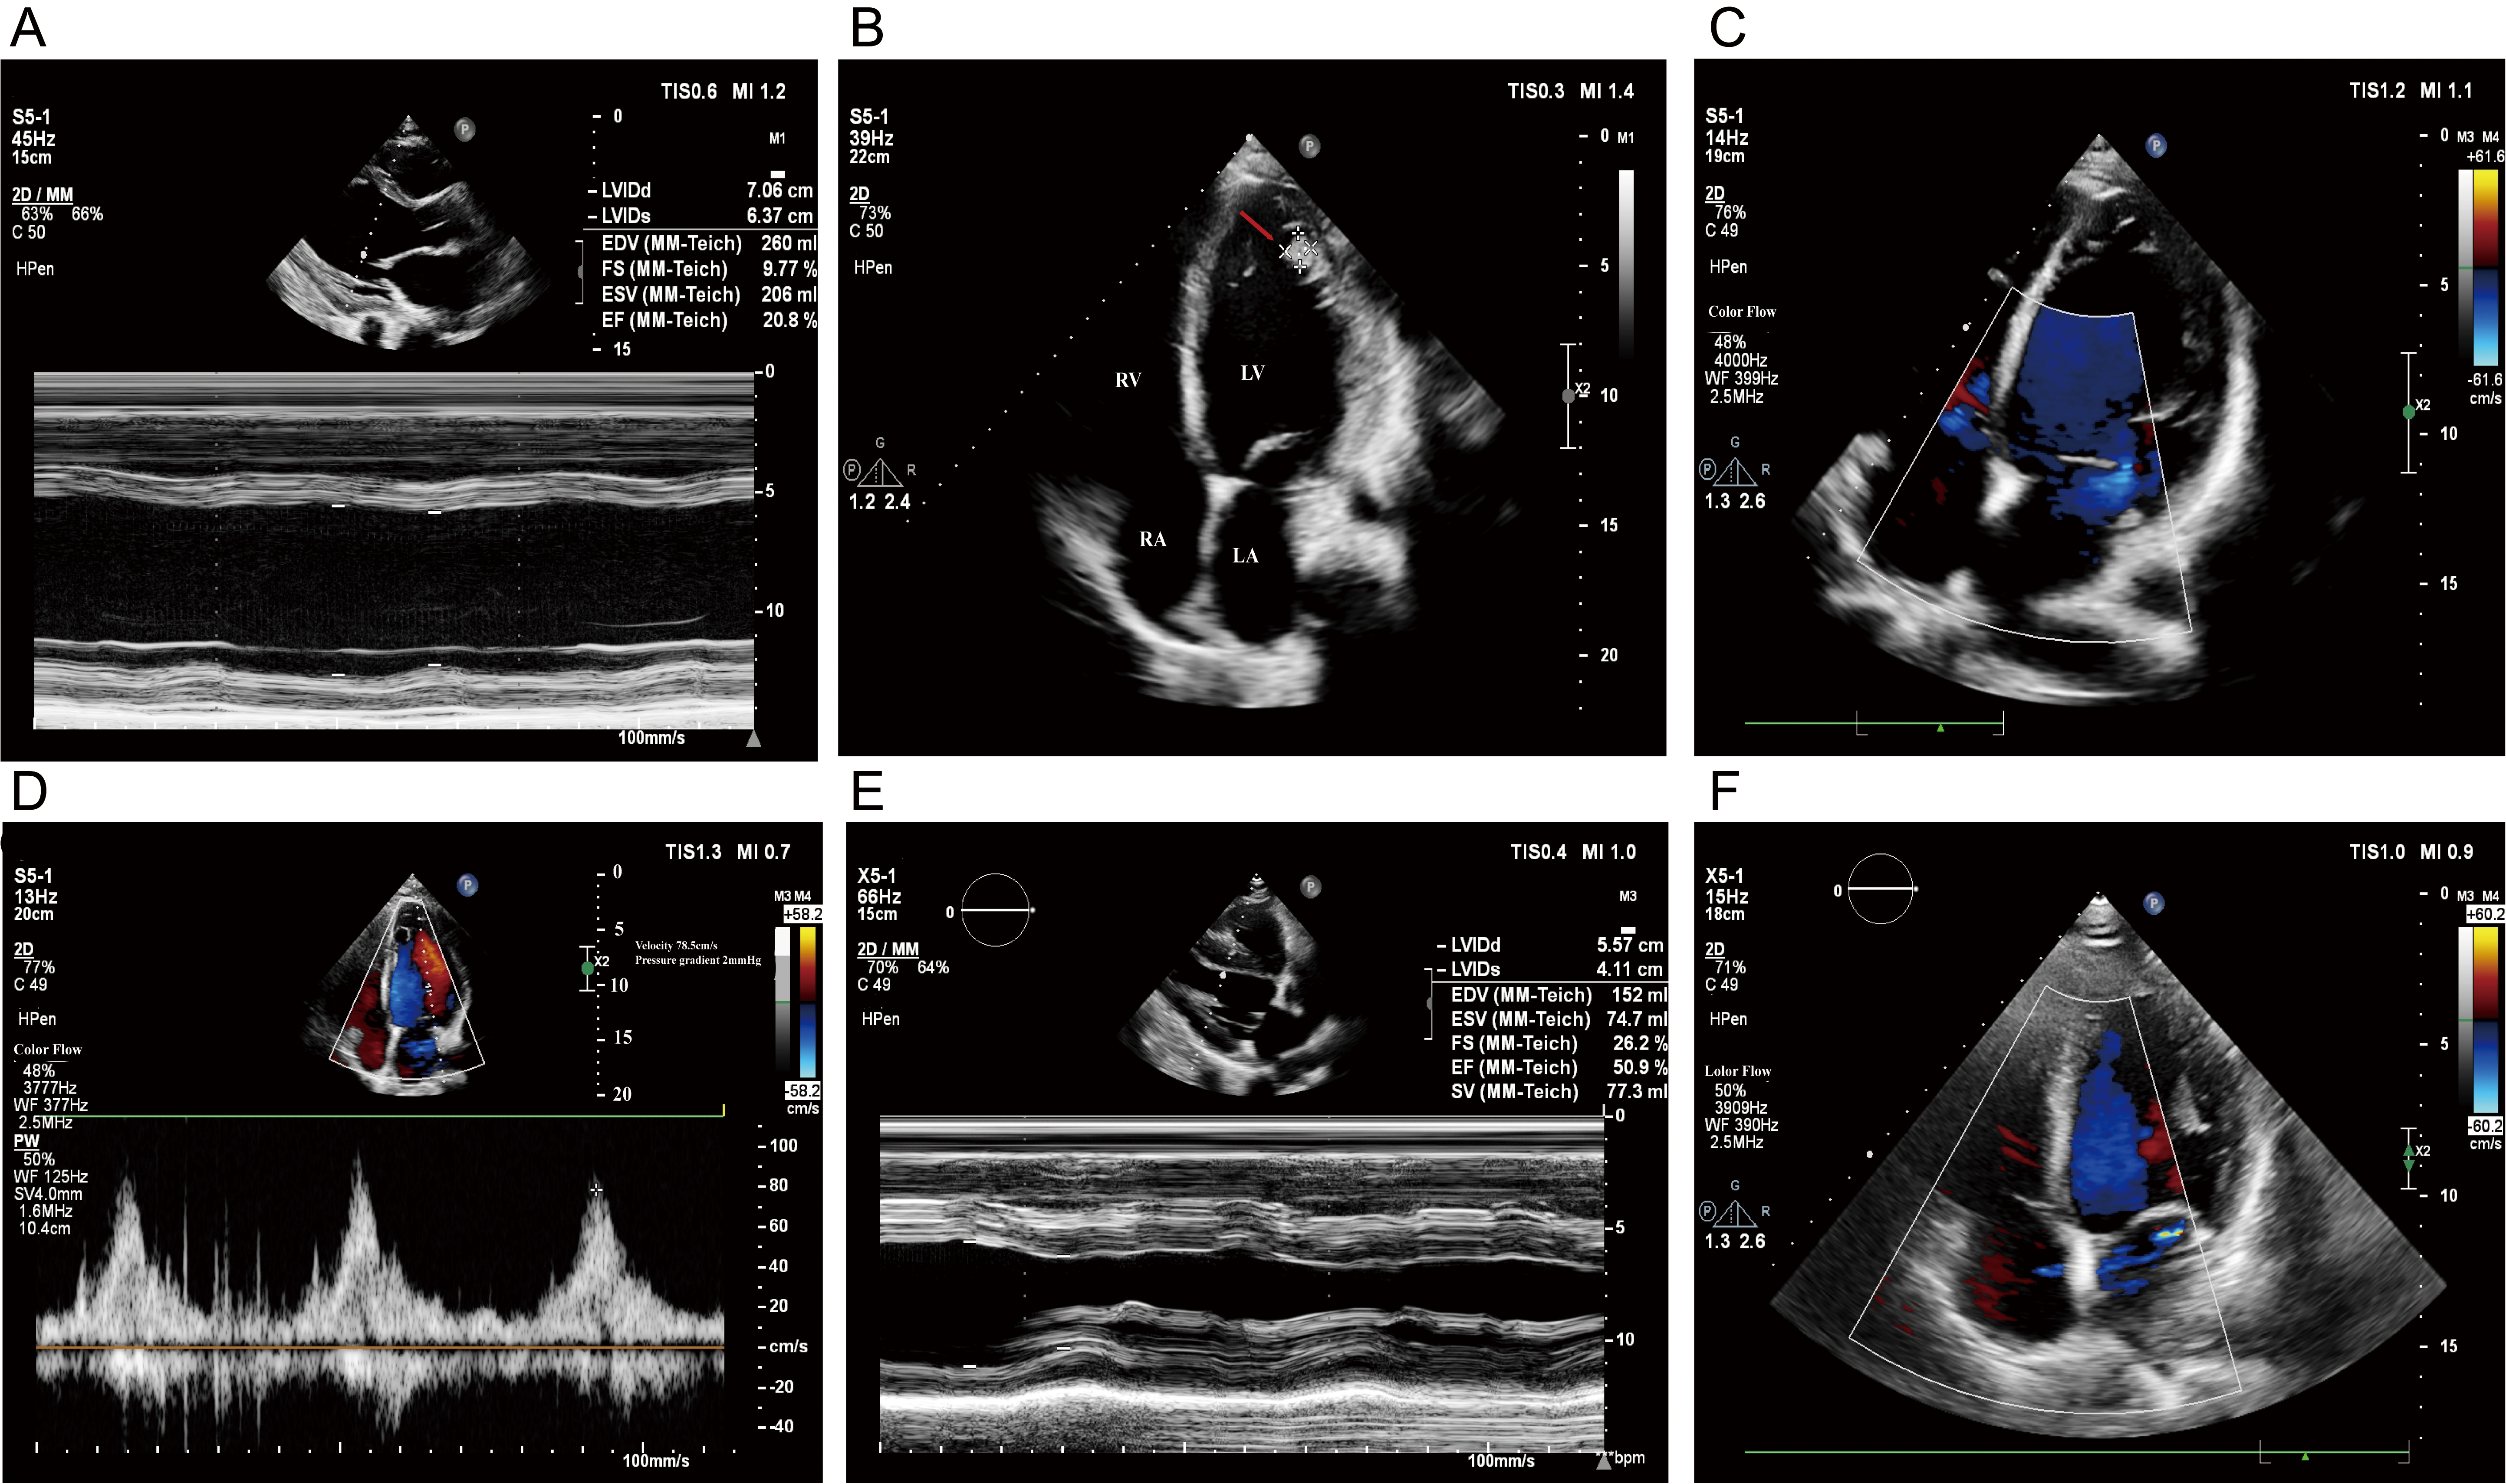
Figure 3. Serial echocardiographic images during follow-up. (A) Day 3: M-mode measurement of the left ventricle demonstrated reduced systolic function. (B) Day 3: Apical four-chamber view showing diffuse left ventricular enlargement and intraventricular thrombus formation. The thrombus is seen adjacent to the left ventricular wall (red arrow). (C) Day 17: Apical four-chamber view showing resolution of the left ventricular thrombus. (D) Day 30 follow-up: Apical four-chamber view showing mild reduction in left ventricular systolic and diastolic function. (E) Day 90 follow-up: M-mode measurement showing normalization of left ventricular systolic function. (F) Apical four-chamber view demonstrating restoration of normal chamber size. RA: Right atrium; RV: right ventricle; LA: left atrium; LV: left ventricle.