


fig5
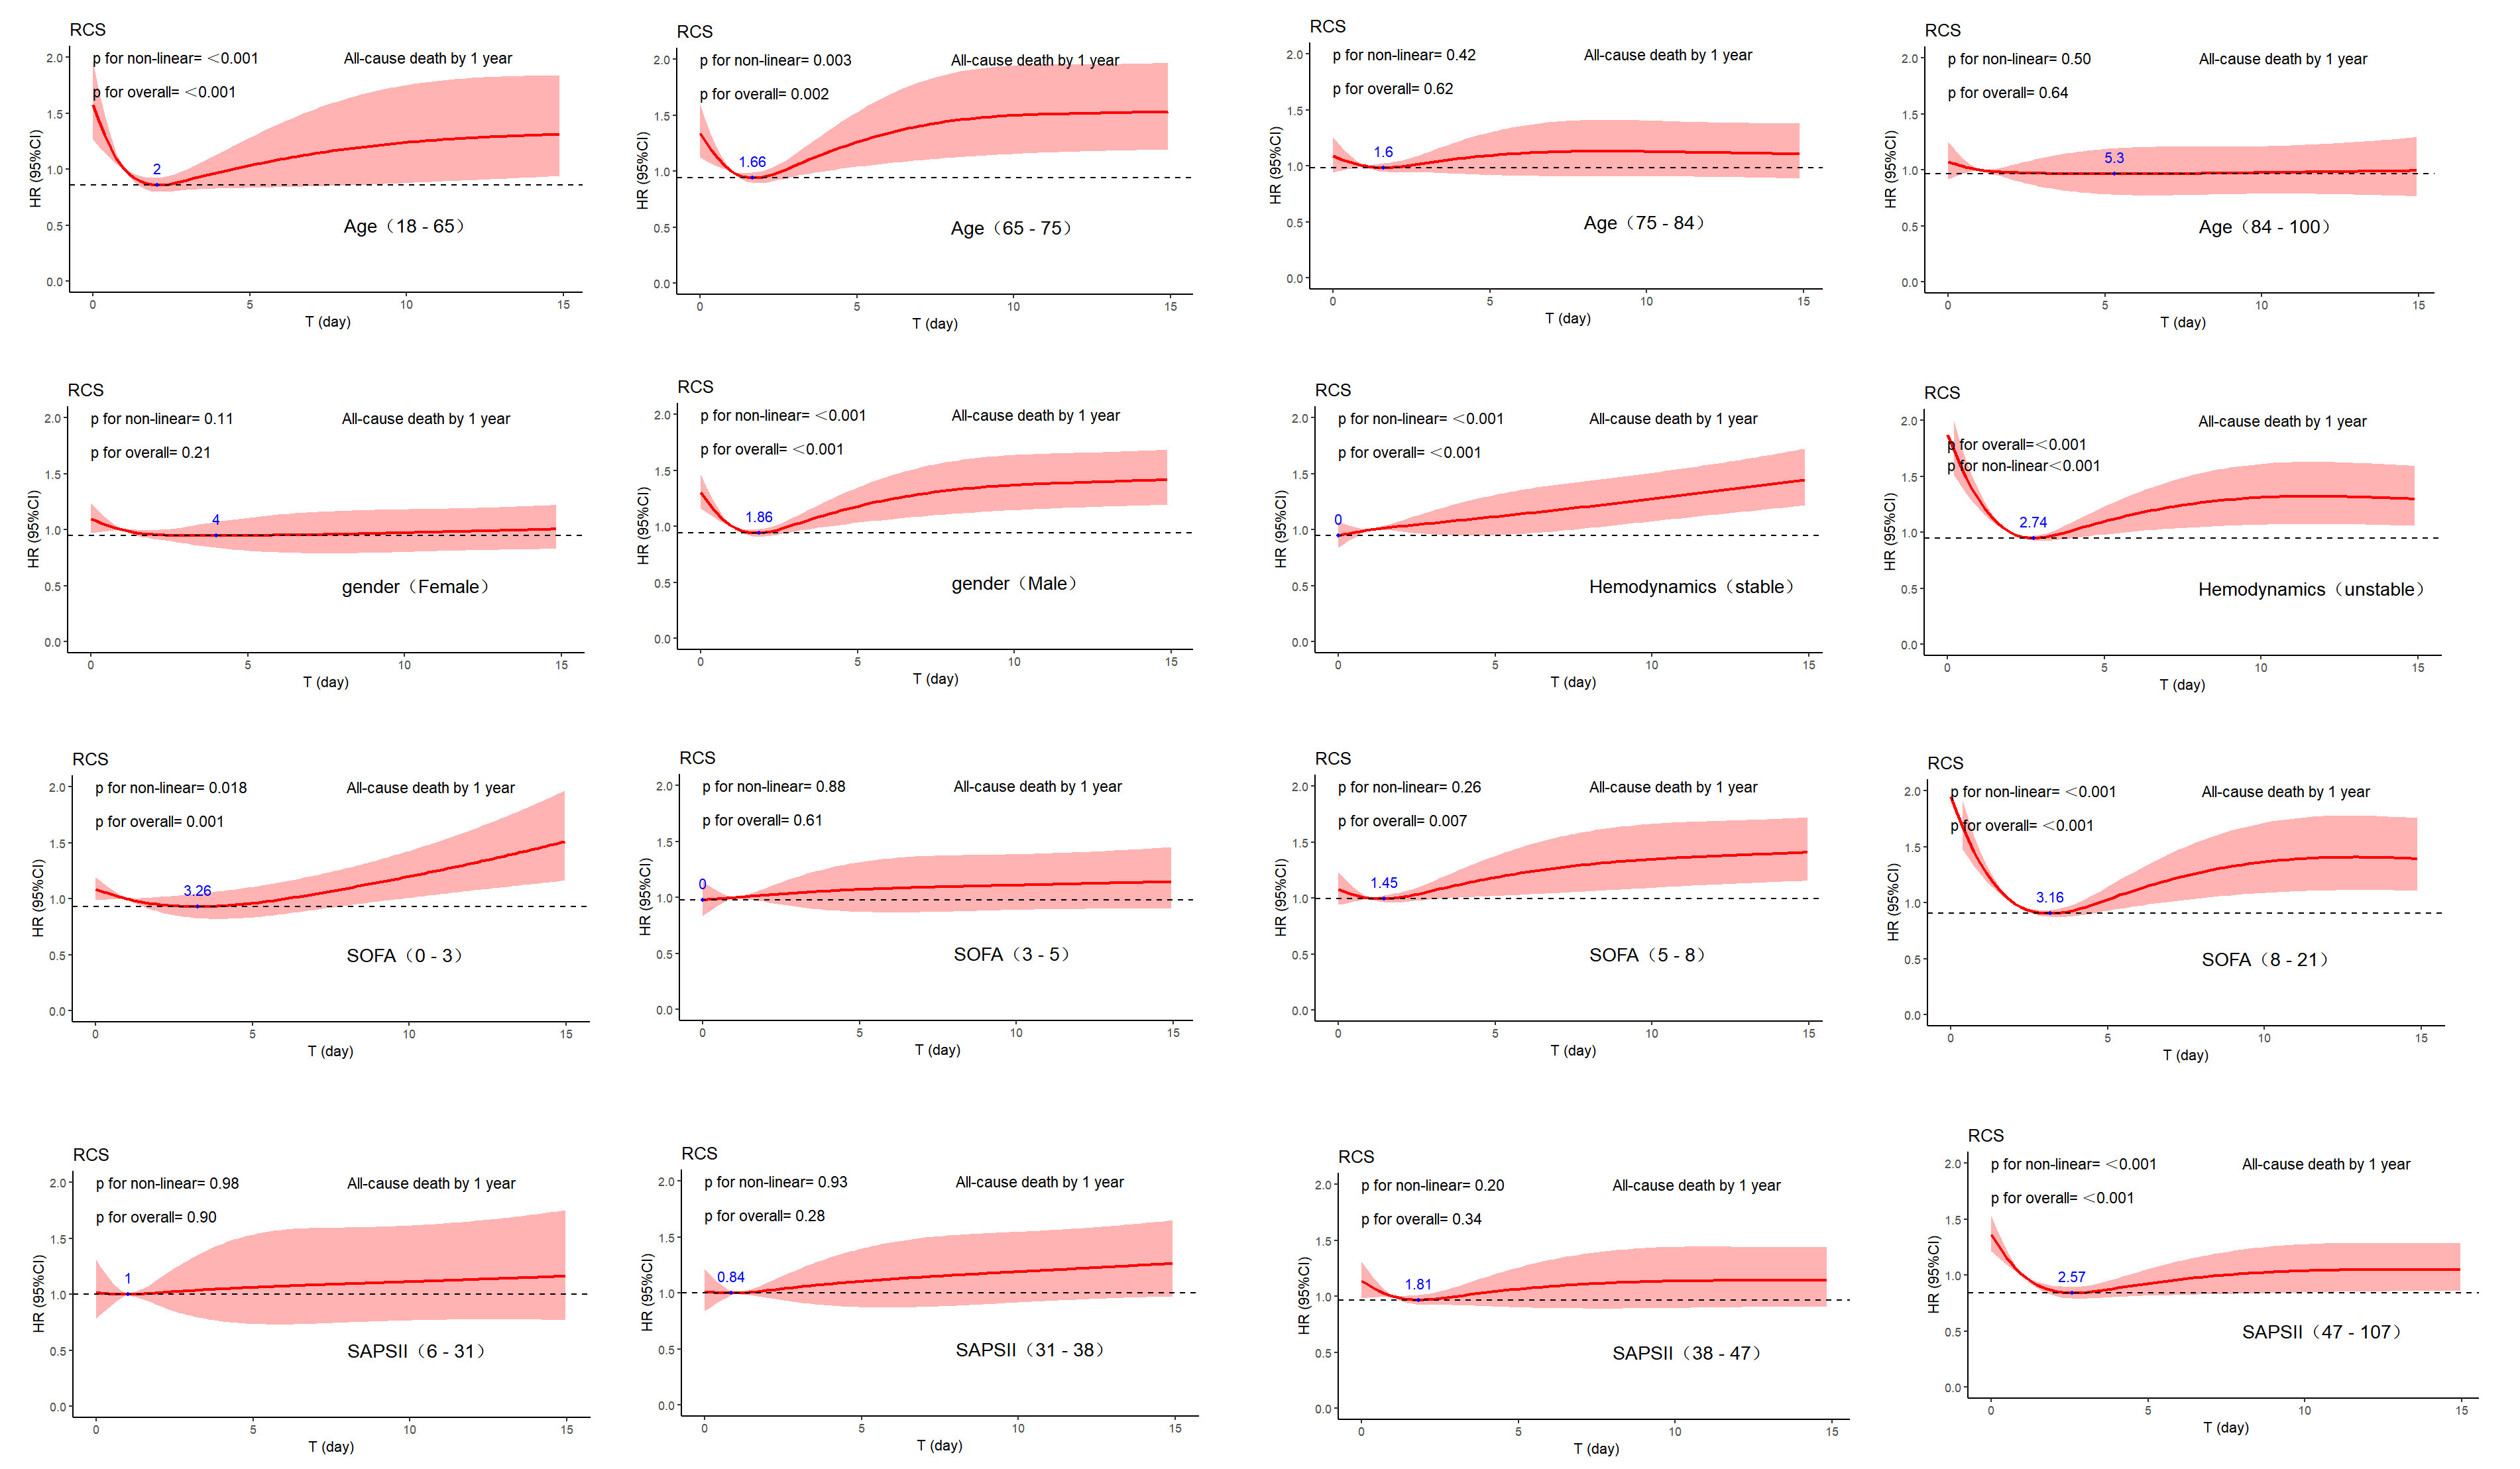
Figure 5. Association with GDMT initiation time and mortality in different patient groups. The restricted cubic splines have five knots at the 5th, 27.5th, 50th, 72.5th, and 95th percentiles to flexibly model the relationship between the timing of GDMT initiation and 1-year mortality, with the reference point being the median GDMT initiation time. The confounding variables adjusted for are consistent with those in the primary analysis. T represents the GDMT initiation time, and the dashed line represents the horizontal line at the HR value corresponding to the minimum point of the curve. The blue number indicates the T value at the minimum point of the curve. GDMT: Guideline-directed medical therapy; SOFA: sequential organ failure assessment; HR: hazard ratio; RCS: restricted cubic spline.




