

fig3
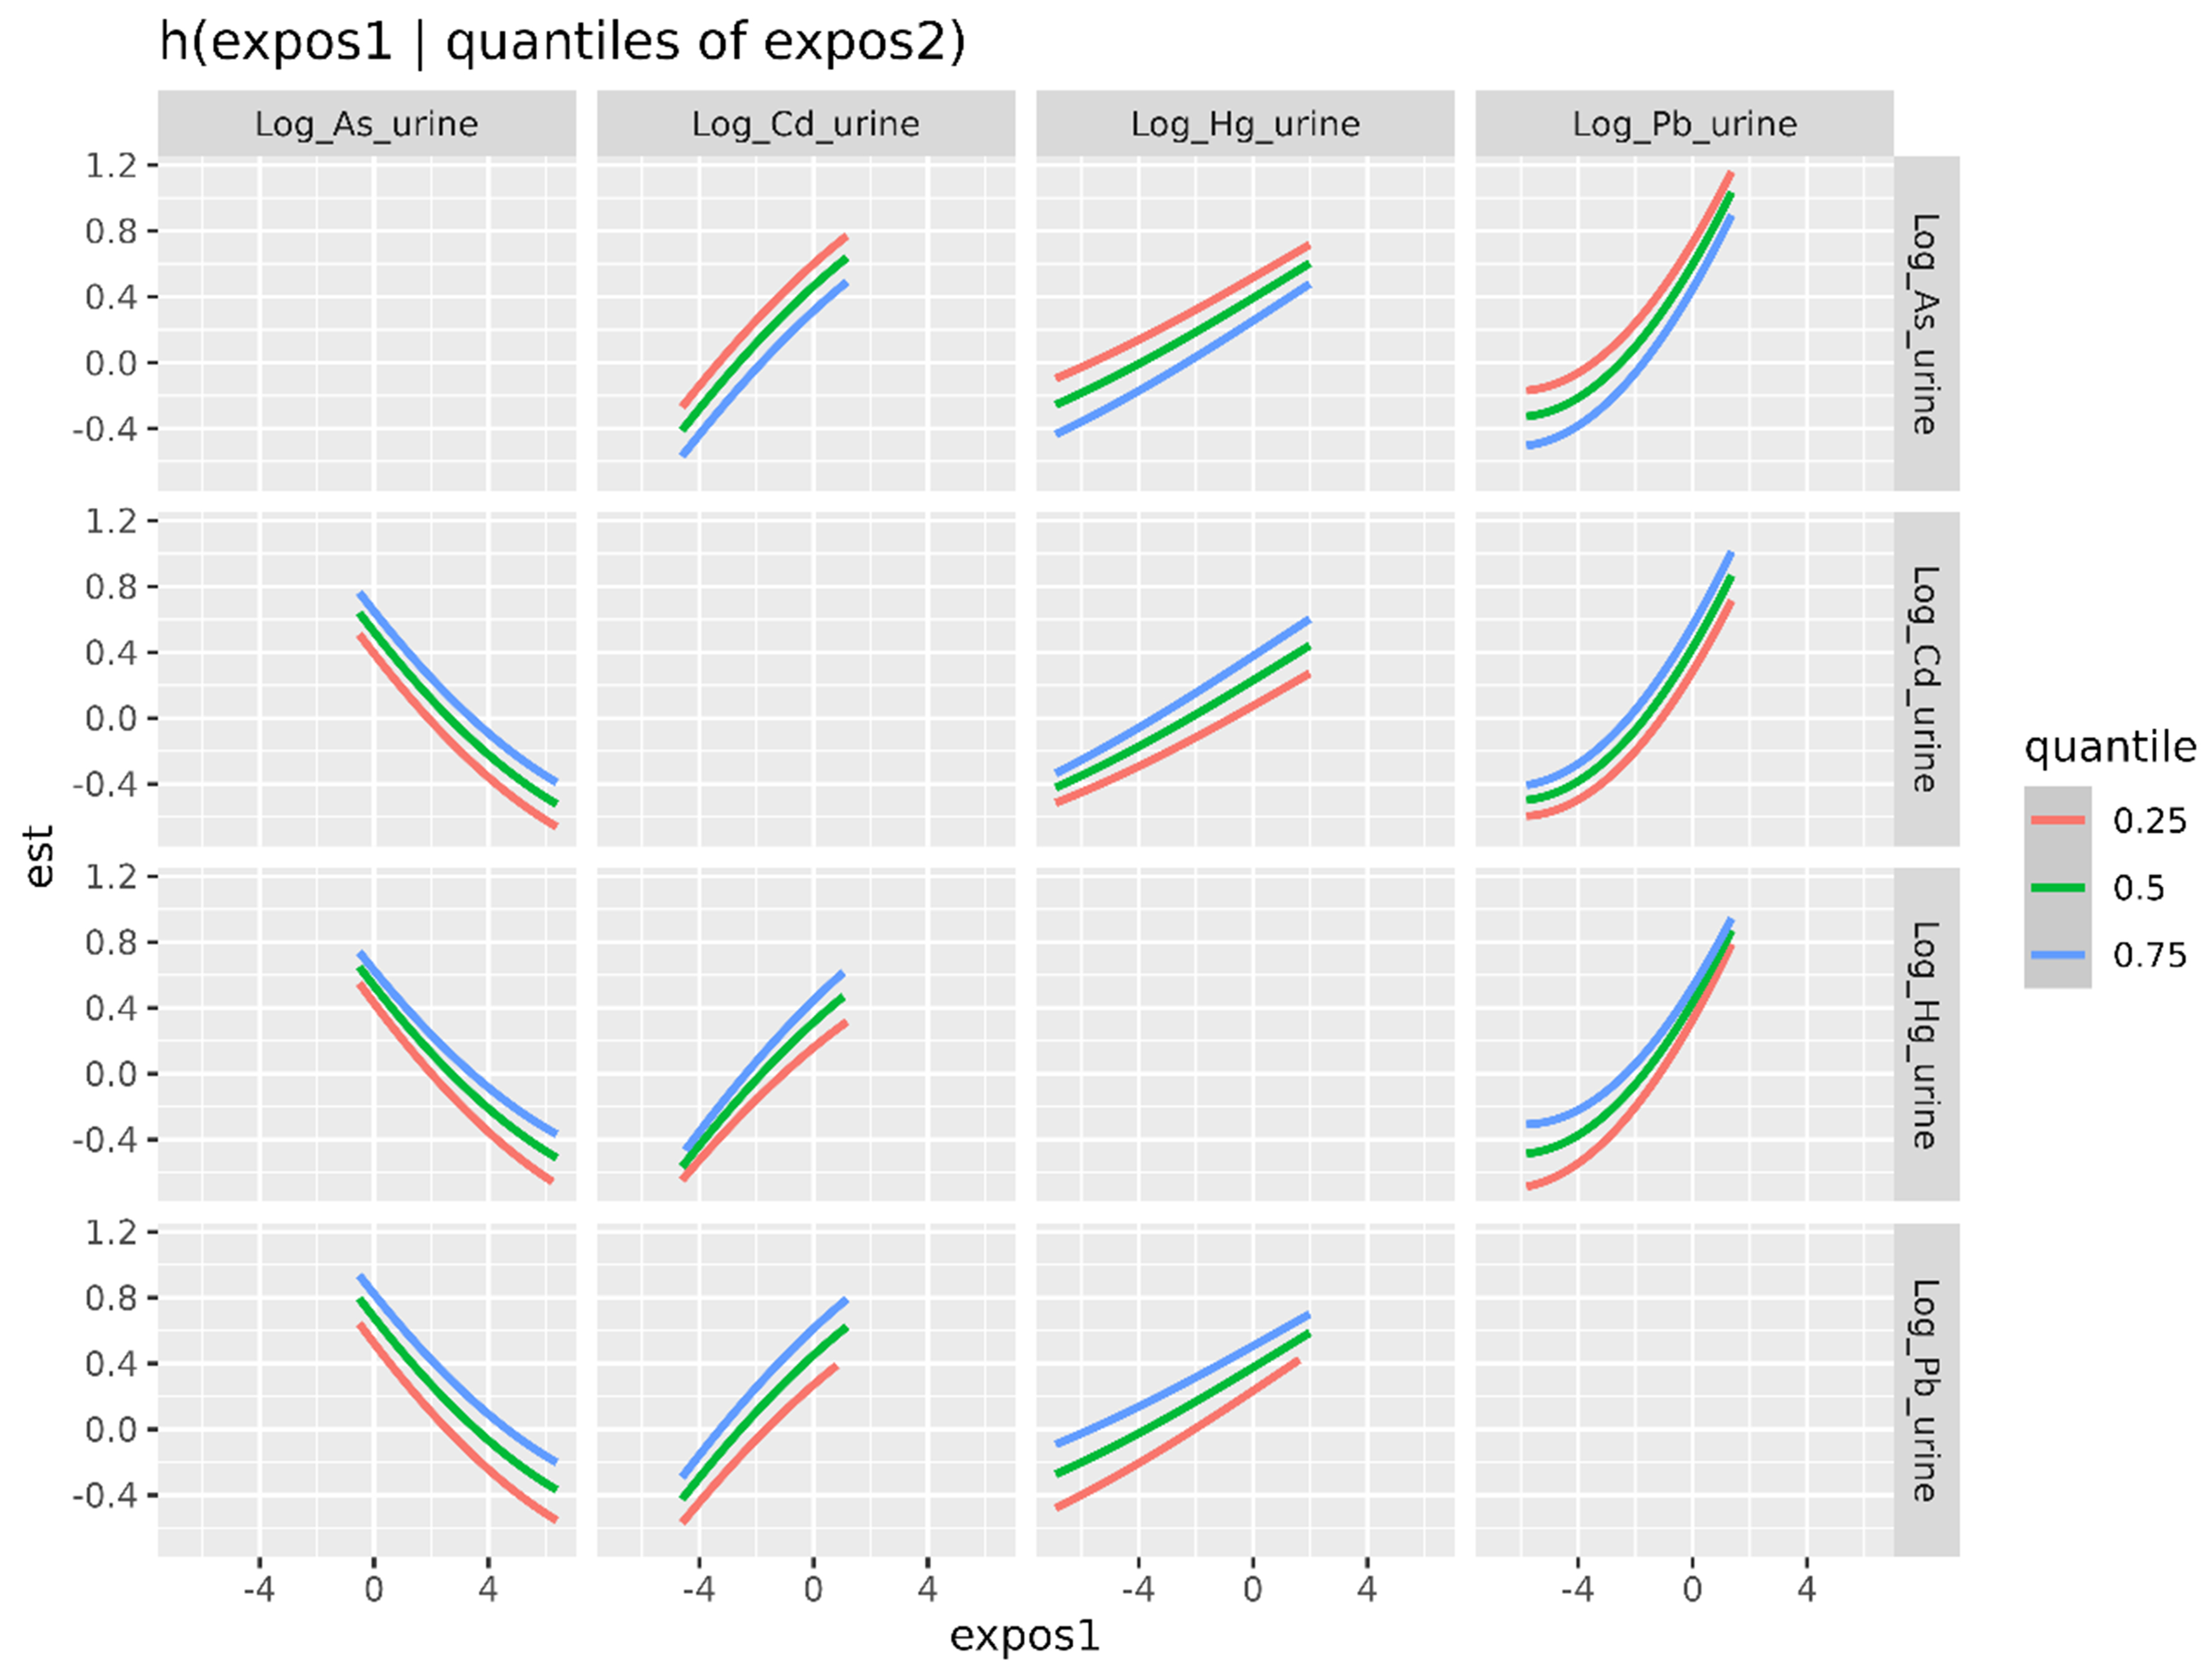
Figure 3. Bivariate exposure–response functions for urinary metal(loid) concentrations based on BKMR. Each panel illustrates the estimated effect of one log-transformed urinary metal(loid) concentration (horizontal axis, expos1) on the outcome (Box-Cox-transformed eGFR) (vertical axis, est), while fixing the log-transformed urinary concentration of a second metal(loid) (expos2, shown in each row) at the 25th (red), 50th (green), or 75th (blue) percentile. The other two log-transformed urinary metal(loid) concentrations are held fixed at their 50th percentile. BKMR: Bayesian Kernel Machine Regression; eGFR: estimated glomerular filtration rate.


