

fig5
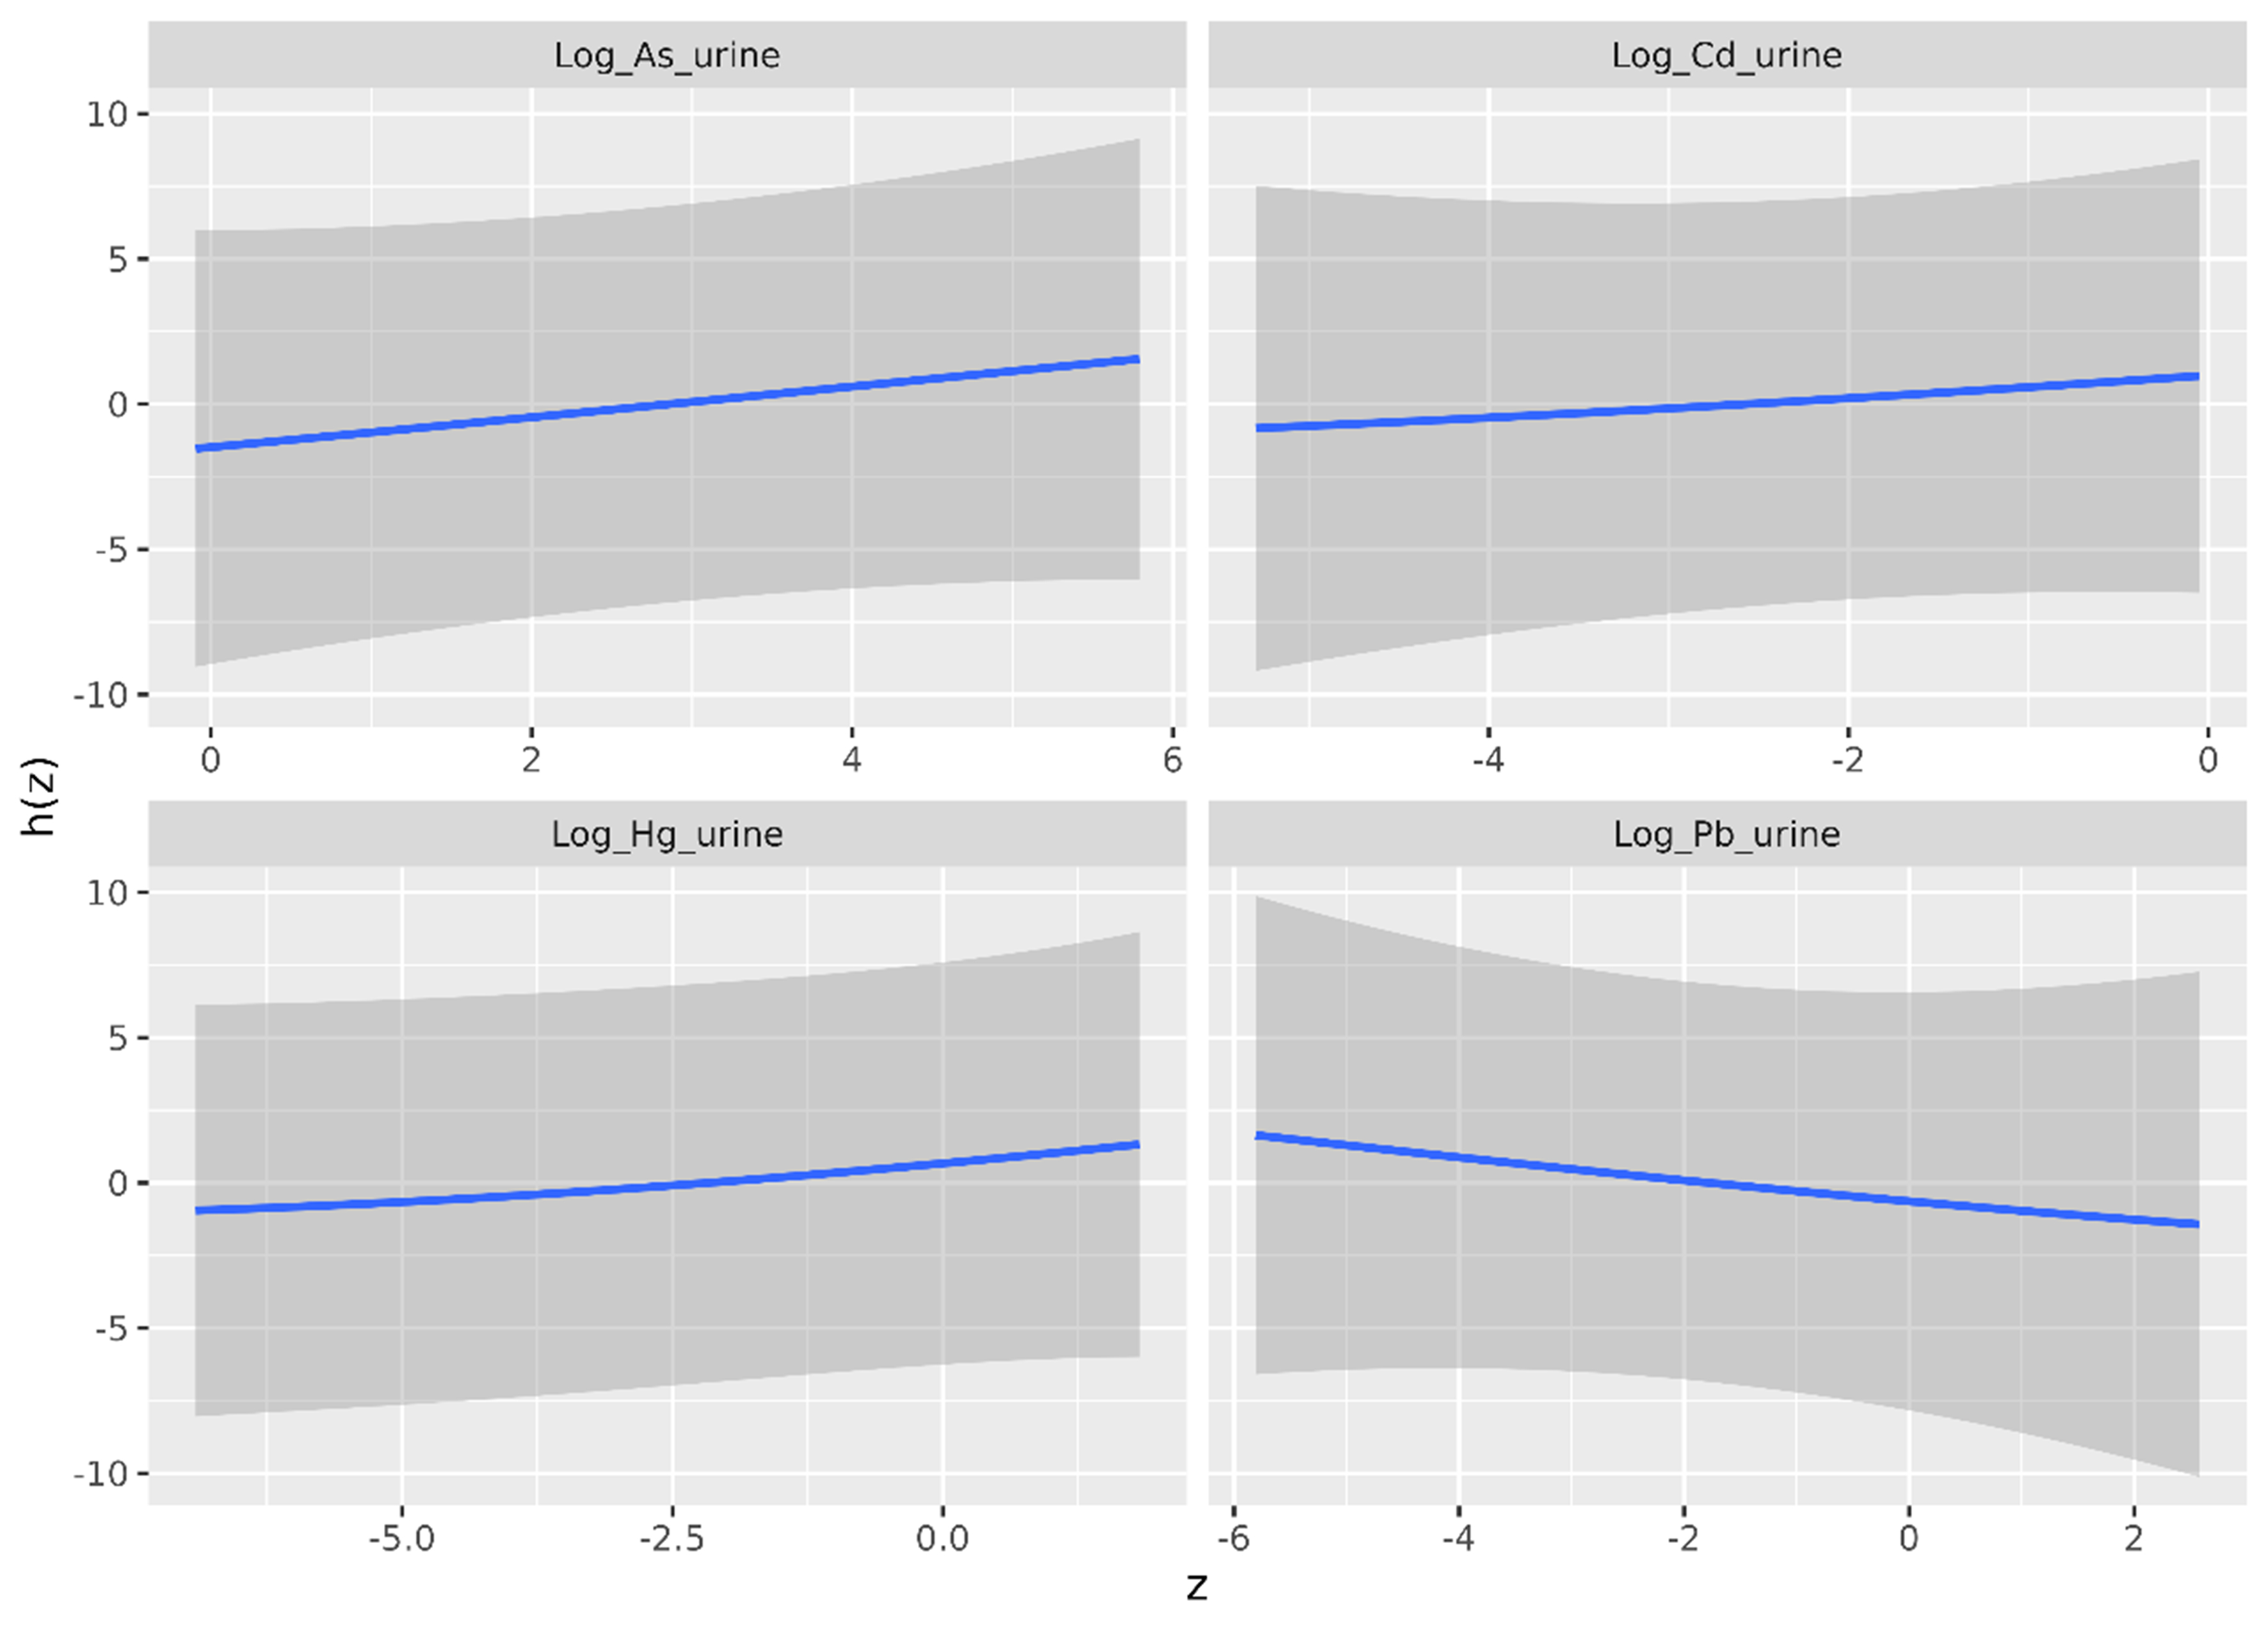
Figure 5. Univariate exposure-response association - estimate (blue line) and 95% credible interval (gray shaded area) - between each heavy metal(loid) and eGFR, as estimated by the BKMR model in the donor group. The horizontal axis shows the log-transformed urinary heavy metal(loid) concentration (z), whereas the vertical axis shows the contribution of z to eGFR [h(z)]. eGFR: Estimated glomerular filtration rate; BKMR: Bayesian Kernel Machine Regression.


