

fig3
From: Global associations between extreme temperature events and childhood cancer incidence and mortality
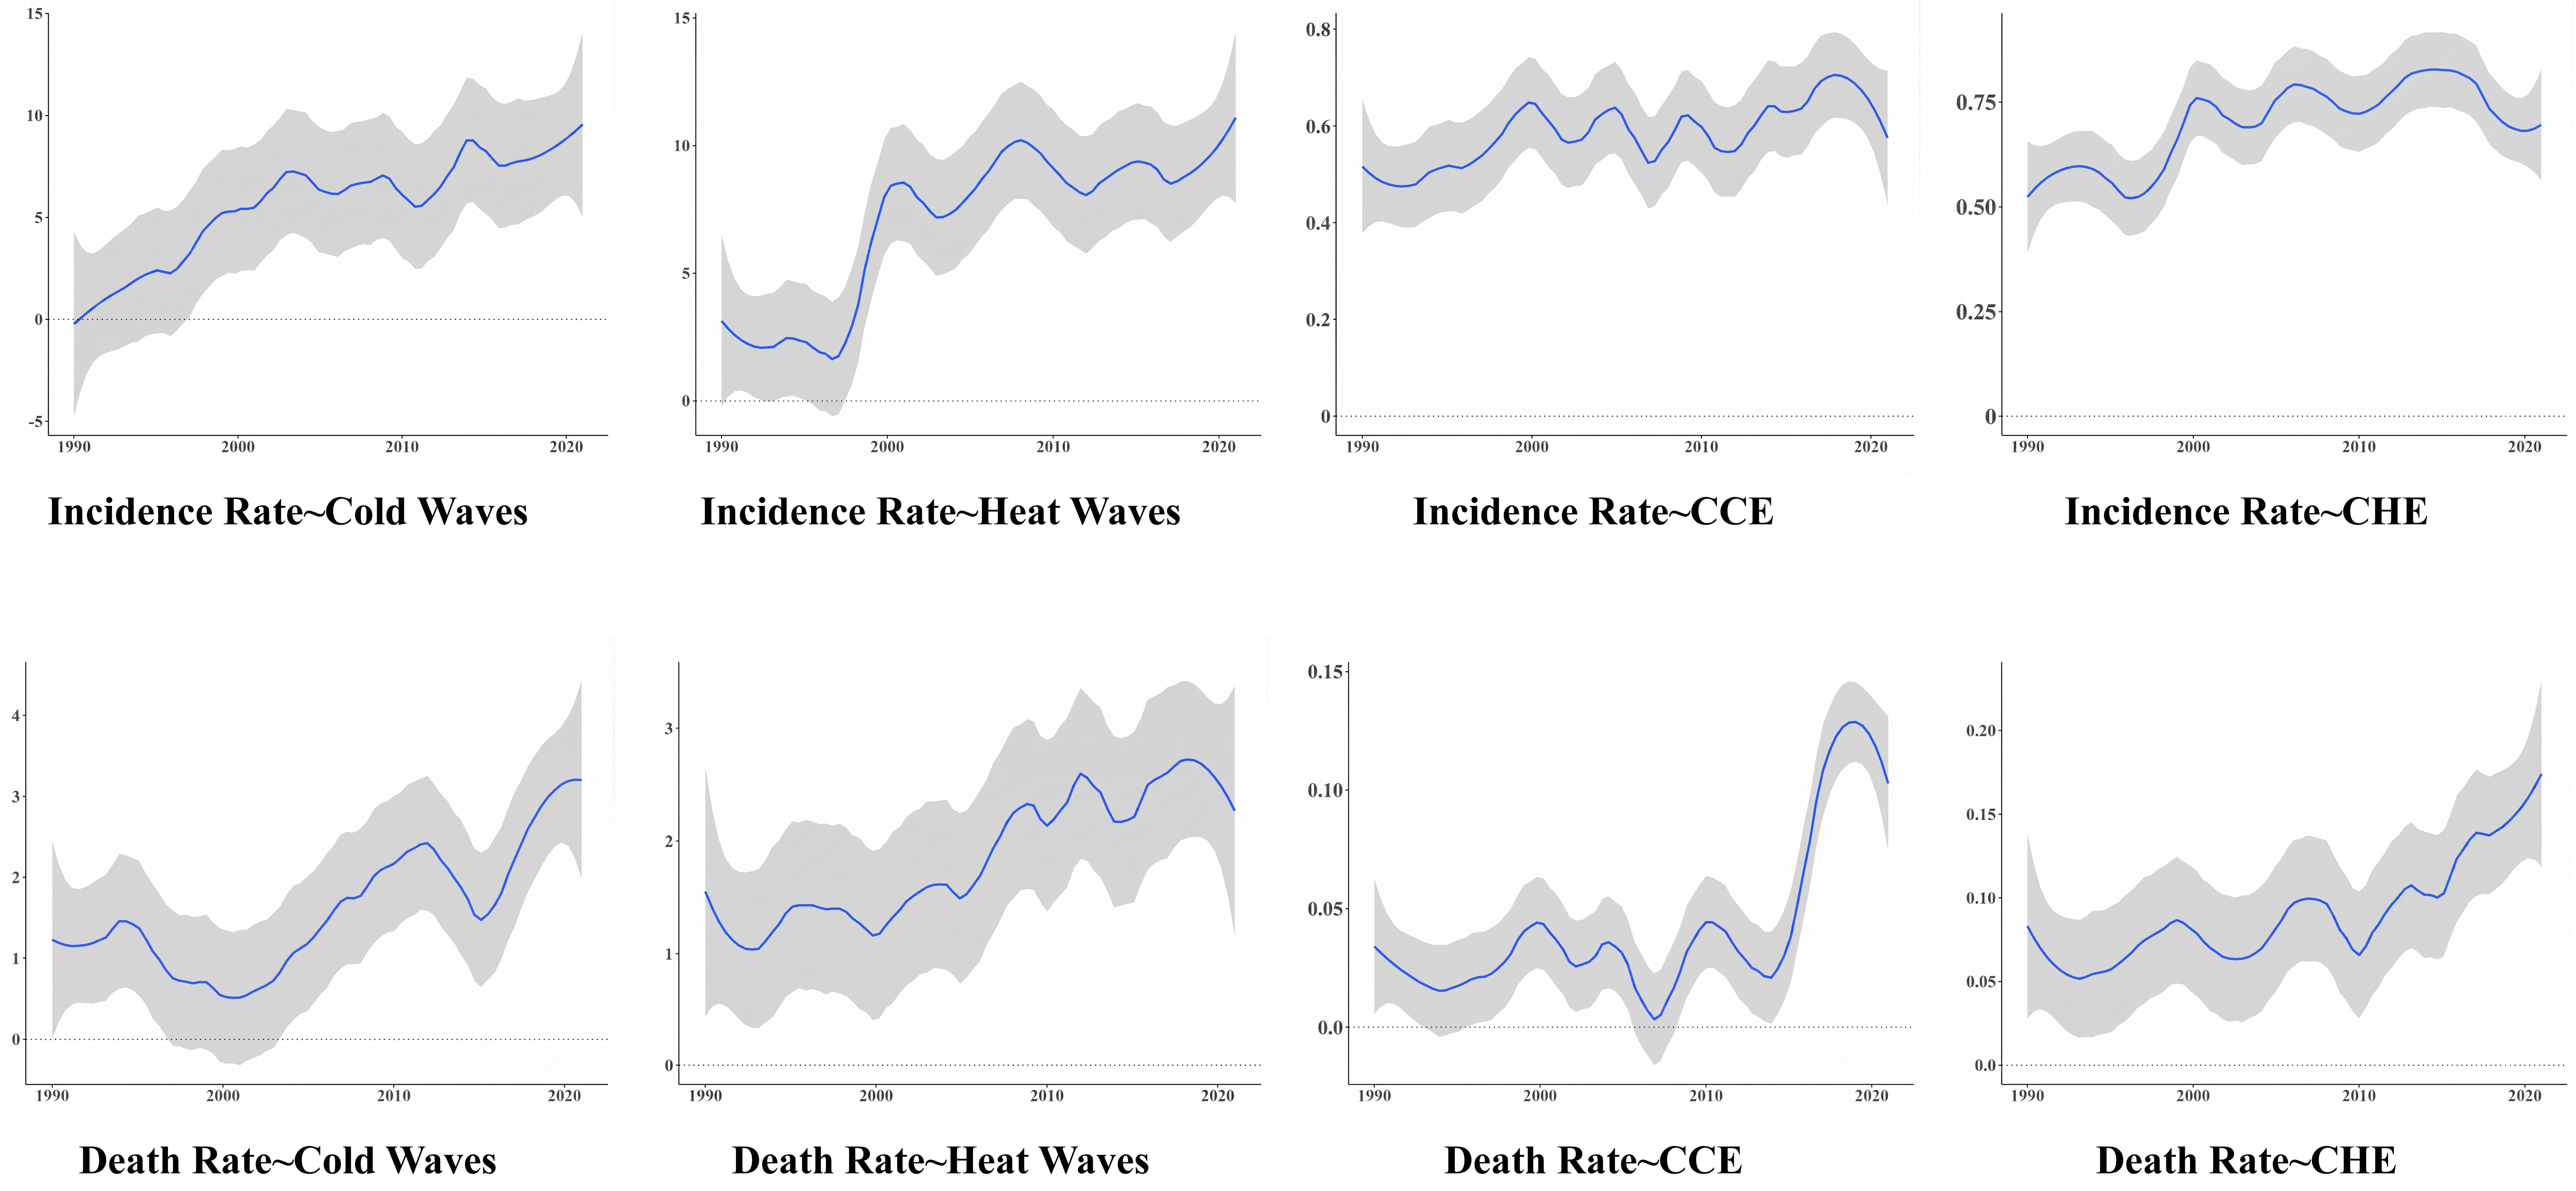
Figure 3. Longitudinal associations between exposure to various extreme temperatures or extreme temperature events and childhood cancer burden. The shaded area represents the 95%CIs. The X-axis indicates the specific year, while the Y-axis illustrates the association of extreme temperature events on the incidence and mortality rates of childhood cancer. Incidence and mortality rates are reported per 100,000 and per 10,000,000 population, respectively. CIs: Confidence intervals; CCE: cumulative cold exposure; CHE: cumulative heat exposure.