


fig5
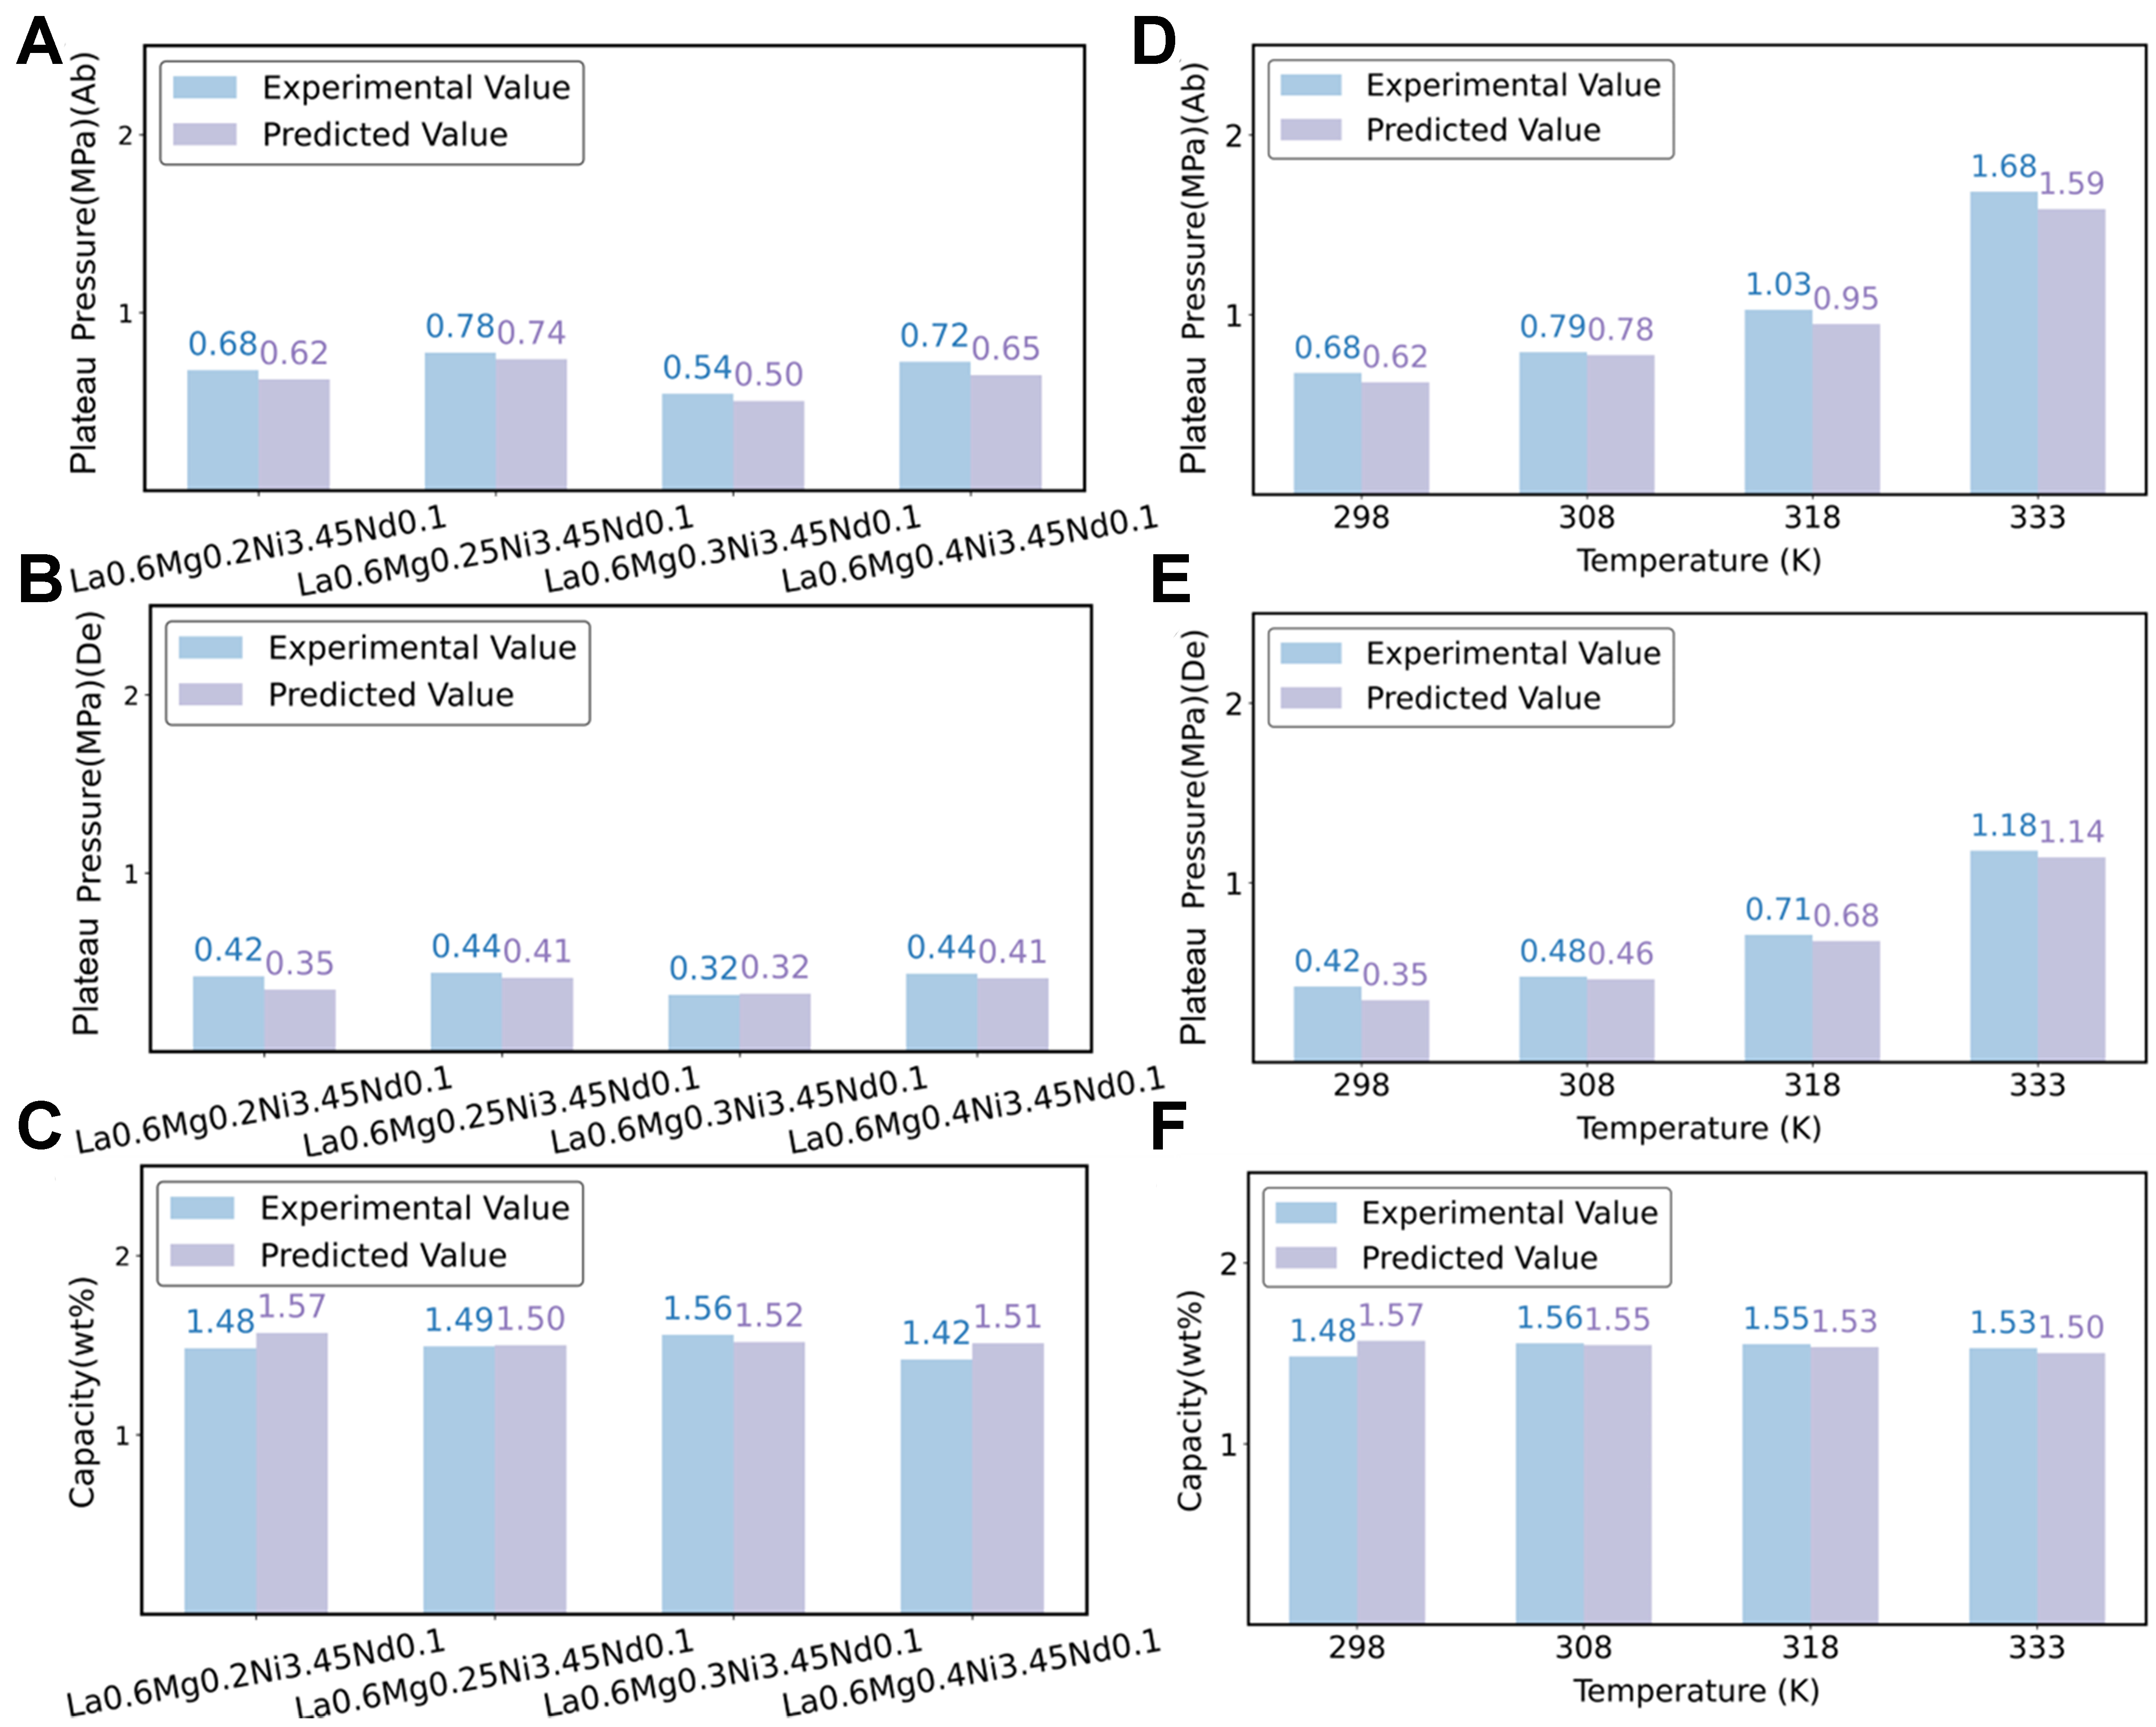
Figure 5. Comparison between experimental and predicted values for the alloys La0.6MgxNi3.45Nd0.1 (x = 0.2, 0.25, 0.3, 0.35, 0.4) at
Figure 5. Comparison between experimental and predicted values for the alloys La0.6MgxNi3.45Nd0.1 (x = 0.2, 0.25, 0.3, 0.35, 0.4) at


All published articles are preserved here permanently:
https://www.portico.org/publishers/oae/

