


fig2
From: Deciphering the strength-ductility trade-off in (CuNiMn)-X alloys via interpretable machine learning
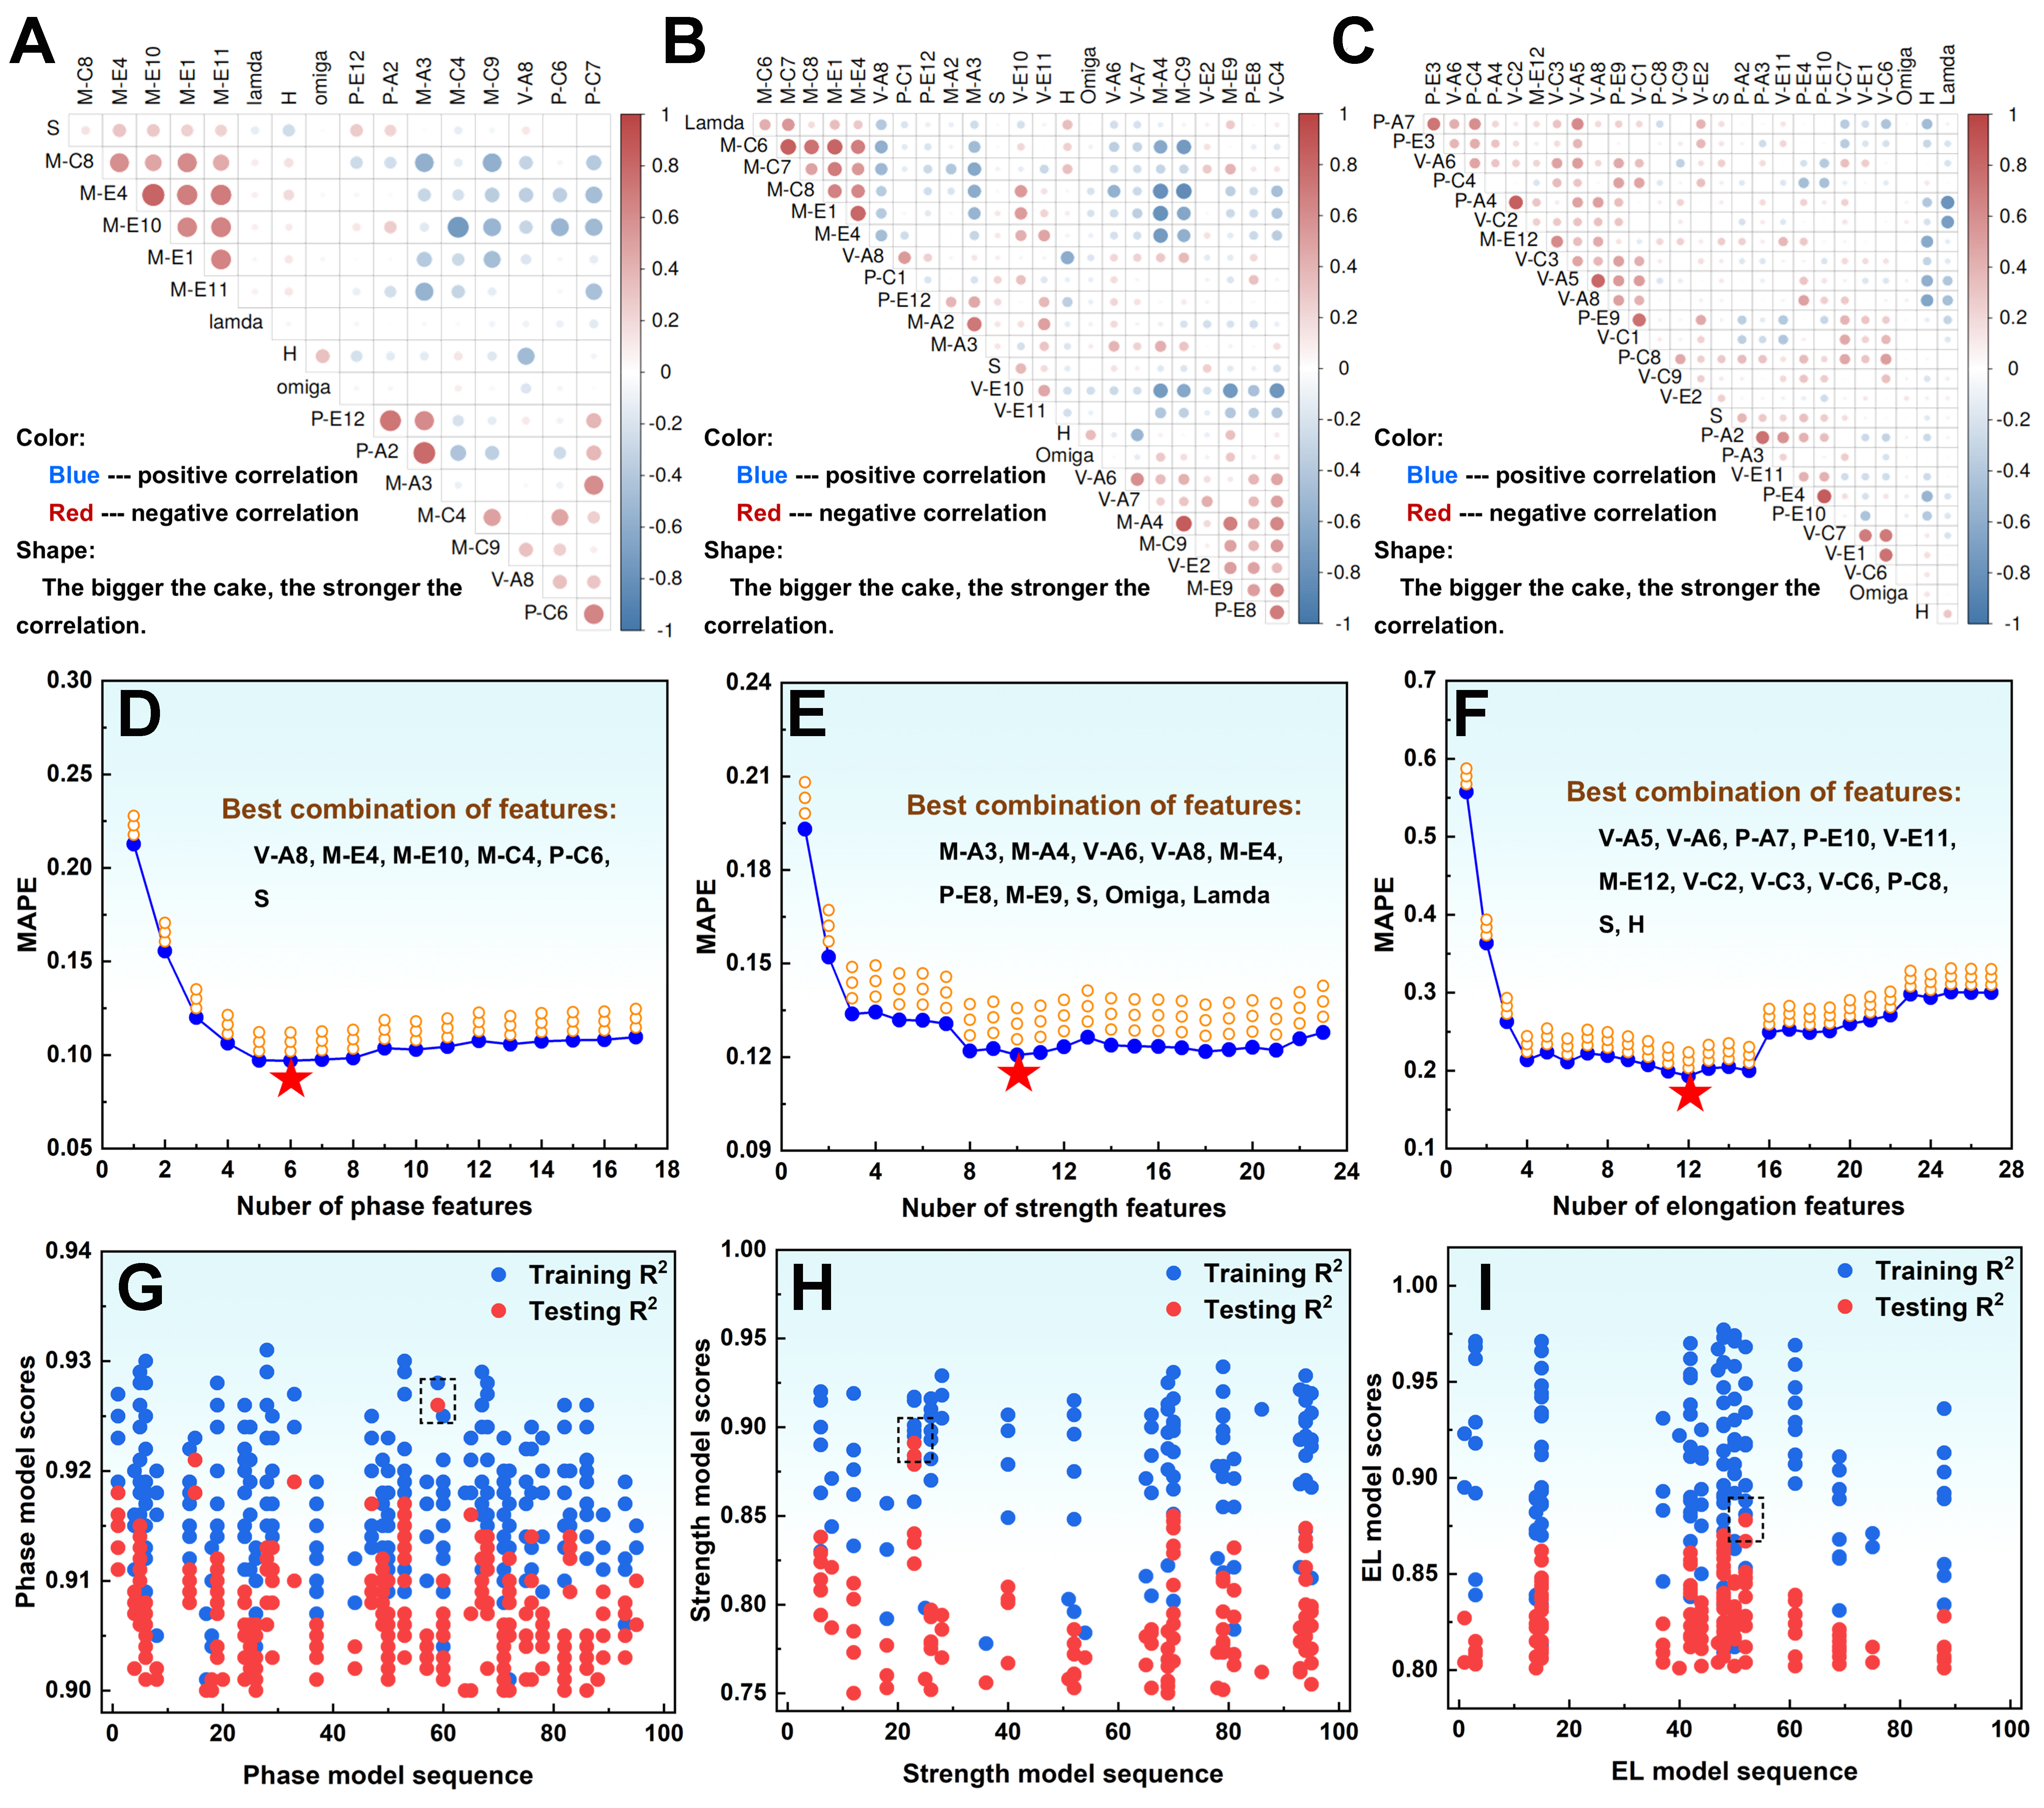
Figure 2. Feature selection results: feature correlation coefficients (A-C), recursive feature elimination results (D-F), and feature importance rankings (G-I) for phase type/microstructure (A, D, G), compressive strength (B, E, H), and fracture strain (C, F, I). MAPE: Mean absolute percentage error; R2: coefficient of determination; EL: compression deformation rate.


