


fig6
From: Deciphering the strength-ductility trade-off in (CuNiMn)-X alloys via interpretable machine learning
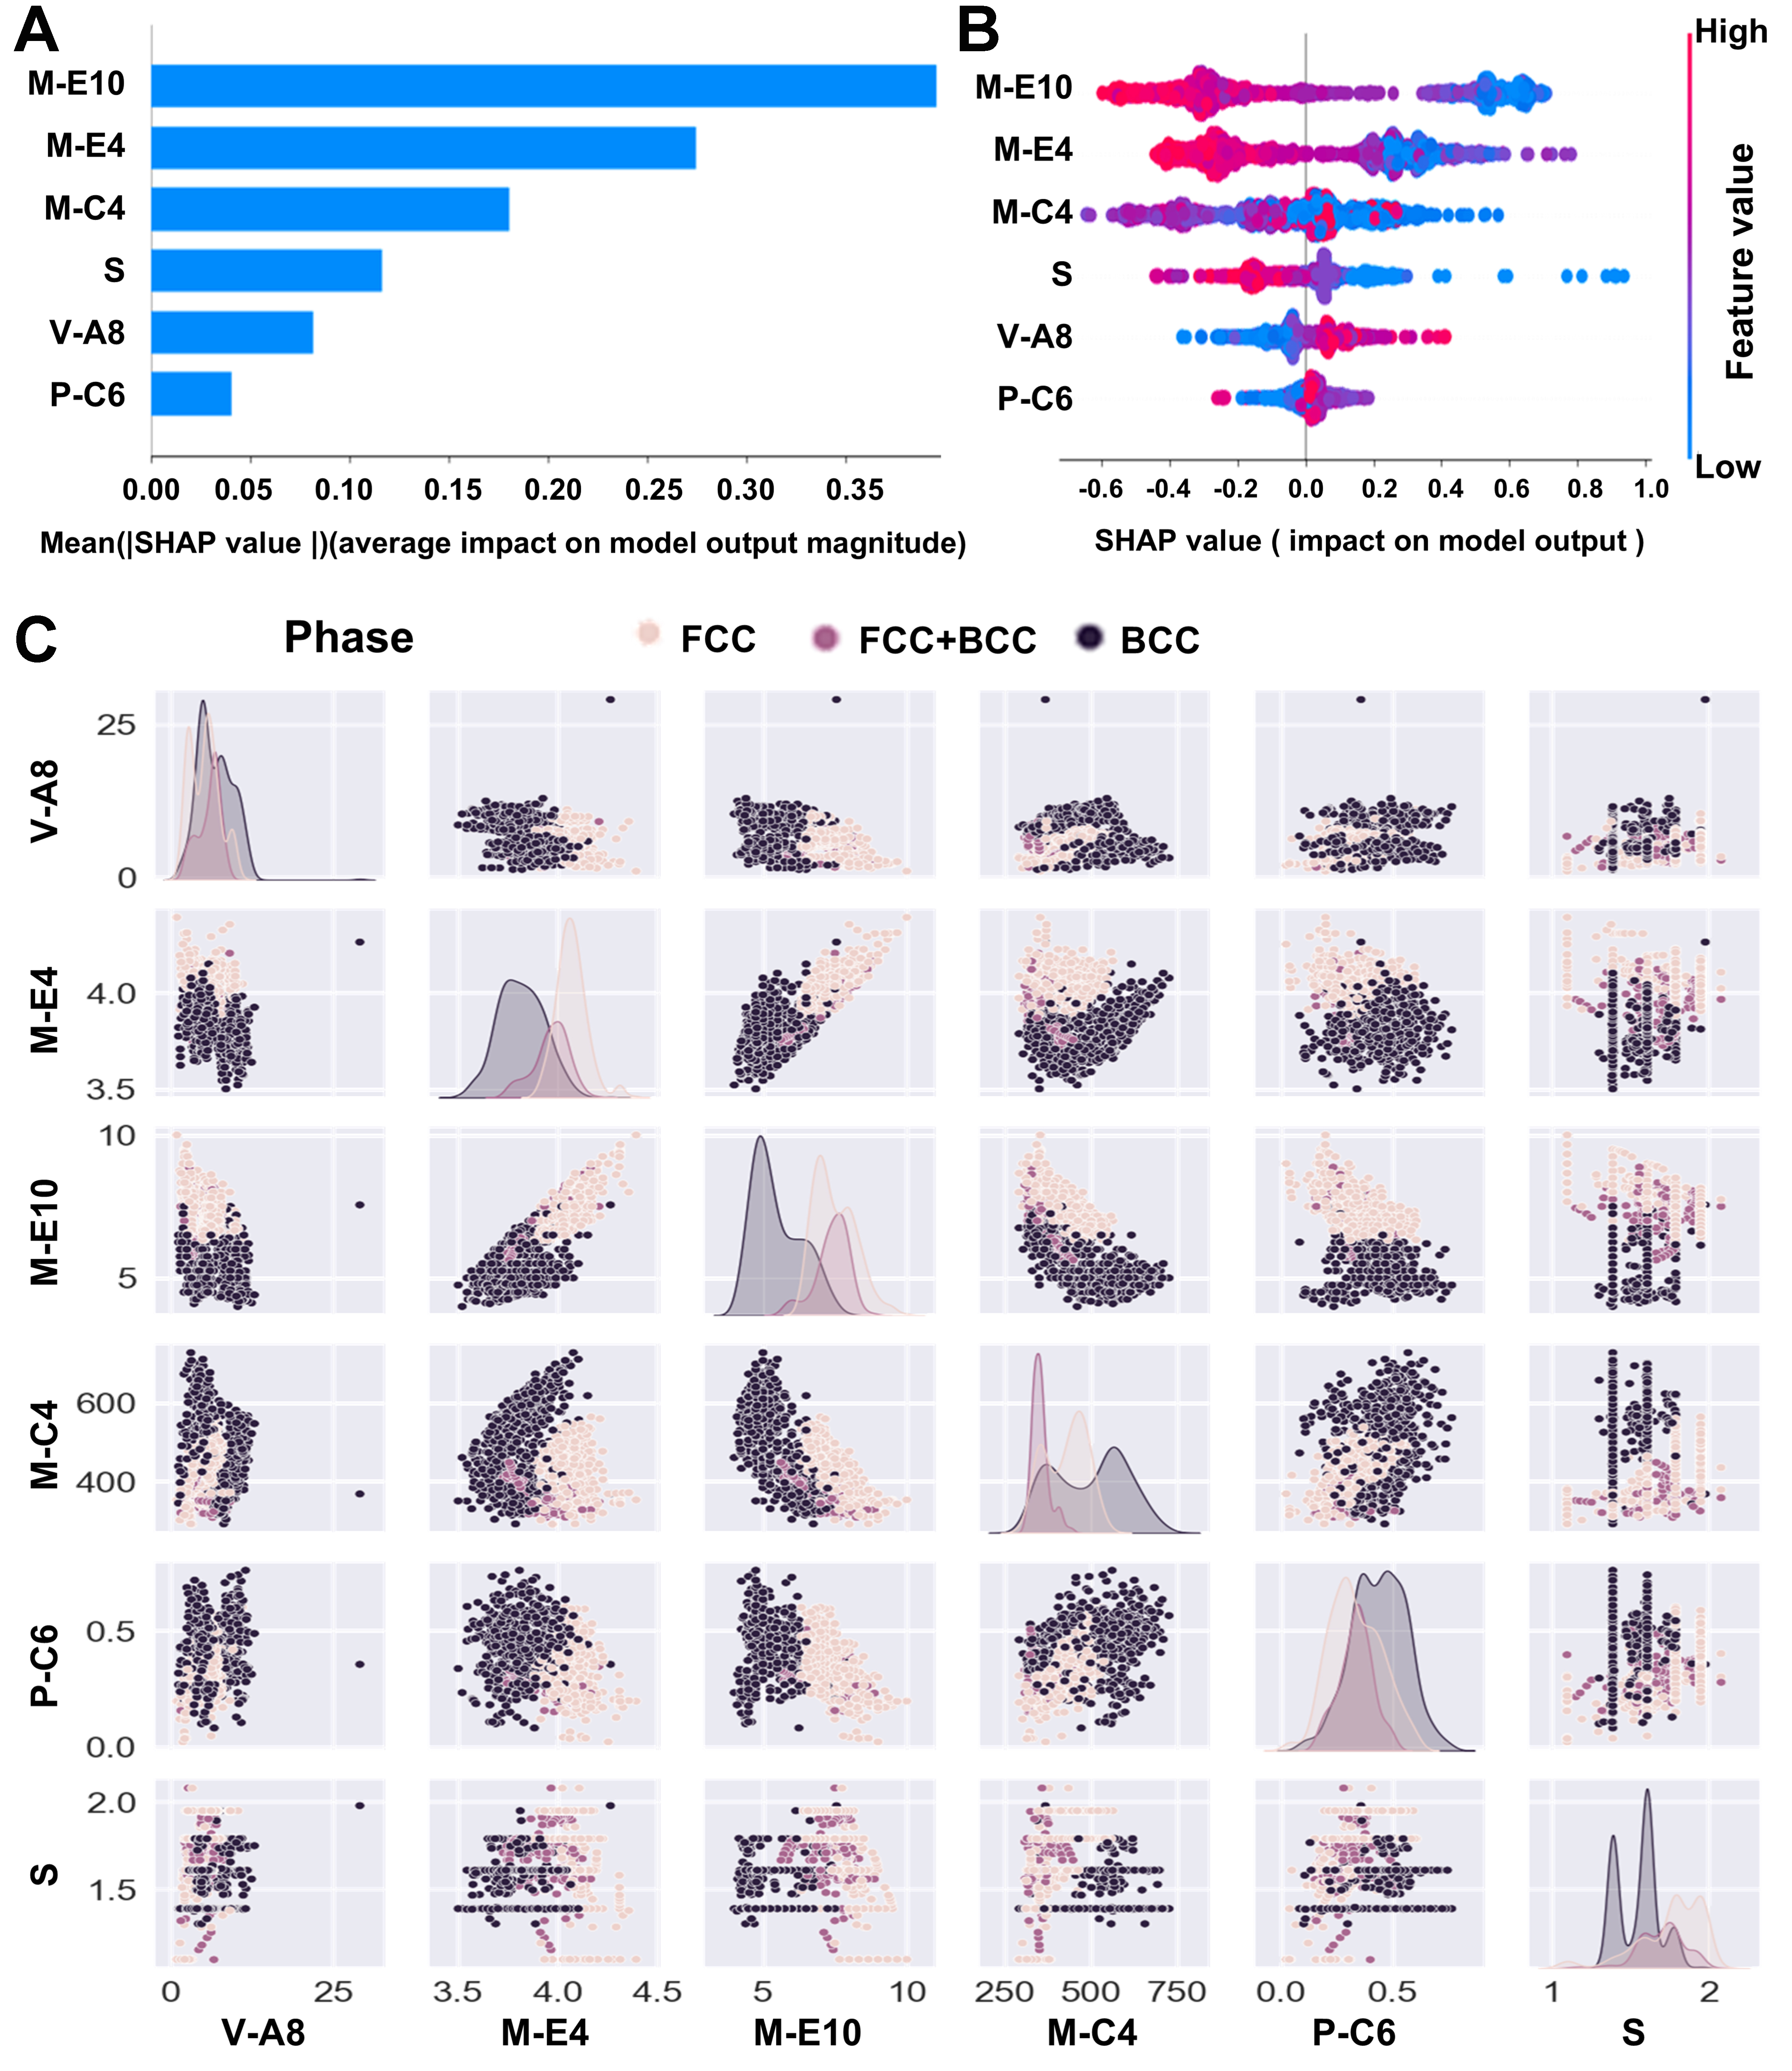
Figure 6. Relationship between phase type and feature factors. The phase model was treated as a multi-class classification model with three classes: BCC, BCC+FCC, and FCC. SHAP values were calculated based on the predicted class probabilities in a one-vs-rest manner. A positive SHAP value indicates an increase in the predicted probability of the corresponding phase class relative to the baseline probability, whereas a negative SHAP value indicates a decrease. (A) Class-specific SHAP feature importance; (B) SHAP summary plot for the phase probability output; and (C) Feature distribution of different phase categories. BCC: Body-centered cubic; FCC: face-centered cubic; SHAP: SHapley Additive exPlanations.


