


fig10

Machine-learning-enabled composition–process co-design of heat-resistant cast aluminum alloys with superior elevated-temperature strength

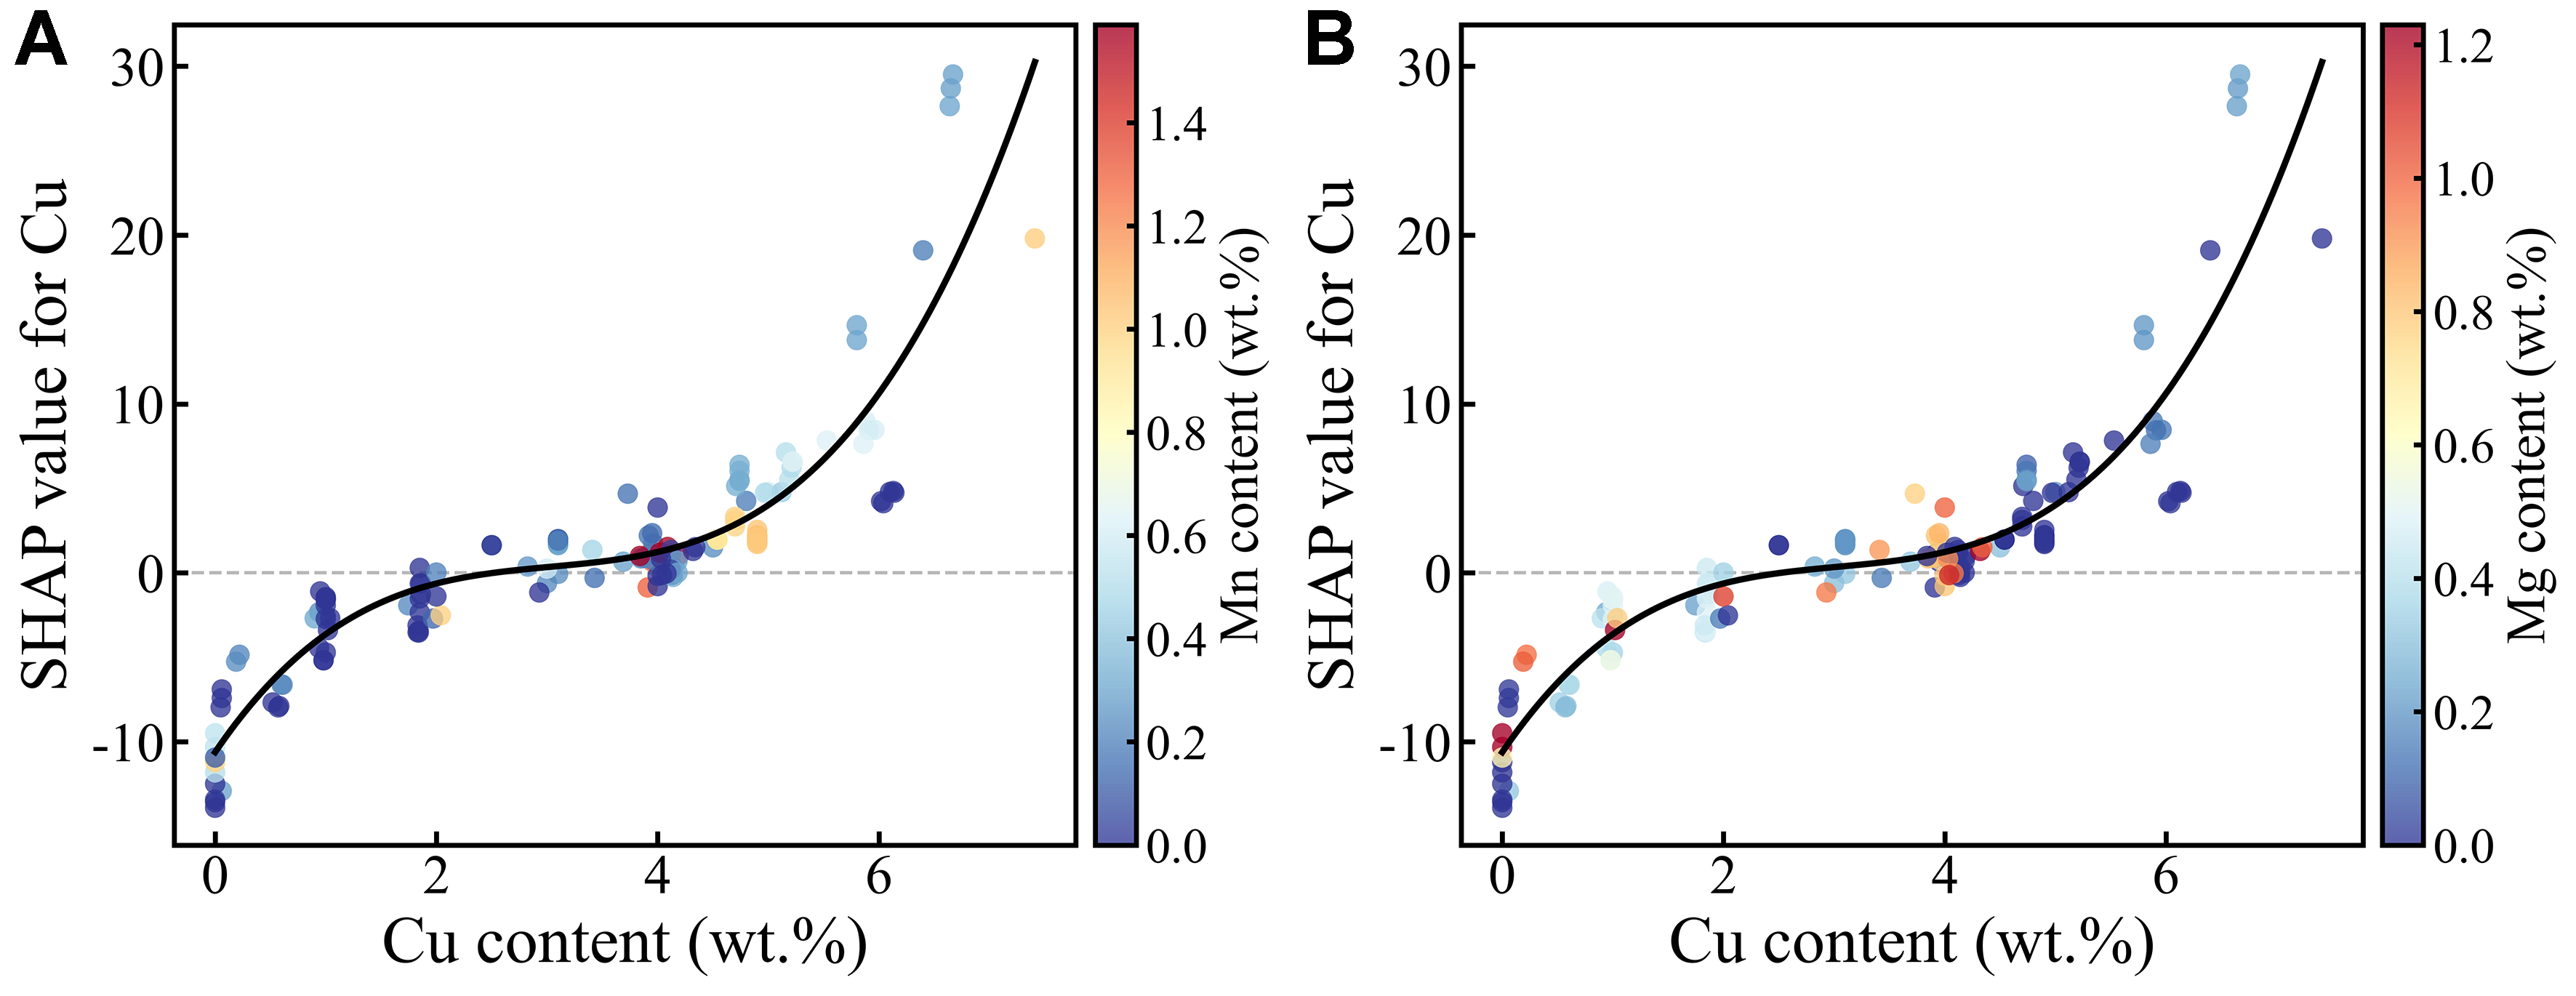
Figure 10. SHAP dependence plots for Cu content. (A) Colored by Mn content; (B) Colored by Mg content. The black fitted curve represents the overall trend between the Cu content and its SHAP value, while the color of the scatter points reflects the relative concentration of the corresponding modulating elements. SHAP: SHapley Additive exPlanations.


Journal of Materials Informatics
ISSN 2770-372X (Online)
Follow Us

Portico

All published articles are preserved here permanently:

https://www.portico.org/publishers/oae/

Portico

All published articles are preserved here permanently:

https://www.portico.org/publishers/oae/