


fig13
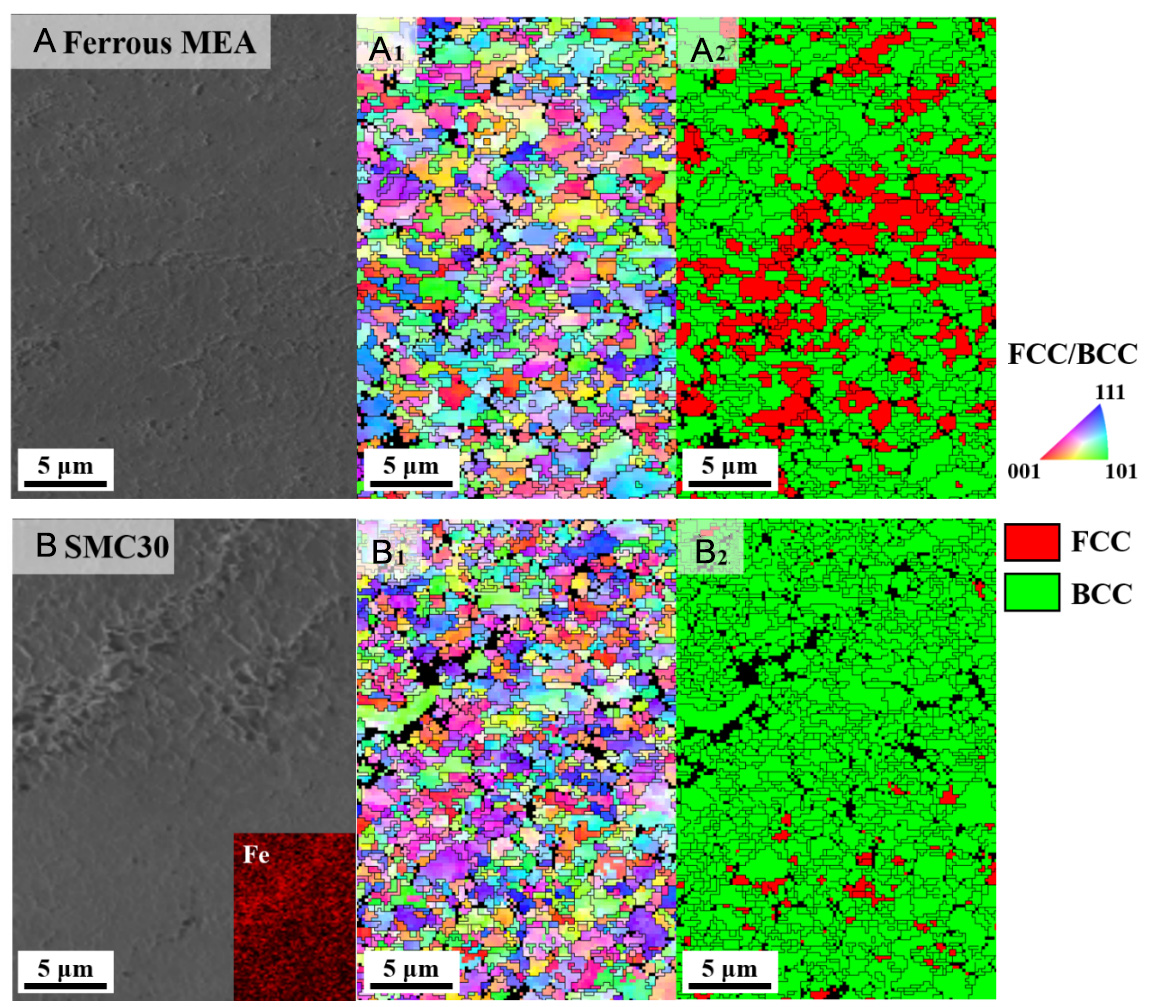
Figure 13. SEM micrographs with corresponding (1) EBSD-IPF and (2) EBSD-Phase maps of the (A) ferrous MEA and (B) SMC30 samples deformed at 77 K. Fe elemental distribution map of SMC30 sample is shown as an inset in (B). The KAM maps were calculated up to the third nearest neighbor with a maximum misorientation of 10°. SEM: Scanning electron microscopy; EBSD: electron backscatter diffraction; MEA: medium-entropy alloy; SMC: spatial metastability control; FCC: face-centered cubic; IPF: inverse pole figure; BCC: body-centered cubic; KAM: kernel average misorientation.


