


fig2
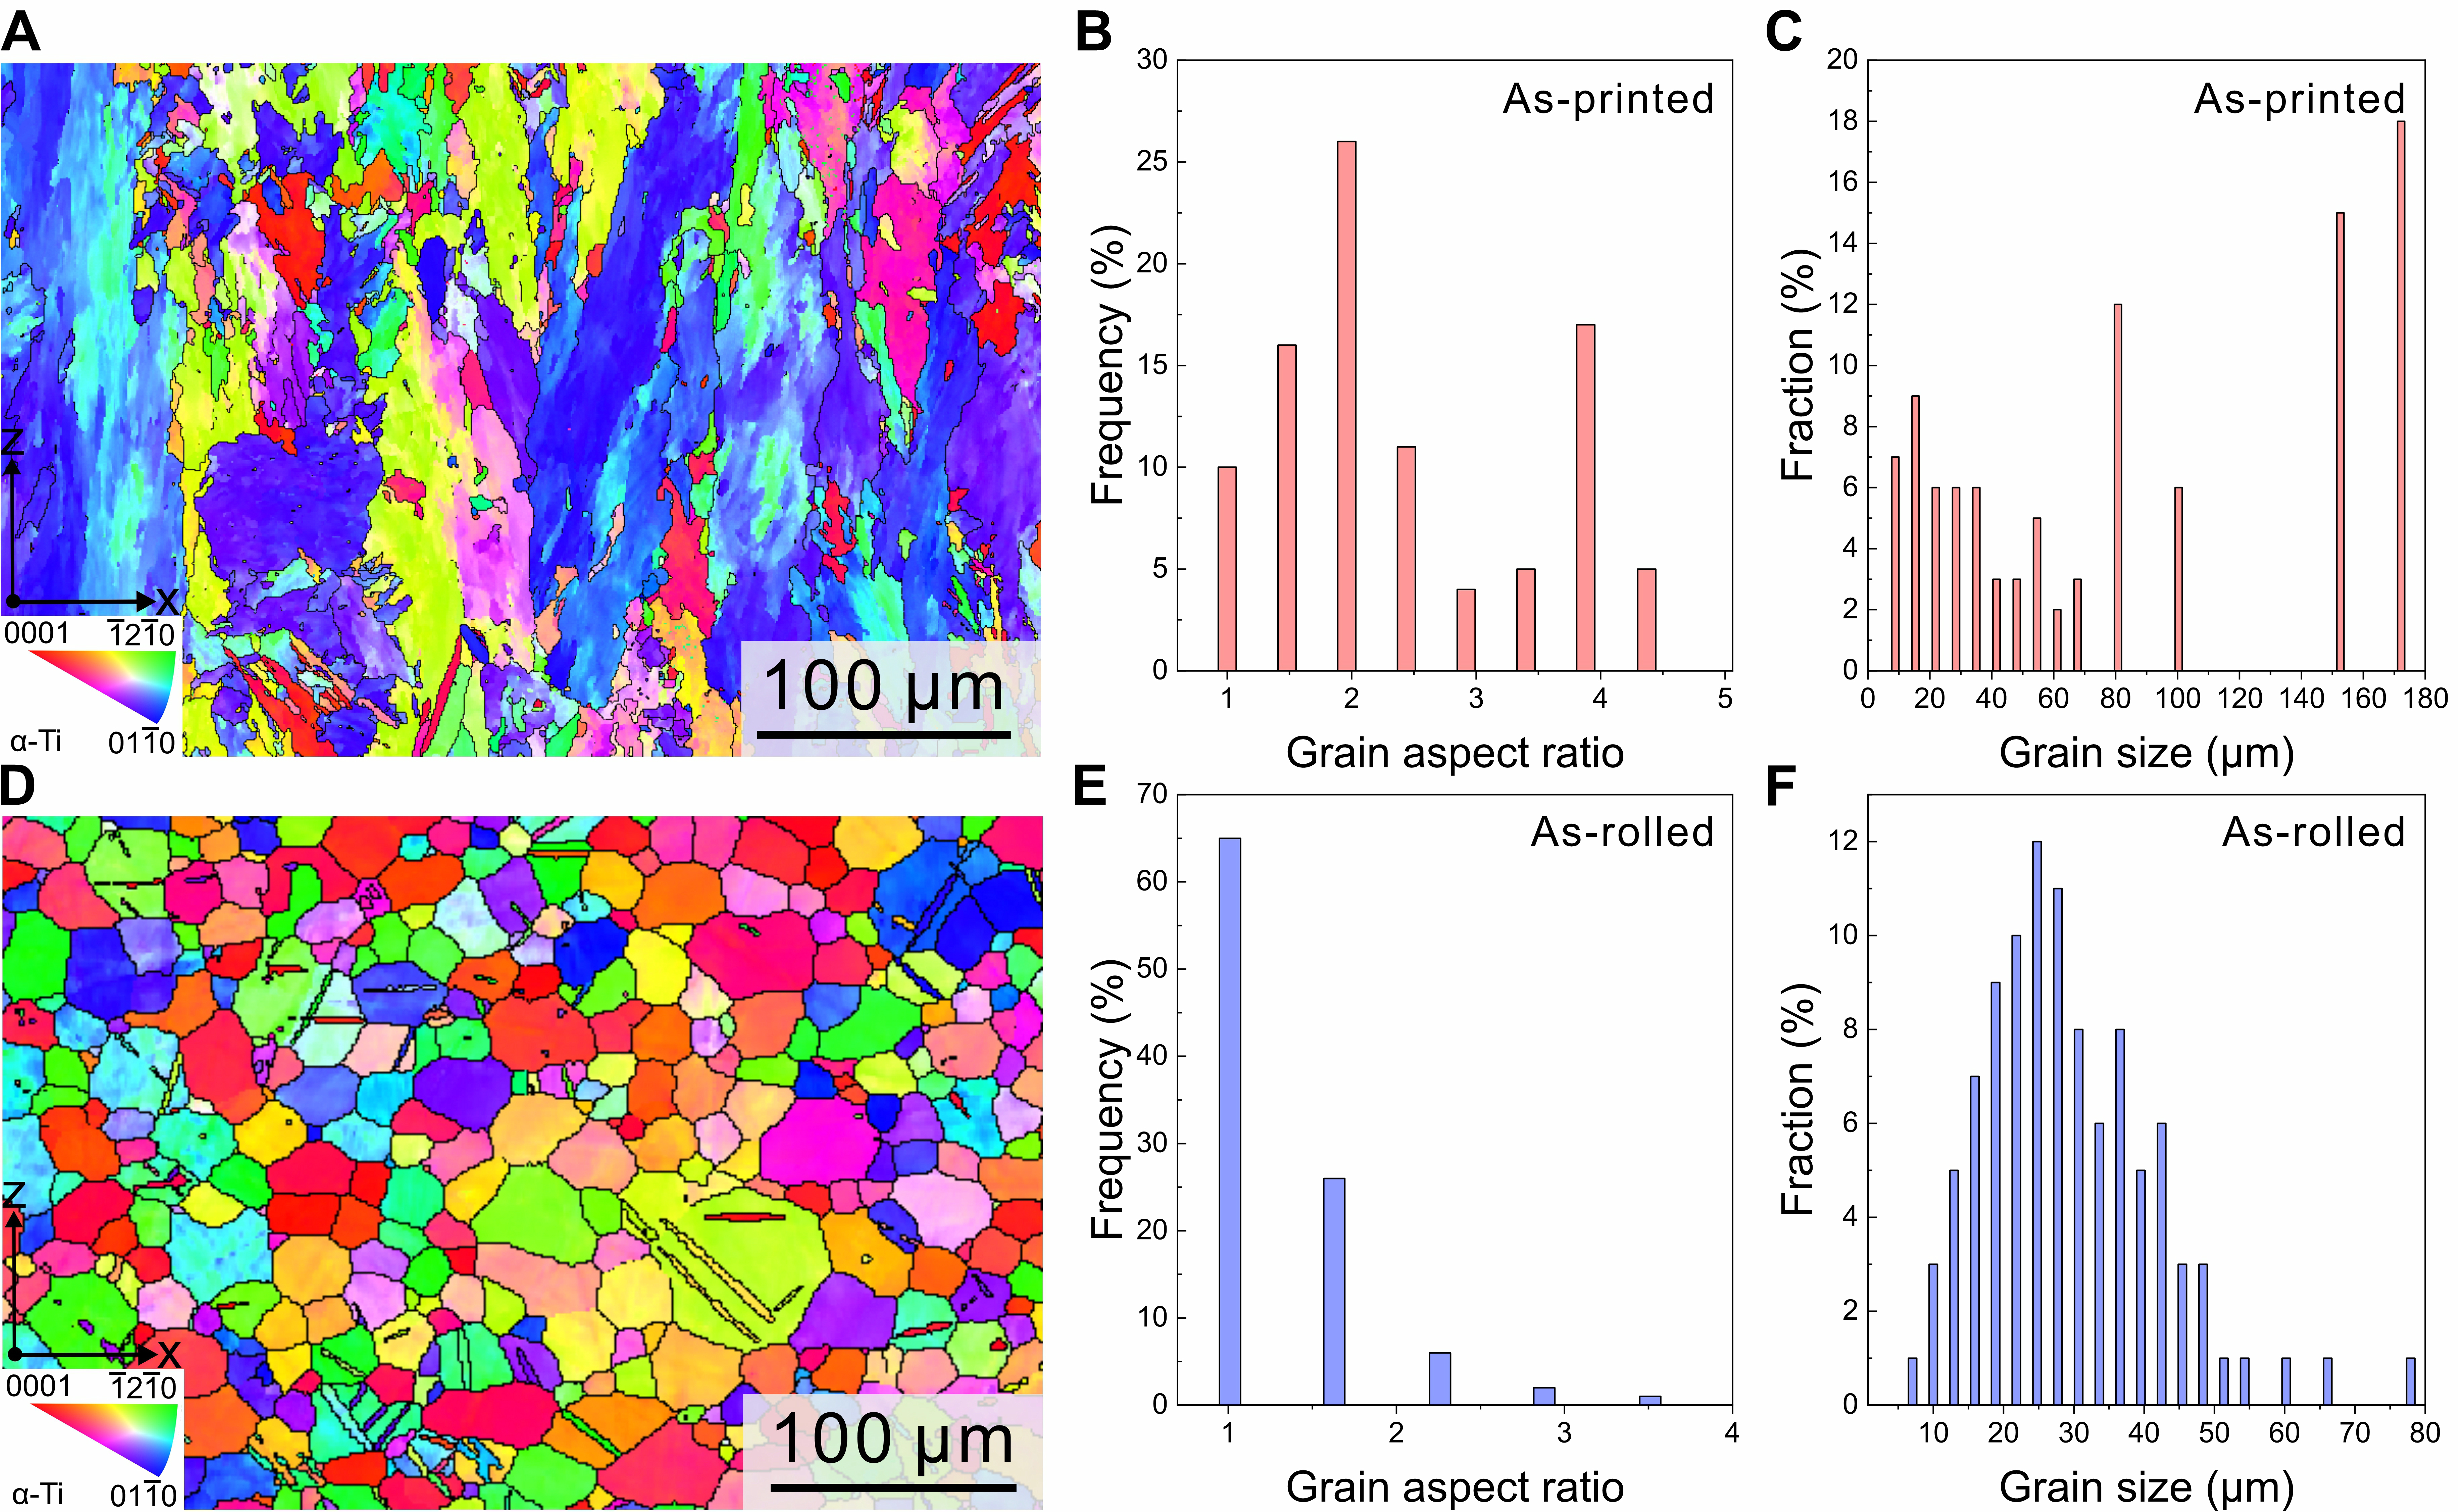
Figure 2. Microstructural characteristics of HS and HM Ti. (A-C) EBSD inverse pole figure (IPF) map, grain aspect ratio distribution, and grain size distribution illustrating the structural heterogeneity in HS Ti; (D-F) EBSD-IPF map, grain aspect ratio distribution, and grain size distribution showing the structural homogeneity in HM Ti. HS: Heterostructured; HM: homostructured; EBSD: electron backscatter diffraction.


