


fig5
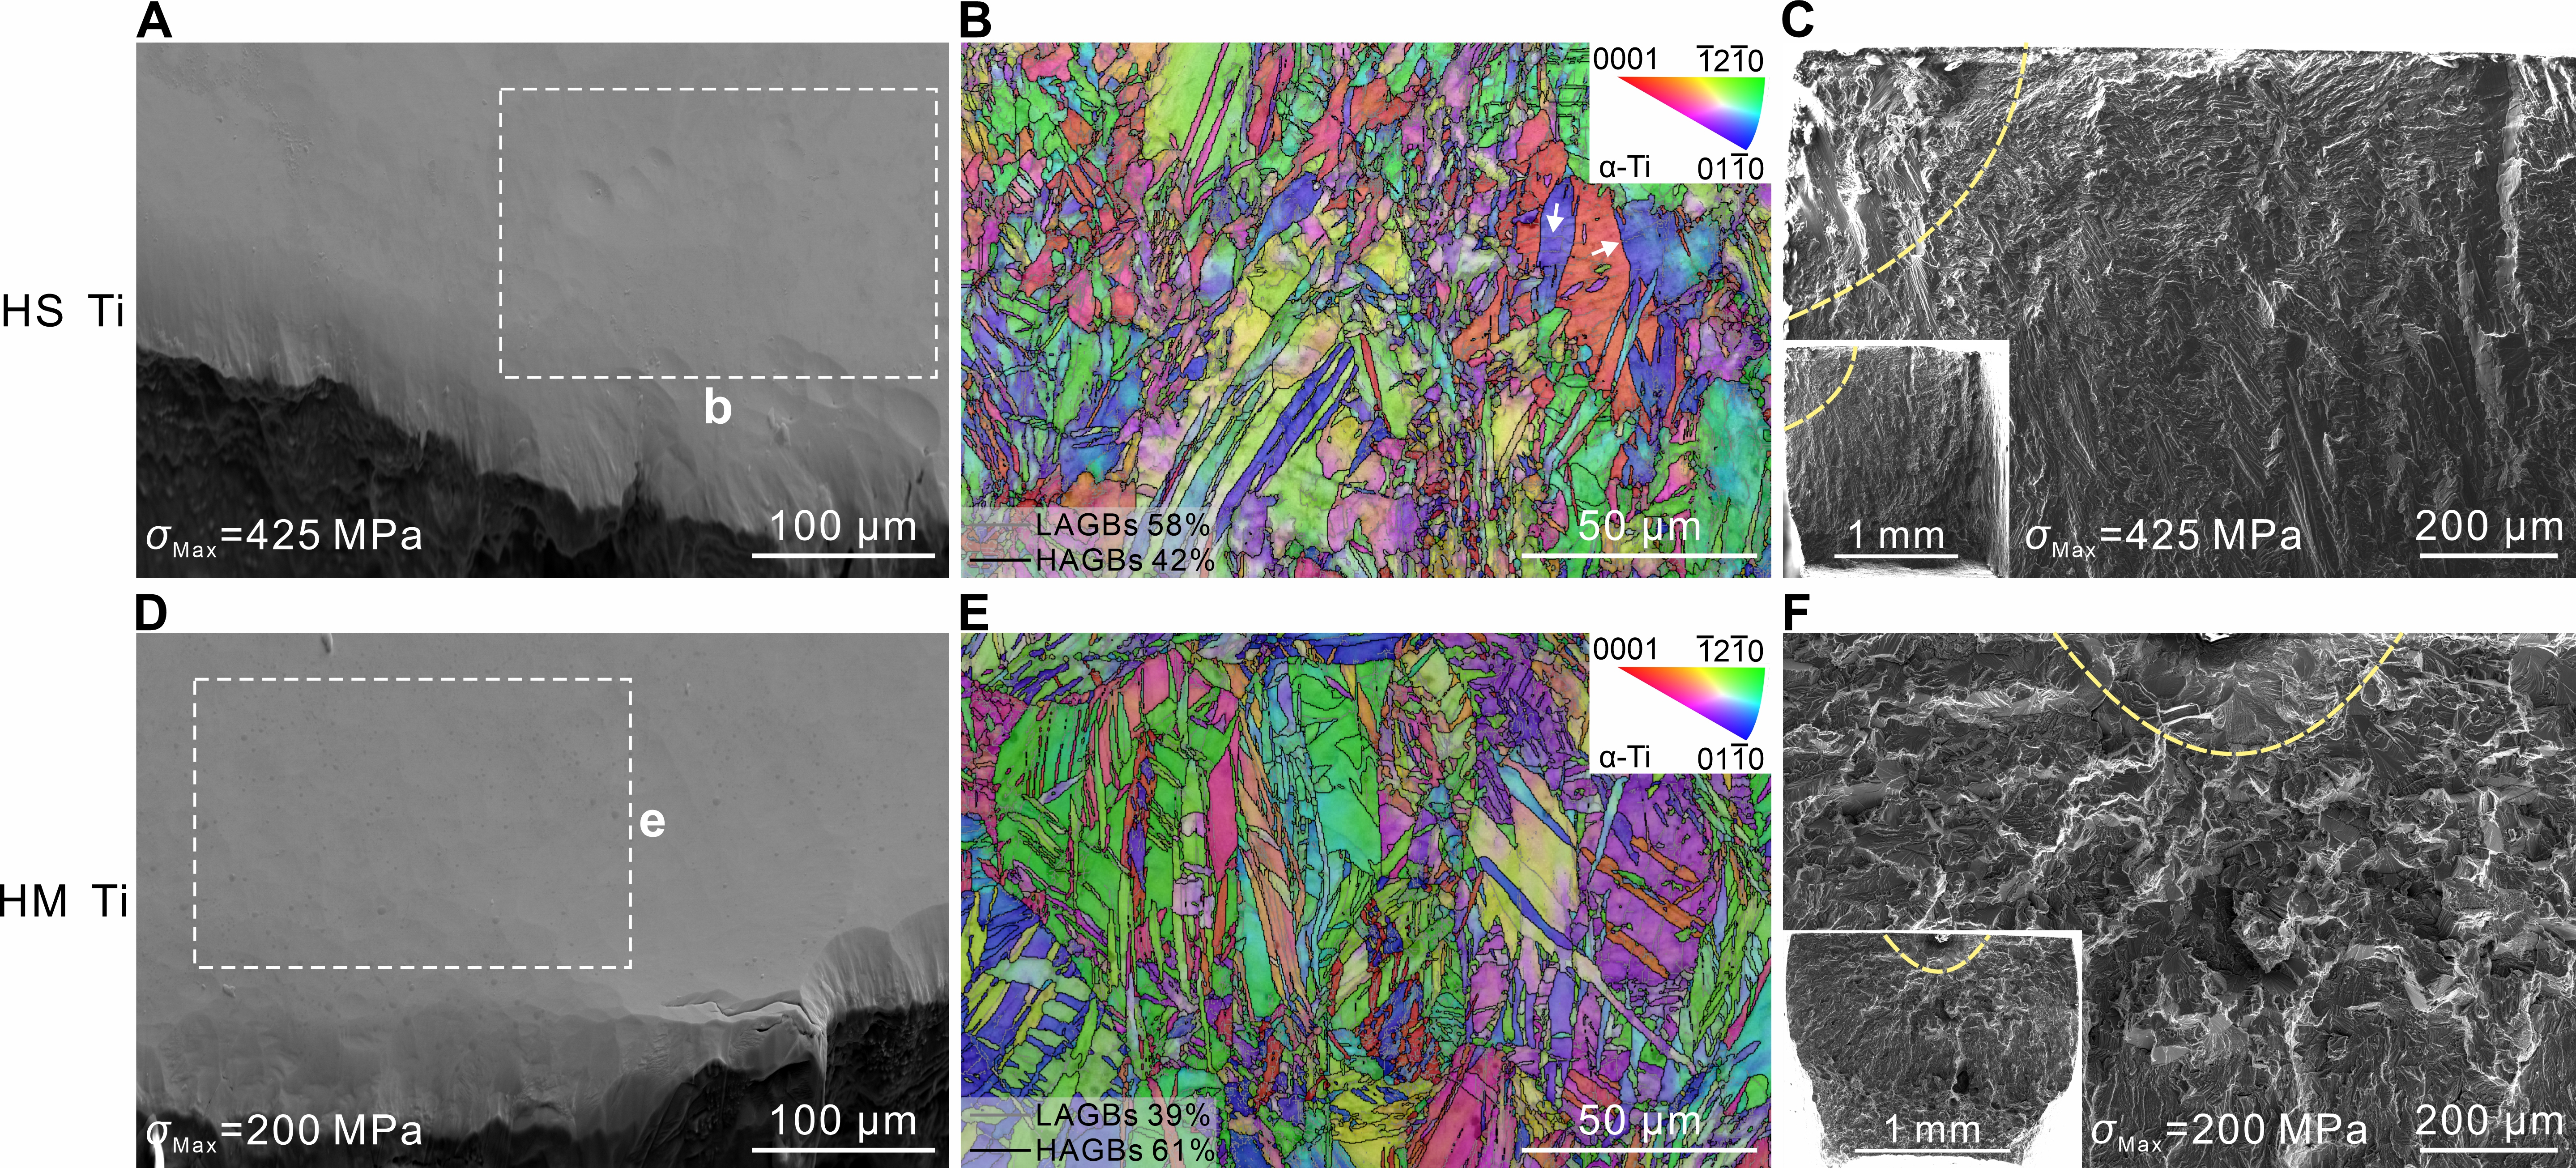
Figure 5. SEM images showing characteristics of fatigue damage morphology in HS and HM Ti after fatigue. (A-C) HS Ti after fatigue at σmax = 425 MPa; (D-F) HM Ti after fatigue at σmax = 200 MPa. LAGBs: Low-angle grain boundaries; HAGBs: high-angle grain boundaries; HS: heterostructured; HM: homostructured; SEM: scanning electron microscope.


